. 2024 Sep 27;15(1):8339.
doi: 10.1038/s41467-024-52565-2.

Mechanical force regulates ligand binding and function of PD-1

Affiliations

Mechanical force regulates ligand binding and function of PD-1

Kaitao Li et al. Nat Commun. .

Abstract

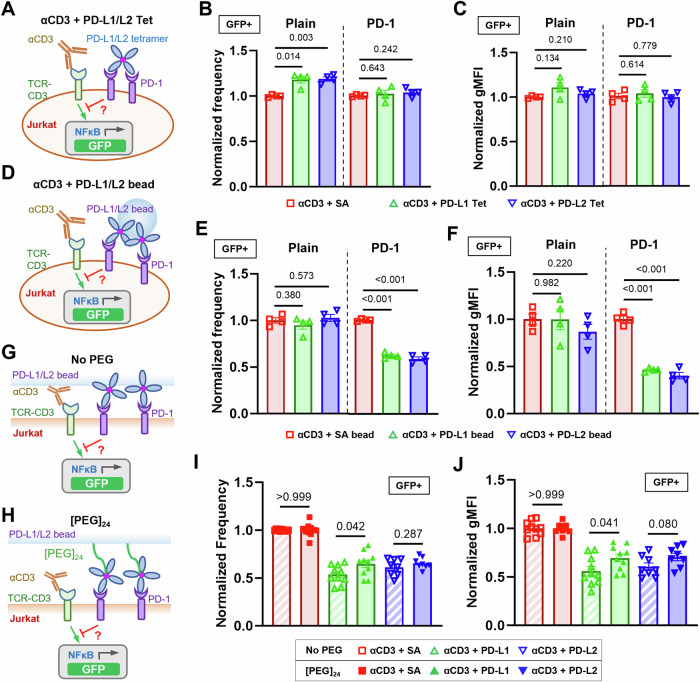
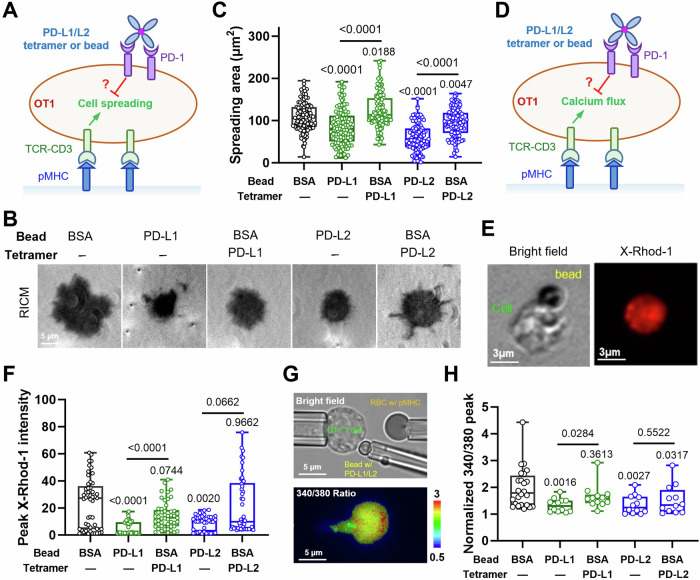
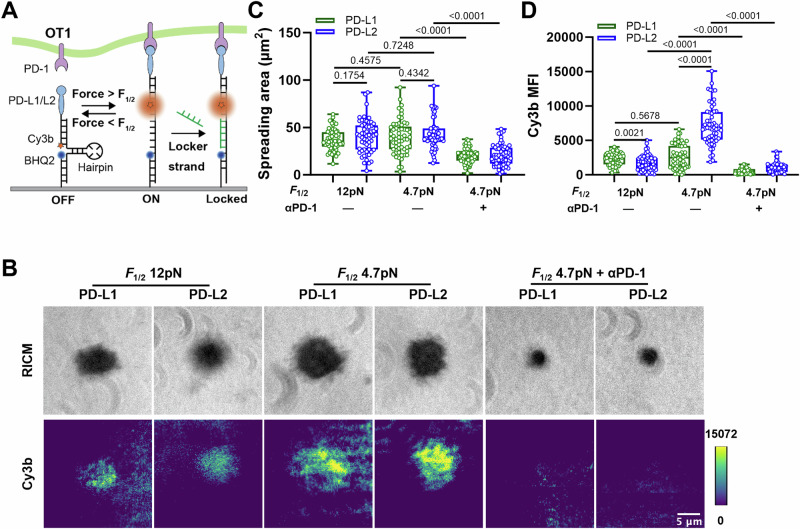
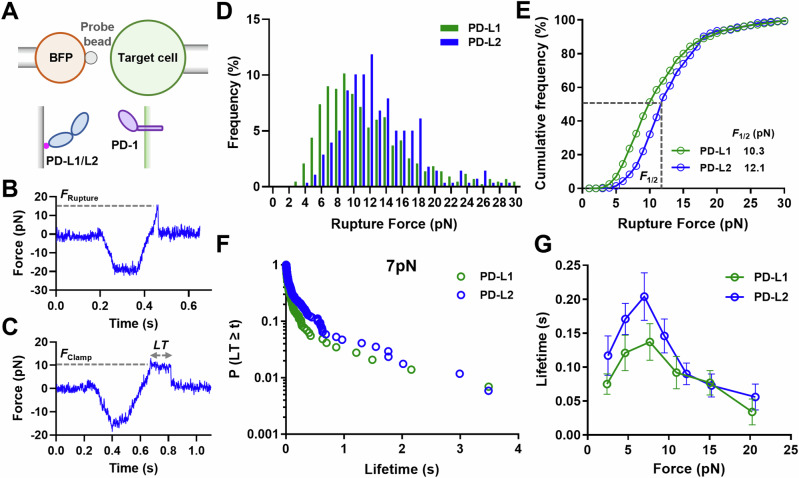
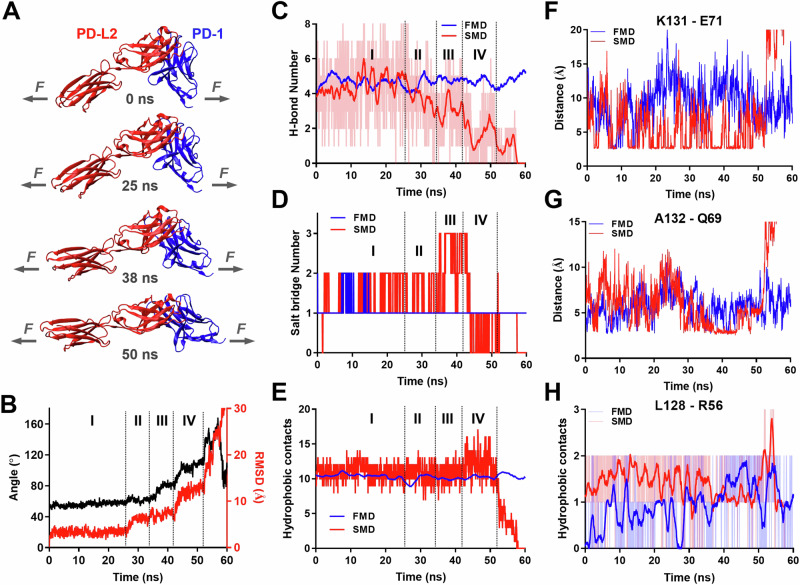
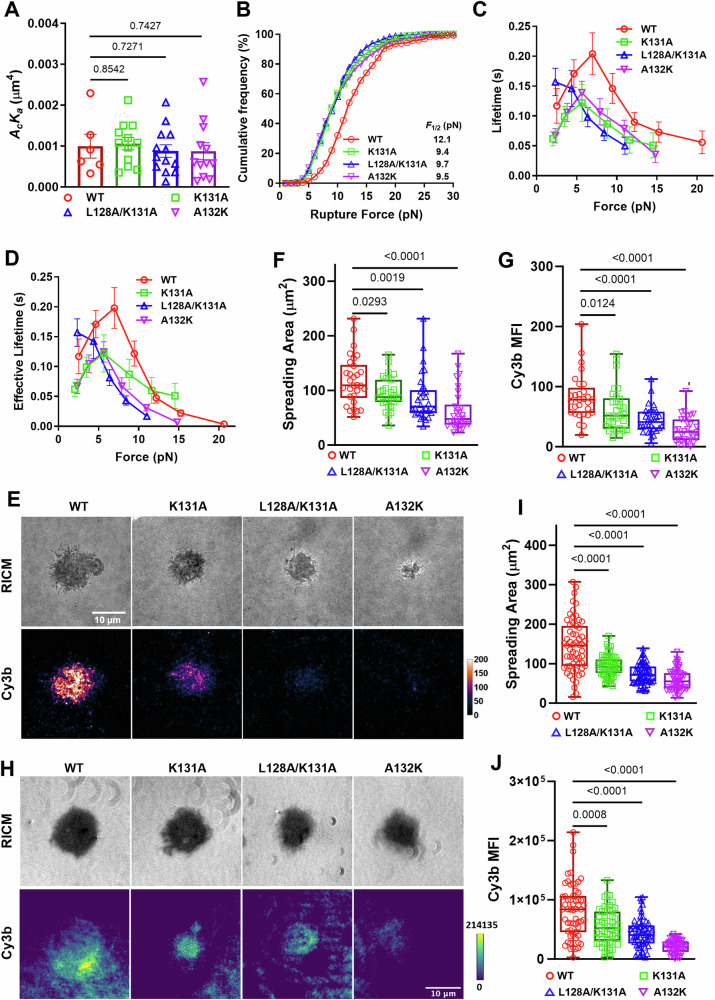
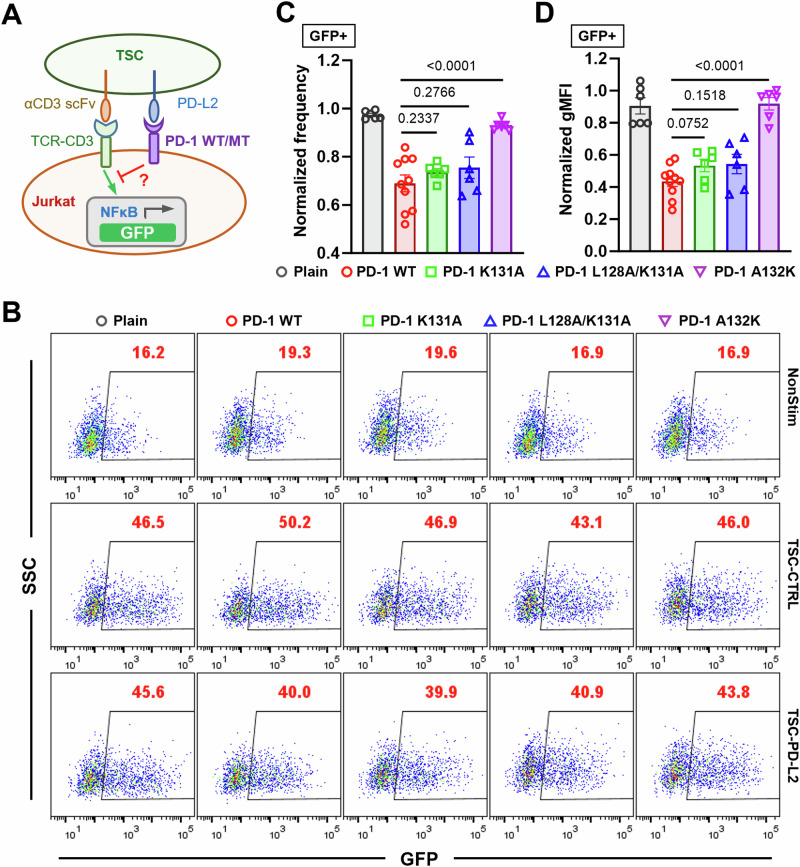
Despite the success of PD-1 blockade in cancer therapy, how PD-1 initiates signaling remains unclear. Soluble PD-L1 is found in patient sera and can bind PD-1 but fails to suppress T cell function. Here, we show that PD-1 function is reduced when mechanical support on ligand is removed. Mechanistically, cells exert forces to PD-1 and prolong bond lifetime at forces <7 pN (catch bond) while accelerate dissociation at forces >8pN (slip bond). Molecular dynamics of PD-1-PD-L2 complex suggests force may cause relative rotation and translation between the two molecules yielding distinct atomic contacts not observed in the crystal structure. Compared to wild-type, PD-1 mutants targeting the force-induced distinct interactions maintain the same binding affinity but suppressed/eliminated catch bond, lowered rupture force, and reduced inhibitory function. Our results uncover a mechanism for cells to probe the mechanical support of PD-1-PD-Ligand bonds using endogenous forces to regulate PD-1 signaling.


Conflict of interest statement

The authors declare no competing interests.

Figures

Fig. 1
Fig. 1. The inhibitory function of PD-1 on Jurkat cells is enhanced by mechanical support of PD-Ligands.
A Schematics of stimulating NFκB::eGFP reporter Jurkat cells with soluble anti-CD3 and soluble PD-ligand tetramers. B, C Quantification of GFP expression for condition in (A). n = 4 for all conditions pooled from two independent experiments. D Schematics of stimulating NFκB::eGFP reporter Jurkat cells with soluble anti-CD3 and PD-ligand-coated beads. E, F Quantification of GFP expression for condition in (B). n = 4 for all conditions pooled from two independent experiments. Schematics of stimulating NFκB::eGFP reporter Jurkat cells with soluble anti-CD3 and PD-Ligands coated beads without (G) or with (H) [PEG]24 spacer arm. I, J Quantification of GFP expression for conditions in (G, H). n = 10, 10, and 8 for SA, PD-L1, and PD-L2, respectively, pooled from 5 independent experiments. Normalized frequency (B, E, I) and normalized geometric mean fluorescence intensity (gMFI) (C, F, J) were calculated as (sample—averaged background)/(anti-CD3 control—averaged background) and presented as mean ± SEM. Numbers on graphs represent p values calculated from two-tailed student t test. Source data are provided in Source Data file.
Fig. 2
Fig. 2. The inhibitory function of PD-1 on activated primary T cells is enhanced by mechanical support of PD-Ligands.
A Schematics of measuring the suppression of pMHC (SIINFEKL:H2-Kb)-mediated OT1 T cell spreading by soluble PD-Ligand tetramer or PD-Ligand-coated beads. B Representative reflection interference contrast microscopy (RICM) images of an activated OT1 T cell spreading on glass surface functionalized with SIINFEKL:H2-Kb under indicated conditions. C Quantification of cell spreading area for conditions in (B). n = 114, 111, 115, 116, and 114 cells pooled from 2 independent experiments. D Schematics of measuring the suppression of pMHC (SIINFEKL:H2-Kb)-mediated OT1 T cell calcium flux by soluble PD-Ligand tetramer or PD-Ligand-coated beads. E Representative bright-field and X-Rhod-1 images of SIINFEKL:H2-Kb surface stimulation of an OT1 T cell bound to PD-L1-coated beads. F Quantification of peak X-Rhod-1 fluorescence under indicated conditions for experiments illustrated in (D, E). n = 49, 49, 49, 38, and 49 cells. G Representative bright-field (upper) and Fura-2 340/380 radiometric pseudocolor (lower) images illustrating measurement of the suppression of pMHC (SIINFEKL:H2-Kb)-mediated OT1 T cell calcium flux by soluble PD-Ligand tetramer or PD-Ligand-coated beads using a fluorescence micropipette adhesion frequency (fMAF) setup using three micropipettes. See also Movie S1. H Quantification of peak Fura-2 340/380 ratios under indicated conditions for experiments illustrated in (G). n = 24, 12, 12, 12, and 12 T cell-RBC pairs pooled from 2 independent experiments. Data were presented in box (median with 25%/75% boundaries) and whisker (min and max) plots. Numbers on graphs represent p values calculated from two-tailed Mann–Whitney U test of indicated two groups or the experiment group (green or blue) with BSA control (black). Source data are provided in Source Data file.
Fig. 3
Fig. 3. DNA-based MTPs reveal OT1 T cells applying forces to PD-1–PD-Ligand bonds.
A Schematics of visualizing endogenous forces on PD-1–PD-Ligand bonds using DNA-based molecular tension probes (MTPs). Forces above the force threshold unfold the hairpin to separate Cy3B from the BHQ2, which de-quenches the fluorophore. A complementary single stranded DNA (locker) in solution hybridizes with the unfolded hairpin to lock it in the open configuration, which enables accumulation of the fluorescence signals over time. B Representative reflection interference contrast microscopy (RICM) and total internal reflection fluorescence (TIRF) images of activated OT1 T cells interacting with glass surface functionalized with MTPs of indicated conditions. For PD-1 blockade, cells were pre-incubated with PD-1 blocking antibody clone 29 F.1A12 before imaging. Quantification of cell spreading area (C) and Cy3b fluorescence (D) for conditions in (B). n = 57, 59, 58, 57, 60, and 58 pooled from 1 in 3 independent experiments. Data were presented in box (median with 25%/75% boundaries) and whisker (min and max) plots. Numbers on graphs represent p values calculated from two-tailed Mann–Whitney U test. Source data are provided in Source Data file.
Fig. 4
Fig. 4. PD-1 forms catch bond with PD-L1 and PD-L2.
A Schematics of force spectroscopic analysis of PD-1–PD-Ligand bonds using biomembrane force probe (BFP). CHO cells expressing PD-1 were analyzed against BFP bead coated with PD-L1 or PD-L2. Bead displacements were tracked with high spatiotemporal resolution and translated into force after multiplying by the spring constant of BFP. Representative raw traces of rupture force (B) and bond lifetime (C) measurements. A target cell held by piezo-driven micropipette was brought into brief contact with a bead (approach and contact) to allow for bond formation. Upon separation the target cell either kept retracting to rupture the bond (B) or stopped and held at a predefined force level until bond dissociated spontaneously (C). Force histograms (D) and cumulative frequencies (E) of rupture events of 433 PD-1–PD-L1 and 278 PD-1–PD-L2 bonds. F1/2 is defined as the force level at which 50% of the bonds are ruptured. p < 0.0001 comparing F1/2 of PD-1–PD-L1 and PD-1–PD-L2 using two-tailed Mann–Whitney test. Survival frequencies at the 7 pN force bin (F) and mean ± sem bond lifetime vs force plots (G) of PD-1–PD-L1 (n = 55, 129, 144, 120, 33, and 16 lifetime events) and PD-1–PD-L2 (n = 29, 165, 170, 173, 105, 82, and 53 lifetime events) bonds. p < 0.0001 comparing lifetime vs force distributions of PD-1–PD-L1 and PD-1–PD-L2 using two-tailed two-dimensional Kolmogorov-Smirnov test. Source data are provided in Source Data file.
Fig. 5
Fig. 5. Molecular dynamics (MD) reveals force induced PD-1–PD-L2 conformational change and formation of distinct atomic-level contacts.
A Snapshots of PD-1–PD-L2 complex undergoing conformational changes in response to force at indicated simulation times. B Changes in relative angle (black curve, left y-axis) and root mean square displacement (RMSD, red curve, right y-axis) between PD-1 and PD-L2 in response to force. Comparison of total number of hydrogen bond (H-bond, C), salt bridge (D), and hydrophobic contacts (E) between PD-1 and PD-L2 during free MD (FMD, blue) and force steered MD (SMD, red). FH Comparison of dynamics of putative interactions between indicated residues of PD-1 and PD-L2 during FMD (blue) and SMD (red). Atomic-level contacts were defined by an interatomic distance of <3.5 Å, which were more frequently observed in SMD than in FMD. Source data are provided in Source Data file.
Fig. 6
Fig. 6. PD-1 mutants preventing force-induced atomic contacts impair PD-1–PD-L2 mechanical stability.
A Mean ± sem and individual measurements of 2D effective affinity of PD-L2 binding to CHO cells expressing WT or indicated mutants of PD-1. n = 6, 12, 13, and 12 cell pairs for WT, K131A, L128A/K131A, and A132K, respectively. B Cumulative frequencies of rupture force events for PD-L2 bonds with PD-1 WT (n = 278 events), K131A (n = 210 events), L128A/K131A (n = 345 events), and A132K (n = 270 events) expressed on CHO cells. p < 0.0001 comparing F1/2 of WT and each mutant using two-tailed Mann–Whitney U test. C Mean ± sem bond lifetime vs force plots for single PD-L2 bonds with PD-1 WT (n = 785 events), K131A (n = 625 events), L128A/K131A (n = 759 events), and A132K (n = 780 events) on CHO cells. p < 0.0001 comparing lifetime vs force distributions of WT and each mutant using two-tailed two-dimensional Kolmogorov-Smirnov test. D Effective bond lifetime calculated as multiplying bond lifetime in (C) by bond survival probability in (B). E Representative RICM and TIRF images of CHO cells expressing PD-1 WT or indicated mutants interacting with glass surface functionalized with PD-L2-coupled MTP of 4.7 pN threshold force (see Fig. S4A for schematic). Quantification of cell spreading area (F) and tension signal (G) for conditions in (E). n = 29, 30, 30, and 30 pooled from 3 independent experiments. H Representative RICM and TIRF images of NFκB::eGFP reporter Jurkat cells expressing PD-1 WT or indicated mutants interacting with glass surface functionalized with PD-L2-coupled MTP of 4.7 pN threshold force (see Fig. 3A for schematic). Quantification of cell spreading area (I) and tension signal (J) for conditions in (E). n = 59, 58, 59, and 59 cells from 1 in 2 independent experiments. Data were presented in box (median with 25%/75% boundaries) and whisker (min and max) plots. Numbers on graphs represent p values calculated from two-tailed Mann–Whitney U test. Source data are provided in Source Data file.
Fig. 7
Fig. 7. PD-1 mutants with impaired PD-1–PD-L2 mechanical stability demonstrate reduced inhibitory function.
A Schematics of TSC-PD-L2 cells stimulation of NFκB::eGFP reporter Jurkat cells expressing no, WT, or indicated mutants of PD-1. B Representative SSC vs GFP plots of reporter Jurkat cells 24 h after stimulation with indicated conditions. C, D Quantification of GFP expression for conditions in (B). Normalized frequency (C) and normalized geometric mean fluorescence intensity (gMFI) (D) were calculated as (sample–averaged background)/(Plain—averaged background) and presented as mean ± SEM. n = 6 for plain, PD-1 K131A, L128K/K131A, and A132K pooled from 3 independent experiments or n = 10 for PD-1 reporter cells pooled from 5 independent experiments. Numbers on graphs represent p values calculated from two-tailed student t test. Source data are provided in Source Data file.

Update of

References

    1. Barber, D. L. et al. Restoring function in exhausted CD8 T cells during chronic viral infection. Nature439, 682–687 (2006). - PubMed
    1. Day, C. L. et al. PD-1 expression on HIV-specific T cells is associated with T-cell exhaustion and disease progression. Nature443, 350–354 (2006). - PubMed
    1. Jin, H. T., Ahmed, R. & Okazaki, T. Role of PD-1 in regulating T-cell immunity. Curr. Top. Microbiol. Immunol.350, 17–37 (2011). - PubMed
    1. Ishida, Y., Agata, Y., Shibahara, K. & Honjo, T. Induced expression of PD-1, a novel member of the immunoglobulin gene superfamily, upon programmed cell death. EMBO J.11, 3887–3895 (1992). - PMC - PubMed
    1. Yokosuka, T. et al. Programmed cell death 1 forms negative costimulatory microclusters that directly inhibit T cell receptor signaling by recruiting phosphatase SHP2. J. Exp. Med.209, 1201–1217 (2012). - PMC - PubMed

Publication types

MeSH terms

LinkOut - more resources