. 2024 Sep 27;15(1):8402.
doi: 10.1038/s41467-024-52622-w.

Predicting standardized uptake value of brown adipose tissue from CT scans using convolutional neural networks

Affiliations

Predicting standardized uptake value of brown adipose tissue from CT scans using convolutional neural networks

Ertunc Erdil et al. Nat Commun. .

Erratum in

Abstract

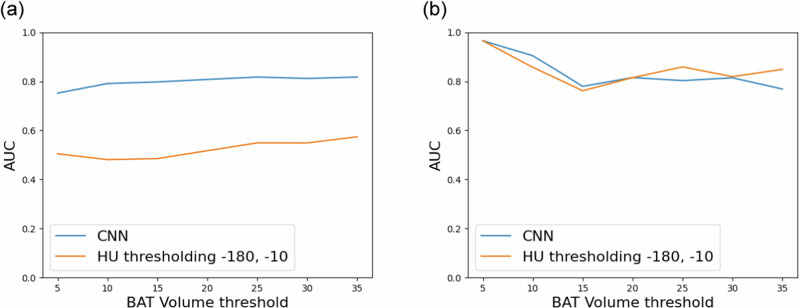
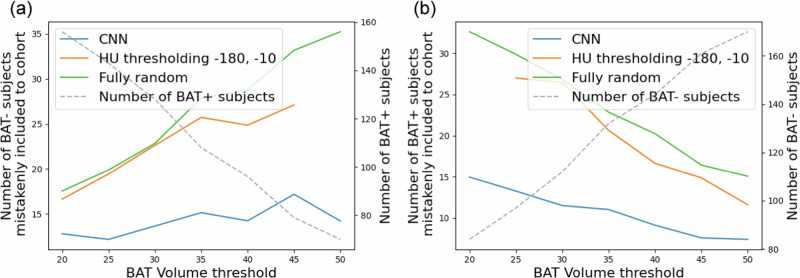
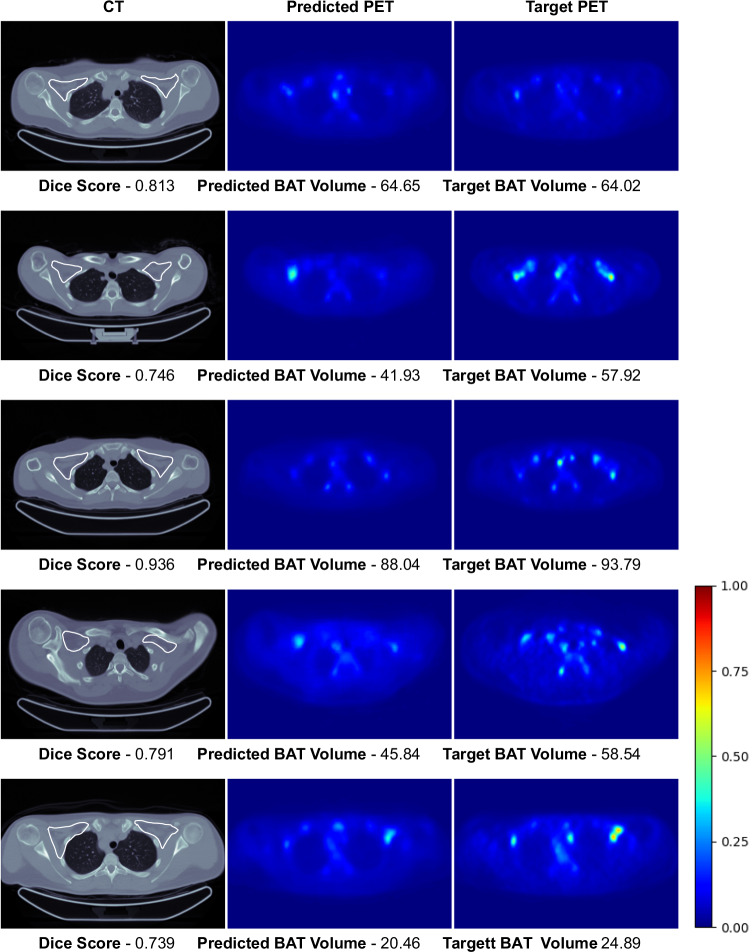
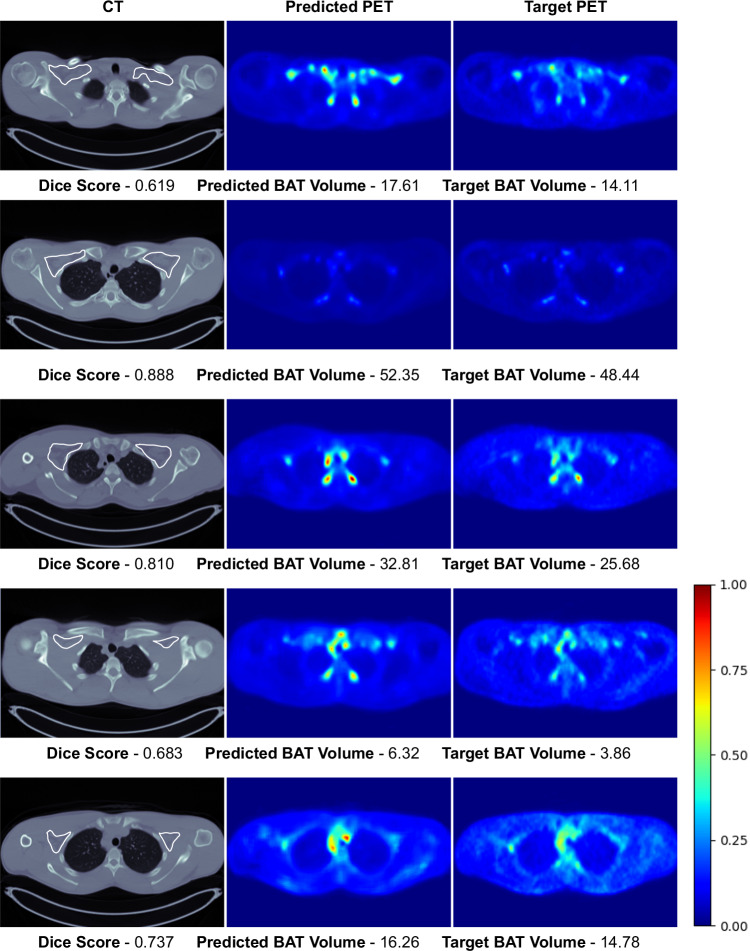
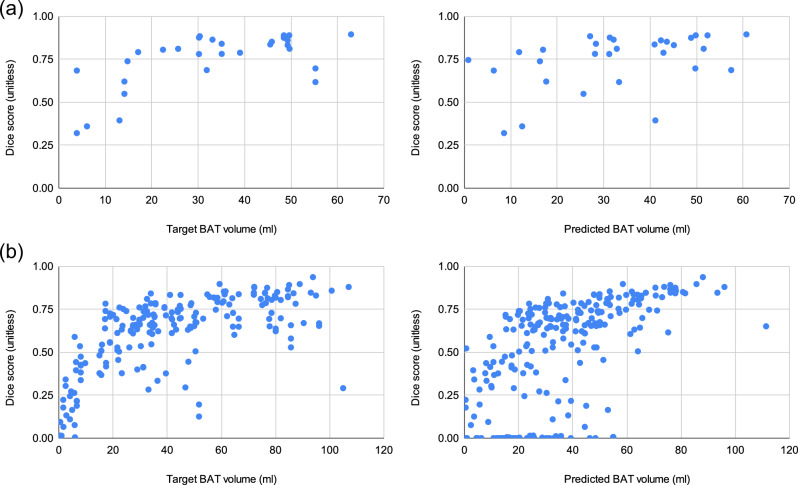
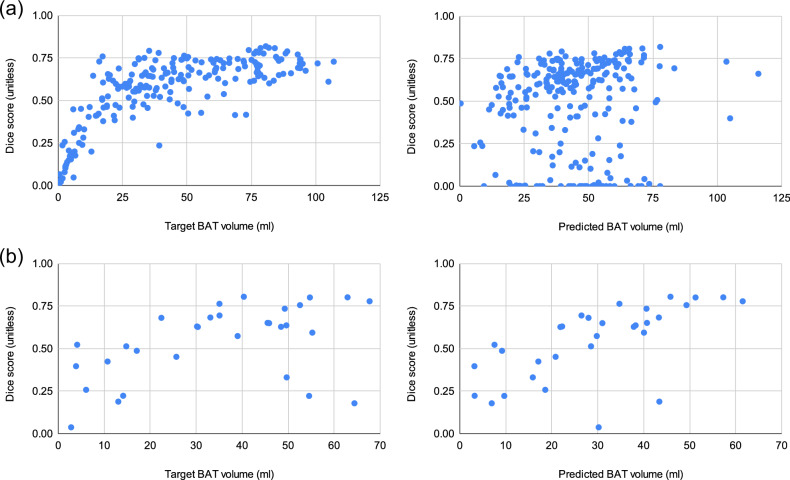
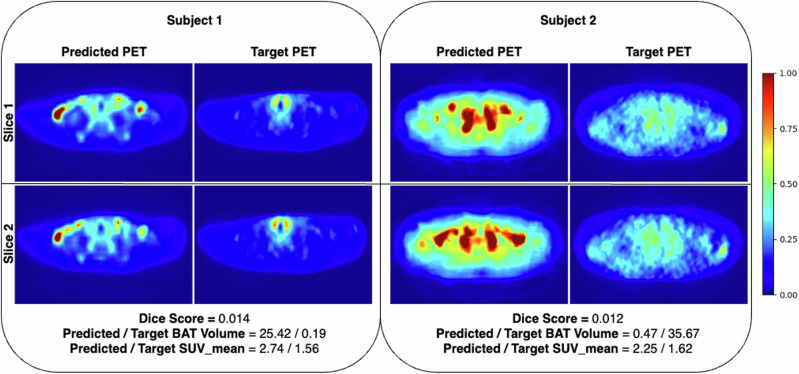
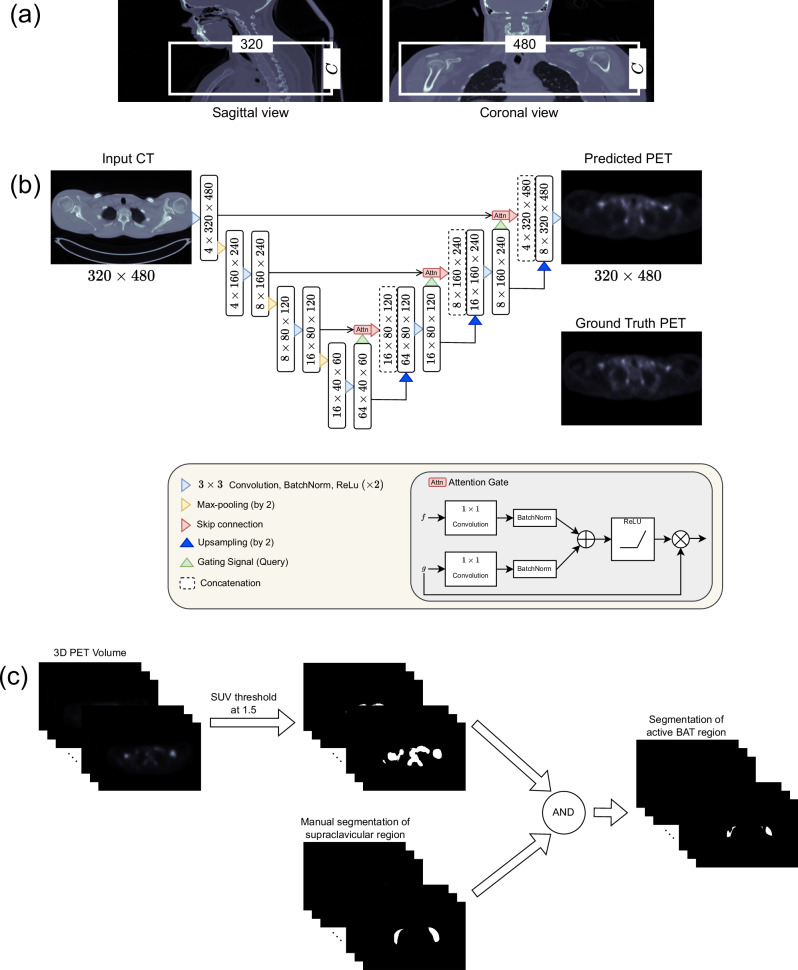
The standard method for identifying active Brown Adipose Tissue (BAT) is [18F]-Fluorodeoxyglucose ([18F]-FDG) PET/CT imaging, which is costly and exposes patients to radiation, making it impractical for population studies. These issues can be addressed with computational methods that predict [18F]-FDG uptake by BAT from CT; earlier population studies pave the way for developing such methods by showing some correlation between the Hounsfield Unit (HU) of BAT in CT and the corresponding [18F]-FDG uptake in PET. In this study, we propose training convolutional neural networks (CNNs) to predict [18F]-FDG uptake by BAT from unenhanced CT scans in the restricted regions that are likely to contain BAT. Using the Attention U-Net architecture, we perform experiments on datasets from four different cohorts, the largest study to date. We segment BAT regions using predicted [18F]-FDG uptake values, achieving 23% to 40% better accuracy than conventional CT thresholding. Additionally, BAT volumes computed from the segmentations distinguish the subjects with and without active BAT with an AUC of 0.8, compared to 0.6 for CT thresholding. These findings suggest CNNs can facilitate large-scale imaging studies more efficiently and cost-effectively using only CT.


Conflict of interest statement

The authors declare no competing interests.

Figures

Fig. 1
Fig. 1. AUC scores for classifying subjects as BAT+ and BAT- using the predicted BAT volume at various BAT volume thresholds.
The plots show (a) intra and (b) inter-cohort performance of the Granada model, the CNN trained with the largest cold exposure cohort in our experiments.
Fig. 2
Fig. 2. The results demonstrating the patient stratification performance of different methods.
The number of subjects mistakenly included in a cohort when creating stratified cohorts of (a) BAT+ and (b) BAT− subjects. Note that the dashed gray lines in the plots belong to the second y-axes.
Fig. 3
Fig. 3. Visual results of the Granada model’s high-accuracy predictions on the test set of the Granada cohort.
Rough manual segmentation of the supraclavicular region is delineated with white contour on CT scans. Note that each raw corresponds to an axial slice of a different subject and the images are normalized with respect to the max SUV value in the target PET scans for visualization purposes.
Fig. 4
Fig. 4. Visual results of the Basel model’s predictions on the test set of the Basel cohort.
Rough manual segmentation of the supraclavicular region is delineated with white contour on CT scans. Note that each raw corresponds to an axial slice of a different subject and the images are normalized with respect to the max SUV value in the target PET scans for visualization purposes.
Fig. 5
Fig. 5. Scatter plots of Target BAT volume (ml) vs. Dice score (unitless) and Predicted BAT volume (ml) vs. Dice score (unitless) for the intra-cohort experiments.
a CNN trained on Basel cohort. b CNN trained on Granada cohort.
Fig. 6
Fig. 6. Scatter plots of Target BAT volume (ml) vs. Dice score (unitless) and Predicted BAT volume (ml) vs. Dice score (unitless) for the inter-cohort experiments.
a CNN trained on Basel cohort evaluated on Granada cohort. b CNN trained on Granada cohort evaluated on Basel cohort.
Fig. 7
Fig. 7. Visual examples of target and predicted PET scans for the samples with low BAT activity where CNNs make over-predictions in many slices, leading to low quantitative results.
Note that we present examples of two different subjects from the Granada cohort where each row corresponds to a different axial slice of the subjects. In such examples, we observed that CNNs consistently make over-predictions in many slices, possibly due to the bias introduced by the dominance of subjects with high BAT activity in the training set. Note that the images are normalized with respect to the max SUV value in the target PET scans for visualization purposes.
Fig. 8
Fig. 8. Illustration of the flow for predicting PET activity of BAT from CT scans and segmenting the active BAT region.
a Illustration of cropping to obtain a region of interest (ROI) that contains the supraclavicular region. Note that C indicates the number of slices in the axial dimension and can slightly change for different subjects. After cropping, the slices are given as input to the CNN shown in (b). b Schematic of the Attention U-Net architecture. c Detecting active BAT regions from a PET volume. Note that “AND" represents the logical and operator that we used to mask out false positive regions obtained after thresholding.

References

    1. Grarup, N., Sandholt, C. H., Hansen, T. & Pedersen, O. Genetic susceptibility to type 2 diabetes and obesity: from genome-wide association studies to rare variants and beyond. Diabetologia57, 1528–1541 (2014). - PubMed
    1. Sheu, W. H.-H., Brunell, S. C. & Blase, E. Efficacy and tolerability of exenatide twice daily and exenatide once weekly in asian versus white patients with type 2 diabetes mellitus: a pooled analysis. Diab. Res. Clin. Pract.114, 160–172 (2016). - PubMed
    1. Gupta, A. K. et al. Ethnic differences in blood pressure response to first and second-line antihypertensive therapies in patients randomized in the ascot trial. Am. J. Hypertens.23, 1023–1030 (2010). - PubMed
    1. Dourish, P. What we talk about when we talk about context. Personal. Ubiquitous Comput.8, 19–30 (2004).
    1. Cohen, P. & Spiegelman, B. M. Cell biology of fat storage. Mol. Biol. Cell27, 2523–2527 (2016). - PMC - PubMed

Publication types

Substances

LinkOut - more resources