. 2024 Sep 27;15(1):8342.
doi: 10.1038/s41467-024-52691-x.

Split crRNA with CRISPR-Cas12a enabling highly sensitive and multiplexed detection of RNA and DNA

Affiliations

Split crRNA with CRISPR-Cas12a enabling highly sensitive and multiplexed detection of RNA and DNA

Yichuan Chen et al. Nat Commun. .

Abstract

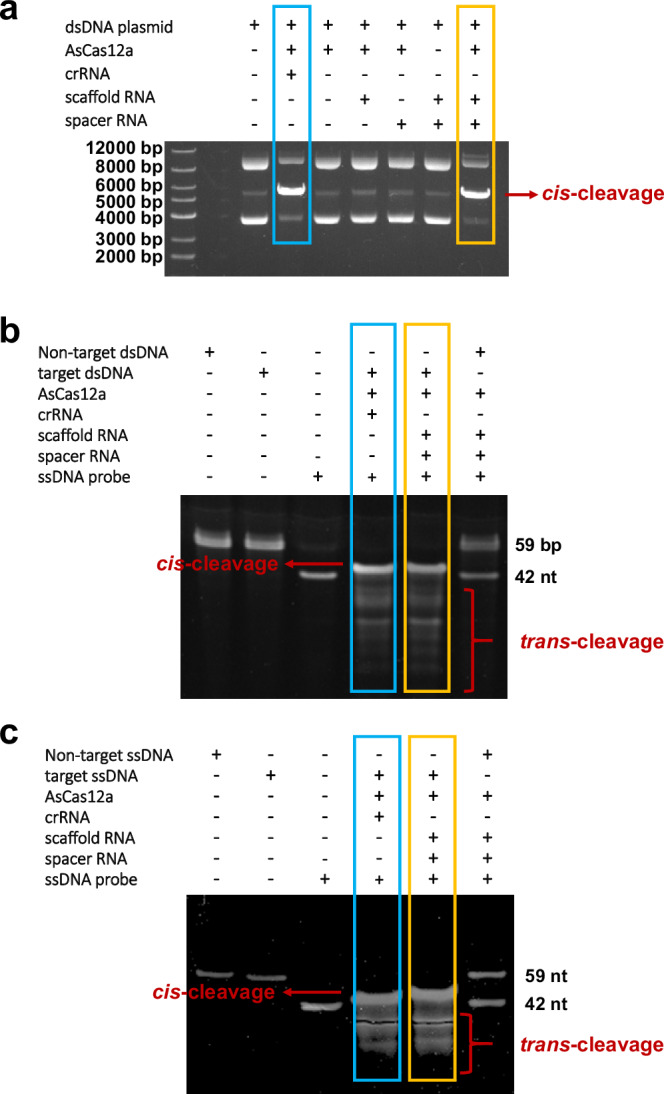
The CRISPR-Cas12a system has revolutionized nucleic acid testing (NAT) with its rapid and precise capabilities, yet it traditionally required RNA pre-amplification. Here we develop rapid fluorescence and lateral flow NAT assays utilizing a split Cas12a system (SCas12a), consisting of a Cas12a enzyme and a split crRNA. The SCas12a assay enables highly sensitive, amplification-free, and multiplexed detection of miRNAs and long RNAs without complex secondary structures. It can differentiate between mature miRNA and its precursor (pre-miRNA), a critical distinction for precise biomarker identification and cancer progression monitoring. The system's specificity is further highlighted by its ability to detect DNA and miRNA point mutations. Notably, the SCas12a system can quantify the miR-21 biomarker in plasma from cervical cancer patients and, when combined with RPA, detect HPV at attomole levels in clinical samples. Together, our work presents a simple and cost-effective SCas12a-based NAT platform for various diagnostic settings.


Conflict of interest statement

Y.L. is a professor of bioscience at Hubei university, and a scientific advisor to BravoVax. The regents of Wuhan Polytechnic University and BravoVax have two patents (application number 2023106008815.7 and 202310602086.4) pending for CRISPR-Cas12a detection technologies on which professor Y.L. and J.Q. are inventors. The remaining authors declare no competing interests.

Figures

Fig. 1
Fig. 1. Schematic illustration of the split Cas12a-based assay for the direct detection of miRNA and DNA.
a Schematic illustration of the wild-type Cas12a RNP. b Schematic illustration of the split Cas12a RNP. c The principle of the amplification-free fluorescence assay developed for the direct detection of miRNA target in this study. d The principle of the fluorescence assay for the direct of DNA target in this study.
Fig. 2
Fig. 2. Comparison of the nuclease activities between the wild-type Cas12a and split Cas12a RNPs.
a Cis-cleavage of the target dsDNA plasmids by wild-type Cas12a RNPs (blue) and split Cas12a RNPs (orange). The reactions contained 50 nM Cas12a, 100 nM crRNA (or 100 nM split RNA), and 10 nM target dsDNA plasmids. b Trans-cleavage of ssDNA probes by wild-type Cas12a RNPs (blue) and split Cas12a RNPs (orange) in the presence of target or non-target dsDNA substrates. The reactions contained 50 nM Cas12a, 100 nM crRNA (or 100 nM split RNA),10 nM complementary dsDNA activators (or 10 nM non-target dsDNA), as well as 20 nM ssDNA probes. c Trans-cleavage of ssDNA probes by wild-type Cas12a RNPs (blue) and split Cas12a RNPs (orange) in the presence of target or non-target ssDNA substrates. The reactions contained 50 nM Cas12a, 100 nM crRNA (or 100 nM split RNA),10 nM complementary ssDNA activators (or 10 nM non-target ssDNA), as well as 20 nM ssDNA probes. For a to c, all the experiments were performed three times.
Fig. 3
Fig. 3. The real-time fluorescence kinetics of the SCas12a assay for dsDNA and ssDNA targets.
a, b Detection of target DNA by SCas12a or wild-type Cas12a. The reaction mixtures were incubated for 60 min at 37 °C and contained 250 nM of Cas12a, 500 nM of crRNA or split RNA, 500 nM of target or non-target DNA (dsDNA for a and ssDNA for b), and 1000 nM of fluorescent probes. All the experiments were conducted in triplicate and error bars represent mean value +/− SD (n = 3). Source data are provided as a Source Data file.
Fig. 4
Fig. 4. Determination of the limit of detection of the SCas12a-based assays for miRNA.
a Limit of detection of the miR-21 target was determined by a fluorescence assay. The plot illustrates the background-subtracted fluorescence intensity at t = 20 min for varying concentrations of the target. All the experiments were conducted in triplicate and error bars represent mean value +/− SD (n = 3), and statistical analysis was conducted using a two-tailed t-test. Statistical significance was determined as follows: ns (not significant) for p > 0.05, * for p ≤ 0.05, ** for p ≤ 0.01, *** for p ≤ 0.001, and **** for p ≤ 0.0001. b Limit of detection of the miR-21 target was determined by a lateral flow assay. Similar experiments were conducted, with the exception that a dipstick reporter was employed following a 20-minute LFA cleavage reaction. The red arrow indicates the test bands, while the green arrow indicates the control bands. The results are denoted by the symbols “+“ for positive outcomes and “−“ for negative outcomes. Source data are provided as a Source Data file.
Fig. 5
Fig. 5. Quantitative detection of RNA by SCas12a assay.
a Selective detection of the target miR-21 (10 pM) in the different types of miRNAs (1 nM), including miR-17, miR-31 and miR-let-7a. b Multiplexed detection of miR-17 and miR-31 in the same reaction. c Heatmap of the estimated concentrations of target miR-21 using the SCas12a assay or conventional RT-qPCR assay. d Schematic of an HIV RNA target and three ssDNA activators targeting it at different positions. The predicted secondary structure of this HIV RNA was determined using NUPACK software. e Comparison among the head, mid, tail and pooled HIV targeting ssDNA activators. f Schematic of the detection of mature miRNA and pre-miRNA using SCas12a or Cas13a based fluorescence assay. g Comparison of fluorescence intensity changes between pre miR-21 and mature miR-21 measured using Cas13a, SCas12a or Asymmetric CRISPR assay. The concentrations of pre-miR-21 and mature miR-21 were both 10 nM in each reaction. For a, b, e, and g, all the experiments were conducted in triplicate and error bars represent mean value +/− SD (n = 3). Source data are provided as a Source Data file.
Fig. 6
Fig. 6. Detection of miRNA biomarker in clinical samples by SCas12a assay.
a Schematic illustration of miRNA detection in human plasma samples using SCas12a assay. b Estimated target miR-21 concentrations in the plasma samples from cervical cancer patients (samples 1–7) and healthy donors (samples 8–10). Error bars indicate the mean value ± standard deviation of three technical replicates. c miR-21 expression level measured by SCas12a assay (red) and RT-qPCR (gray) in cervical cancer patients and healthy donors. The median expression level is represented by the center line, the interquartile range is indicated by the bounds of the box, and the maximum and minimum values are represented by the whiskers. Data are represented as the mean value ± standard deviation of three technical replicates. Source data are provided as a Source Data file.
Fig. 7
Fig. 7. Specificity of the SCas12a assay towards single point mutations in DNA target.
a Split RNA (SCas12a) and crRNA (WT Cas12a) activators were designed with point mutations across the length of the pairing region in a HPV16-derived DNA target. The mutation location is identified by ‘M’ following the nucleotide number where the base has been changed to its complementary deoxynucleotide (3’ to 5’ direction). b Comparison of fluorescence fold changes for the trans-cleavage between wild-type Cas12a assay and the SCas12a assay. All fluorescence values were normalized to those of the WT crRNA activator. Statistical analysis for n = 3 biologically independent replicates comparing the normalized fold change for the WT Cas12a assay vs. SCas12a assay. Statistical analysis was conducted using a two-tailed t-test. Statistical significance was determined as follows: ns (not significant) for p > 0.05, * for p ≤ 0.05, ** for p ≤ 0.01, *** for p ≤ 0.001, and **** for p ≤ 0.0001. Eerror bars represent mean value +/− SD (n = 3). Source data are provided as a Source Data file.
Fig. 8
Fig. 8. Specificity of the SCas12a assay towards single point mutations in miRNA target.
a ssDNA activators were designed with point mutations across the length of the pairing region in a miR-21 target. The mutation location is identified by ‘M’ following the nucleotide number where the base has been changed to its complementary nucleotide (3’ to 5’ direction). b Comparison of fluorescence fold changes for the trans-cleavage between the SCas12a assay and Asymmetric CRISPR assay. All fluorescence values were normalized to those of the WT miR-21 target. Statistical analysis for n = 3 biologically independent replicates comparing the normalized fold change for the SCas12a assay vs Asymmetric CRISPR assay. Statistical analysis was conducted using a two-tailed t-test. Statistical significance was determined as follows: ns (not significant) for p > 0.05, * for p ≤ 0.05, ** for p ≤ 0.01, *** for p ≤ 0.001, and **** for p ≤ 0.0001. error bars represent mean value +/− SD (n = 3). Source data are provided as a Source Data file.
Fig. 9
Fig. 9. Rapid detection of HPV16 using the SCas12a assay.
a Determination of limit of detection of DNA by SCas12a fluorescence assay with or without RPA. Statistical analysis was conducted using a two-tailed t-test. Statistical significance was determined as follows: ns (not significant) for p > 0.05, * for p ≤ 0.05, ** for p ≤ 0.01, *** for p ≤ 0.001, and **** for p ≤ 0.0001. error bars represent mean value +/− SD (n = 3). b Direct detection of DNA by SCas12a-based lateral flow assay. The red arrow indicates the test bands, while the green arrow indicates the control bands. The results are denoted by the symbols “+“ for positive outcomes and “−“ for negative outcomes. c Schematic outlining DNA extraction from human vaginal secretion samples to HPV identification by SCas12a fluorescence assay. The proteinase K was inactivated before the RPA process. d Identification of HPV16 in 25 clinical samples by qPCR (up) and SCas12a fluorescence assay (down). Error bars indicate the mean value ± standard deviation of three technical replicates. e Identification of HPV16 in 25 clinical samples by qPCR (left) and SCas12a assay (right). The heatmap of SCas12a assay represents normalized mean fluorescence values. Source data are provided as a Source Data file.

References

    1. Kubista, M. et al. The real-time polymerase chain reaction. Mol. Aspects. Med.27, 95–125 (2006). - PubMed
    1. Miller, J. R. & Andre, R. Quantitative polymerase chain reaction. Br. J. Hosp. Med.75, C188–C192 (2014). - PubMed
    1. Chen, J. S. et al. CRISPR-Cas12a target binding unleashes indiscriminate single-stranded DNase activity. Science360, 436–439 (2018). - PMC - PubMed
    1. Li, S. Y. et al. CRISPR-Cas12a-assisted nucleic acid detection. Cell. Discov.4, 20 (2018). - PMC - PubMed
    1. Li, L. et al. HOLMESv2: A CRISPR-Cas12b-Assisted Platform for Nucleic Acid Detection and DNA Methylation Quantitation. ACS. Synth. Biol.8, 2228–2237 (2019). - PubMed

Publication types

MeSH terms