. 2024 Sep 27;15(1):8405.
doi: 10.1038/s41467-024-52709-4.

piRNAs are regulators of metabolic reprogramming in stem cells

Affiliations

piRNAs are regulators of metabolic reprogramming in stem cells

Patricia Rojas-Ríos et al. Nat Commun. .

Abstract

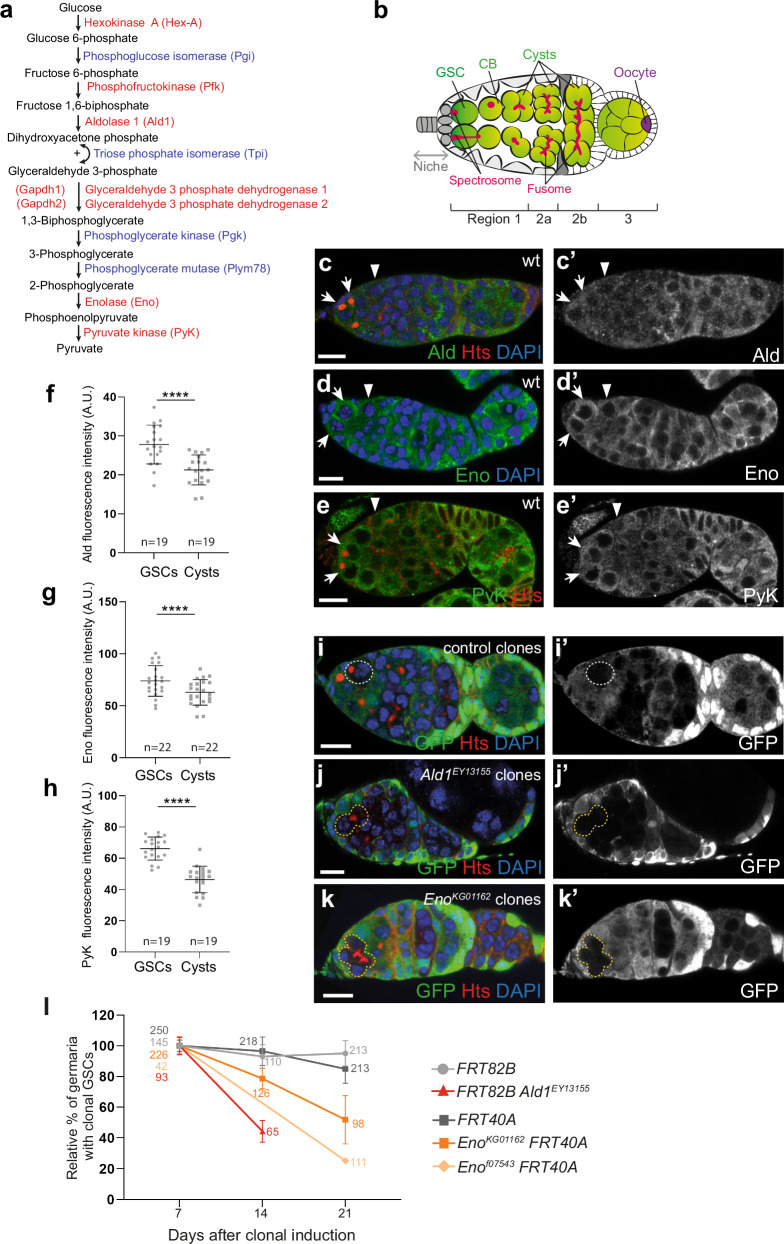
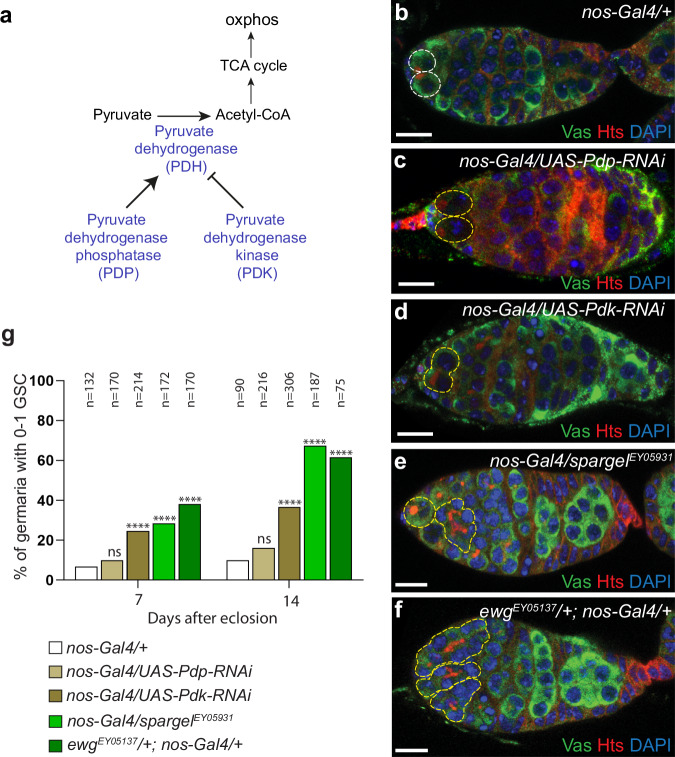
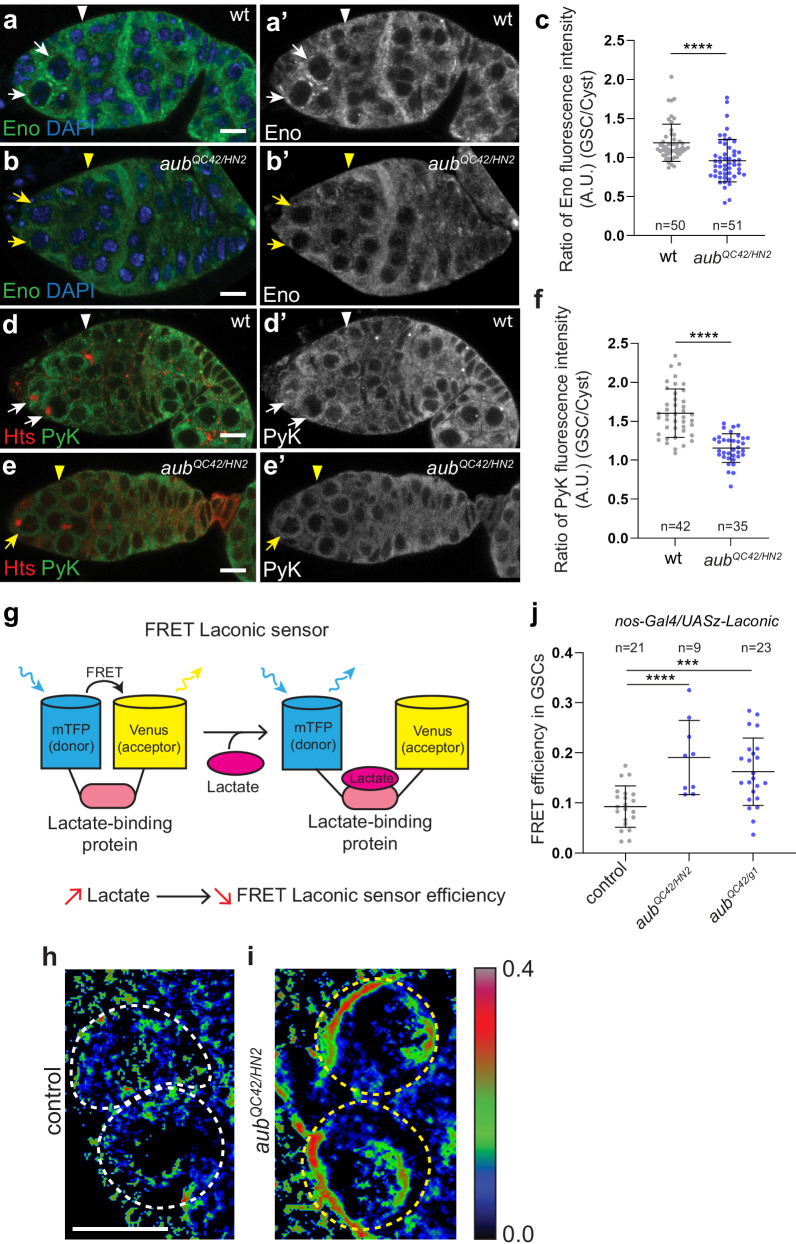
Stem cells preferentially use glycolysis instead of oxidative phosphorylation and this metabolic rewiring plays an instructive role in their fate; however, the underlying molecular mechanisms remain largely unexplored. PIWI-interacting RNAs (piRNAs) and PIWI proteins have essential functions in a range of adult stem cells across species. Here, we show that piRNAs and the PIWI protein Aubergine (Aub) are instrumental in activating glycolysis in Drosophila female germline stem cells (GSCs). Higher glycolysis is required for GSC self-renewal and aub loss-of-function induces a metabolic switch in GSCs leading to their differentiation. Aub directly binds glycolytic mRNAs and Enolase mRNA regulation by Aub depends on its 5'UTR. Furthermore, mutations of a piRNA target site in Enolase 5'UTR lead to GSC loss. These data reveal an Aub/piRNA function in translational activation of glycolytic mRNAs in GSCs, and pinpoint a mechanism of regulation of metabolic reprogramming in stem cells based on small RNAs.


Conflict of interest statement

The authors declare no competing interests.

Figures

Fig. 1
Fig. 1. Glycolytic genes are required for GSC self-renewal.
a The ten steps of glycolysis. Glycolytic mRNAs found in GFP-Aub iCLIP datasets, are in red. Aub binding to glycolytic mRNAs is statistically significant, p = 1.0e-5 using the Generalized hypergeometric test. b Scheme of the germarium. Germ cells are in green, except the oocyte that is in purple (GSC: germline stem cell; CB: cystoblast). The spectrosome and fusome are in red. The spectrosome acquires an elongated form during GSC division. Differentiation proceeds from anterior (left) to posterior (right). Regions 1, 2 and 3 contain mitotically active germ cells, differentiating 16 cell-cysts, and the newly formed egg chamber, respectively. ce’ Confocal images of wild-type (wt) germaria immunostained with an anti-Ald (c, c’), anti-Eno (d, d’) or anti-PyK (e, e’) (green), anti-Hts (red) and DAPI. White arrows indicate GCSs and white arrowheads indicate the region containing germline cysts where glycolytic enzyme levels were quantified. fh Quantification of Ald1 (f), Eno (g) and PyK (h) protein levels in GSCs and differentiating cyst cells using immunostaining experiments shown in ce’. Fluorescence intensity was measured in arbitrary units using the ImageJ software. Horizontal bars represent the mean and standard deviations. ****p-value <0.0001 using the paired two-tailed Student’s t test. p = 1.84e−7 in (f); 5.99e−7 in (g); 8.76e−10 in (h). ik’ Confocal images of mosaic germaria containing control (i, i’), Ald1EY13155 (j, j’) or EnoKG01162 (k, k’) clonal cells stained with anti-GFP (green) (lack of GFP indicates clonal cells), anti-Hts (red) and DAPI (blue), 14 days after clonal induction. The white dashed line (i, i’) indicates a control clonal GSC, and the yellow dashed line (jk’) indicate mutant clonal differentiating cysts in contact with the niche. Heterozygous Ald1EY13155 females in which mitotic clones were induced are not viable after 17 days. l Relative percentages of germaria with at least a clonal GSC at 7, 14 or 21 days after clonal induction. The number of germaria analyzed is indicated. Data are presented as mean values with standard deviations. Quantifications were from two independent experiments, except for Enof07543 for which it was from one experiment. Scale bars: 10 μm. Source data are provided as a Source Data file.
Fig. 2
Fig. 2. Increased mitochondrial activity in germ cells leads to GSC loss.
a Scheme of Pyruvate Dehydrogenase (PDH) complex regulation by Pyruvate Dehydrogenase Phosphatase (PDP) and Pyruvate Dehydrogenase Kinase (PDK). bf Confocal images of germaria from 7 day old-females stained with anti-Vasa (green), anti-Hts (red) and DAPI (blue). The white dashed line indicates two GSCs in a control nos-Gal4/+ germarium (b) and the yellow dashed lines indicate two GSCs in a nos-Gal4/UAS-Pdp-RNAi germarium (c) and a single GSC or differentiating cysts in the niche in nos-Gal4/UAS-Pdk-RNAi (d), nos-Gal4/spargelEY05931 (e) and ewgEY05137/+; nos-Gal4/+ (f) germaria, respectively. g Quantification of germaria showing GSC loss (0-1 GSC) 7 and 14 days after eclosion. The number of scored germaria (n) is indicated. ****p-value <0.0001, ns, non-significant using the χ2 test. 7 days, p = 0.34 between wt and Pdp RNAi; 2.4e−6 between wt and Pdk RNAi; 1.0e−5 between wt and spargelEY05931; 1.0e-5 between wt and ewgEY05137. 14 days, p = 0.16 between wt and Pdp RNAi; 1.0e−6 between wt and Pdk RNAi; 1.0e−5 between wt and spargelEY05931; 1.0e−5 between wt and ewgEY05137. Scale bars: 10 μm. Source data are provided as a Source Data file.
Fig. 3
Fig. 3. Aub increases glycolytic enzyme and lactate levels in GSCs.
ab’, de’ Confocal images of immunostaining of wt and aubQC42/HN2 germaria with anti-Eno (green) and DAPI (blue) (ab’) or anti-PyK (green) and anti-Hts (red) (de’). White and yellow arrows indicate GCSs in wt and aub mutant germaria, respectively. White and yellow arrowheads indicate the region containing germline cysts where glycolytic enzyme levels were quantified, in wt and aub mutant germaria, respectively. c, f Quantification of Eno and PyK protein levels in wt and aubQC42/HN2 mutant GSCs and differentiating cyst cells using immunostaining experiments shown in (ab’, de’). Fluorescence intensity was measured in arbitrary units using the ImageJ software. Ratios of fluorescence intensity of one GSC to one cyst cell per germarium were plotted. Horizontal bars represent the mean and standard deviations. ****p-value < 0.0001 using the unpaired two-tailed Student’s t test. p = 1.93e−5 in (c); 9.36e−11 in (f). g Schematic representation of the FRET Laconic sensor. The binding of lactate to the ligand-binding domain leads to a conformational change that increases the distance between the donor (mTFP) and the acceptor (Venus), resulting in reduced FRET efficiency. Thus, FRET Laconic sensor efficiency inversely correlates with lactate concentration. h, i FRET ratio images in control nos-Gal4/UASz-Laconic (h) and aub mutant, aubQC42/HN2; nos-Gal4/UASz-Laconic (i) anterior-most region of germaria. Control and aub mutant GSCs are indicated with white and yellow dashed lines, respectively. The rainbow colormap indicates the FRET efficiency levels. j Quantification of FRET Laconic sensor efficiency in control and aub mutant, aubQC42/HN2 and aubQC42/g1, GSCs from three day old-females based on acceptor photobleaching. Horizontal bars represent the mean and standard deviations. ***p-value < 0.001, ****p-value < 0.0001, using the unpaired two-tailed Student’s t test. p = 7.14e−5 between control and aubQC42/HN2 and 1.72e−4 between control and aubQC42/g1. Scale bars: 10 μm in (ae’); 5 μm in (h, i). Source data are provided as a Source Data file.
Fig. 4
Fig. 4. The lack of Aub induces a switch in energy metabolism in GSCs.
ab’ Transmission Electron Microscopy images of a wt (a) and an aubQC42/HN2 mutant (b) GSC. The white arrow in wt and yellow arrow in aub mutant GSCs point to mitochondria that are shown enlarged in (a’) and (b’). c Measurement of mitochondrial length in wt and aubQC42/HN2 mutant GSCs from the Transmission Electron micrographs. Percentages of mitochondria with a length above or below 0.25 μm are shown. The number of mitochondria (n) from at least ten GSCs per condition is indicated. *p-value <0.05 using the χ2 test. p = 0.025. d Quantification of mitochondria with and without cristae in wt and aubQC42/HN2 mutant GSCs from the Transmission Electron micrographs. Percentages of mitochondria with and without cristae are shown. The number of mitochondria (n) from at least ten GSCs per condition is indicated. ****p-value <0.0001 using the χ2 test. p = 1.0e−5. e, e’ Confocal images of a mosaic germarium containing an aubHN2 mutant clonal GSC stained with anti-GFP (green), anti-ATPsynα (red) and DAPI (blue). The non-clonal (GFP+) and aub mutant clonal (GFP-) GSCs are indicated by dashed white and yellow lines, respectively. f Quantification of ATPsynα protein levels in control non-clonal aubHN2/+ and clonal aubHN2 mutant GSCs using fluorescence intensity measured in arbitrary units using the ImageJ software. Horizontal bars represent the mean and standard deviations. *p-value < 0.05 using the paired two-tailed Student’s t test. p = 0.026. g, h Quantification of mitochondrial membrane potential: ratiometric images of wt and aubQC42/HN2 mutant germaria stained with TMRM to record mitochondrial membrane potential and Deep Red MitoTracker to record mitochondrial mass. The ratio of TMRM to MitoTracker intensity was calculated using ImageJ and a pseudo-colored image was generated using the rainbow RGB gradient. White and yellow arrows indicate wt and aub mutant GSCs, respectively. i Quantification of TMRM/MitoTracker ratios in wt and aubQC42/HN2 mutant GSCs using ImageJ. Horizontal bars represent the mean and standard deviations. **p-value < 0.01 using the two-tailed Mann–Whitney test. p = 0.0019. Scale bars: 1 μm in (a, b); 10 μm in (e, g, h). Source data are provided as a Source Data file. Panel (a’) and (b’) were created with BioRender.com released under a Creative Commons Attribution-NonCommercial-NoDerivs 4.0 International license (https://creativecommons.org/licenses/by-nc-nd/4.0/deed.en).
Fig. 5
Fig. 5. Aub binds to and activates glycolytic mRNAs.
a, b Confocal images of immunostaining of germaria expressing GFP-Aub (nos-Gal4/UASp-GFP-Aub) or GFP fused to AubAA that does not load piRNAs (UASp-GFP-AubAA/+; nos-Gal4/+) with anti-GFP (green), anti-Hts (red) and DAPI (blue). GFP-Aub is present in the nuage around nuclei, whereas GFP-AubAA is not. c Western blot showing immunoprecipitation (IP) of GFP-Aub and GFP-AubAA with anti-GFP in ovaries. Genotypes were as in (a, b). w1118 ovaries were used as negative control. Input corresponds to 1/8 of extract prior to immunoprecipitation. The blot was revealed with anti-GFP. Experiments in (ac) were repeated twice with similar results. d, e Quantification of mRNAs using RT-qPCR in GFP-Aub (d, e) and GFP-AubAA (e) IPs. mRNA enrichment compared to mRNA levels in w1118 IPs set to 1 (horizontal bars). mRNA levels were normalized to U1 snRNA and to RNA levels in the input. nanos (nos) mRNA was used as positive control. Mean of two biological replicates for Hex-A and Pfk mRNAs and three biological replicates for the other mRNAs in (d). Error bars represent standard deviation. One biological replicate in (e). fi Genetic interaction between aub and either Ald1 or Eno for GSC self-renewal. Confocal images of immunostaining of aubHN2/+ (f), aubHN2/+; Def(Ald1)/+ (g) and aubHN2/EnoKG01162 (h) germaria with anti-Vasa (green), anti-Hts (red) and DAPI (blue). The white dashed line indicates two GSCs in a control aubHN2/+ germarium (f) and the yellow dashed lines indicate differentiating cysts in the niche in aubHN2/+; Def(Ald1)/+ (h) and aubHN2/EnoKG01162 (g) germaria. i Quantification of germaria showing GSC loss (0-1 GSC) in heterozygous and double heterozygous mutant females of the indicated genotypes, 7 days after eclosion. The number of scored germaria (n) is indicated. * p-value < 0.05, ** p-value < 0.01, ns, non-significant using the χ2 test, compared to the sum of GSC loss from the two corresponding single heterozygous. p = 0.0084 for aubHN2/+; Df(Ald1)/+; 0.021 for aubQC42/+; Df(Ald1)/+; 0.58 aubg1/+; Df(Ald1)/+; 0.31 for aubHN2/EnoKG01162; 0.0015 for aubQC42/EnoKG01162; 0.0067 for aubg1/EnoKG01162. Scale bars: 10 μm. Source data are provided as a Source Data file.
Fig. 6
Fig. 6. Aub-dependent activation of glycolytic mRNAs in GSCs depends on their targeting by piRNAs.
a Scheme of the Eno gene; thick boxes: coding sequences; thin boxes: UTRs; lines: introns. GFP-Aub iCLIPs in cultured GSCs from three replicates are shown in red. The arrowheads at the 5′ ends indicate mRNA isoforms expressed in GSCs. Open arrowhead: low expression (>10 and <100 Transcripts Per Million (TPM): 10 to 30 TPM for this transcript); green arrowhead: high expression (>100 TPM: 150 to 240 TPM for this transcript). The Eno sequence overlapping GFP-Aub iCLIPs in the 5′UTR and intron is shown. Nucleotides (nt) in red are bound by Aub in the iCLIP datasets. The sequence and occurrences of GSC Quasimodo piRNAs potentially targeting Eno are indicated. Nt in blue are non-complementary to the Eno sequence. The sequences of EnoΔpi11, EnoΔpi12, and Enopimut1 are shown. Dashes and stars indicate deleted and modified nt, respectively. A part of the protein sequence of Eno long isoform is shown; the modified nt do not change the coding sequence. Boxed nt indicate the donor and new donor splice sites. b–e Confocal images of immunostaining of wt (b), EnoΔpi11 (c), EnoΔpi12 (d) and Enopimut1 (e) germaria with anti-Vasa (green), anti-Hts (red) and DAPI (blue). The white and yellow dashed lines indicate GSCs in wt (b) and mutant (c-e) germaria, respectively. f, g Quantification of germaria showing GSC loss (0–1 GSC) in wt and mutant females, 14 and 21 days after eclosion. The number of scored germaria (n) is indicated. *p-value < 0.05, **p-value <0.01, ***p-value <0.001, ****p-value <0.0001 using the χ2 test. In (f), 14 days, p = 2.0e−4 between wt and EnoΔpi11; 1.0e−4 between wt and EnoΔpi11/f07543; 0.0012 between wt and EnoΔpi12; 0.0017 between wt and EnoΔpi12/f07543. 21 days, p = 8.52e−5 between wt and EnoΔpi11; 6.99e−5 between wt and EnoΔpi11/f07543; 6.0e−4 between wt and EnoΔpi12; 0.0088 between wt and EnoΔpi12/f07543. In (g), 14 days, p = 0.0021 between wt and Enopimut1; 0.015 between wt and Enopimut1/f07543. 21 days, p = 0.004 between wt and Enopimut1; 0.047 between wt and Enopimut1/f07543. Scale bars: 10 μm. Source data are provided as a Source Data file.
Fig. 7
Fig. 7. Expression of reporter transgenes with Eno 5′UTRs depends on Aub.
a Schemes of Eno reporter transgenes; open boxes: nos promoter; orange boxes: Eno UTRs; green boxes: GFP coding sequence; blue box: SV40 3′UTR. be Confocal images of immunostaining of germaria expressing Eno reporter transgenes nosP-5Eno-GFP-3Eno (b, c) and nosP-5Eno-GFP-3SV40 (d, e), in wt (b, d) and aubQC42/g1 mutant context (c, e) with anti-GFP. White and yellow arrows point to GSCs in wt and mutant germaria, respectively. White and yellow arrowheads indicate the region containing germline cysts, where GFP was quantified in wt and mutant germaria, respectively. f, g Quantification of GFP levels in wt and aubQC42/g1 mutant GSCs and differentiating cyst cells using immunostaining experiments shown in (be). Fluorescence intensity was measured in arbitrary units using the ImageJ software. Ratios of fluorescence intensity of one GSC to one cyst cell per germarium were plotted. Horizontal bars represent the mean and standard deviations. ****p-value < 0.0001 using the unpaired two-tailed Student’s t test with Welch’s correction (p = 2.36e−5) in (f) and the two-tailed Mann–Whitney test (p = 2.34e−8) in (g). Scale bars: 10 μm. Source data are provided as a Source Data file.
Fig. 8
Fig. 8. Activation of glycolysis contributes to Aub function in GSC self-renewal.
ac Confocal images of immunostaining of aubQC42/HN2; nos-Gal4/+ (a, b) and aubQC42/HN2PfkEY23126/+; nos-Gal4/+ (c) germaria with anti-Vasa (green), anti-Hts (red) and DAPI (blue). The yellow dashed lines indicate the GSCs. An empty germarium, devoid of germ cells is shown in (b). d Quantification of germaria showing GSC loss (0–1 GSC) in mutant females of the indicated genotypes, 7 and 14 days after eclosion, and of empty germaria in mutant females 14 days after eclosion. The number of scored germaria (n) is indicated. **p-value < 0.01, ****p-value < 0.0001, ns, non-significant using the χ2 test. For GSC loss at 7 days, p = 1.0e−6 between aubQC42/HN2; nos-Gal4/+ and aubQC42/HN2 PfkEY23126/+; nos-Gal4/+; 0.0019 between aubQC42/g1; nos-Gal4/+ and aubQC42/g1 PfkEY23126/+; nos-Gal4/+. For GSC loss at 14 days, p = 6.56e−5 between aubQC42/HN2; nos-Gal4/+ and aubQC42/HN2 PfkEY23126/+; nos-Gal4/+; 0.08 between aubQC42/g1; nos-Gal4/+ and aubQC42/g1 PfkEY23126/+; nos-Gal4/+. For empty gemaria, p = 8.72e−6 between aubQC42/HN2; nos-Gal4/+ and aubQC42/HN2 PfkEY23126/+; nos-Gal4/+; 1.37e-8 between aubQC42/g1; nos-Gal4/+ and aubQC42/g1 PfkEY23126/+; nos-Gal4/+. e Model of Aub and piRNA function in metabolic remodeling in GSCs. Aub guided by piRNAs binds glycolytic mRNAs in GSCs leading to their translational activation and higher levels of glycolytic enzymes. Translational activation might involve Aub interaction with the translation initiation factors PABP and eIF3 as is the case in the embryo. Aub-dependent activation of glycolytic mRNAs leads to high glycolysis in GSCs that is required for their self-renewal. During cyst cell differentiation, mitochondrial maturation takes place leading to an increased number of fused mitochondria equipped with cristae. This allows a gradual metabolic rewiring towards oxphos during the process of germ cell differentiation. Other factors (question mark) are expected to cooperate with Aub to restrict translational activation to GSCs. Scale bars: 10 μm. Source data are provided as a Source Data file. Panel e was created with BioRender.com released under a Creative Commons Attribution-NonCommercial-NoDerivs 4.0 International license (https://creativecommons.org/licenses/by-nc-nd/4.0/deed.en).

References

    1. Folmes, C. D. et al. Somatic oxidative bioenergetics transitions into pluripotency-dependent glycolysis to facilitate nuclear reprogramming. Cell Metab.14, 264–271 (2011). - PMC - PubMed
    1. Zhu, S. et al. Reprogramming of human primary somatic cells by OCT4 and chemical compounds. Cell Stem Cell7, 651–655 (2010). - PMC - PubMed
    1. Prigione, A., Fauler, B., Lurz, R., Lehrach, H. & Adjaye, J. The senescence-related mitochondrial/oxidative stress pathway is repressed in human induced pluripotent stem cells. Stem Cells28, 721–733 (2010). - PubMed
    1. Yanes, O. et al. Metabolic oxidation regulates embryonic stem cell differentiation. Nat. Chem. Biol.6, 411–417 (2010). - PMC - PubMed
    1. Chen, C. T., Shih, Y. R., Kuo, T. K., Lee, O. K. & Wei, Y. H. Coordinated changes of mitochondrial biogenesis and antioxidant enzymes during osteogenic differentiation of human mesenchymal stem cells. Stem Cells26, 960–968 (2008). - PubMed

Publication types

MeSH terms

Associated data

LinkOut - more resources