. 2024 Sep 27;15(1):8341.
doi: 10.1038/s41467-024-52735-2.

Loss of embryonically-derived Kupffer cells during hypercholesterolemia accelerates atherosclerosis development

Affiliations

Loss of embryonically-derived Kupffer cells during hypercholesterolemia accelerates atherosclerosis development

Rebecca Fima et al. Nat Commun. .

Abstract

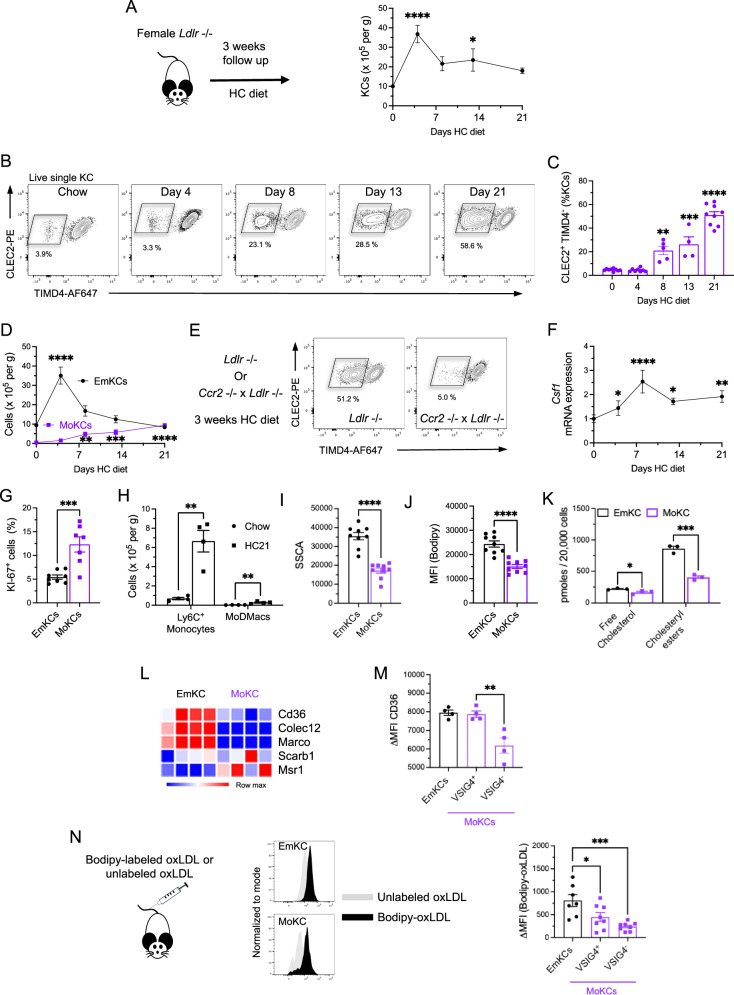
Hypercholesterolemia is a major risk factor for atherosclerosis and associated cardiovascular diseases. The liver plays a key role in the regulation of plasma cholesterol levels and hosts a large population of tissue-resident macrophages known as Kupffer cells (KCs). KCs are located in the hepatic sinusoids where they ensure key functions including blood immune surveillance. However, how KCs homeostasis is affected by the build-up of cholesterol-rich lipoproteins that occurs in the circulation during hypercholesterolemia remains unknown. Here, we show that embryo-derived KCs (EmKCs) accumulate large amounts of lipoprotein-derived cholesterol, in part through the scavenger receptor CD36, and massively expand early after the induction of hypercholesterolemia. After this rapid adaptive response, EmKCs exhibit mitochondrial oxidative stress and their numbers gradually diminish while monocyte-derived KCs (MoKCs) with reduced cholesterol-loading capacities seed the KC pool. Decreased proportion of EmKCs in the KC pool enhances liver cholesterol content and exacerbates hypercholesterolemia, leading to accelerated atherosclerotic plaque development. Together, our data reveal that KC homeostasis is perturbed during hypercholesterolemia, which in turn alters the control of plasma cholesterol levels and increases atherosclerosis.


Conflict of interest statement

The authors declare no competing interests.

Figures

Fig. 1
Fig. 1. Kupffer cell pool rapidly expands in response to induction of hypercholesterolemia.
A Plasma total cholesterol in Ldlr−/− male mice fed a chow diet (n = 8 mice) or chow diet supplemented with 1% cholesterol (HC) (n = 7 mice) for 4 days (2 independent experiments combined; ****p < 0.0001). B tSNE projections of identified leukocytes by flow cytometry in livers of chow-fed or HC-fed Ldlr−/− mice for 4 days. High expression of VSIG4 identifies KCs. C Volcano plot depicting differentially expressed genes (fold change ≥ 1.3 and adjusted p-value ≥ 0.05 in red) in sorted KCs from livers of chow-fed or HC-fed Ldlr−/− mice for 4 days. D Pathways enriched in KCs in response to hypercholesterolemia. E Flow cytometry analysis of KCs and histograms showing the expression of KC markers CLEC4F, VSIG4 and TIMD4. F KC density in livers of chow- (n = 8 mice) and HC-fed (n = 8 mice) Ldlr−/− male mice for 4 days (2 independent experiments combined; ****p < 0.0001). G Representative microscopy images of livers of chow- and HC-fed (4 days) Ldlr−/− male mice showing expression of CLEC4F (red) and E-CADHERIN (green). Nuclei (DAPI) are shown in blue. Scale bar = 100 μm. Quantification of CLEC4F+ and DAPI+ cells density in HC-fed (4 days, n = 3) and chow-fed (n = 8) Ldlr−/− mice (****p < 0.0001). H Percentage of KI-67+ cells among CLEC2+ KCs of chow (n = 10) or HC-fed (n = 8) Ldlr−/− male mice (2 independent experiments combined; ****p < 0.0001). I Fold-change in Csf1 gene expression in livers of Ldlr−/− male mice fed HC diet for the indicated days (n = 12, 3, 7, 6 and 10 mice for day 0, 1, 2, 3 and 4, respectively). Data are expressed relative to day 0 and p values correspond to statistical differences versus day 0 (1-way ANOVA and Dunnett’s multiple comparison test; 0 vs 3 days: *p = 0.04 and 0 vs 4 days: ****p < 0.0001). J RT-qPCR measurement of Csf1 mRNA expression in sorted HSC and LSEC cells of mice fed HC (n = 3) or chow diet (n = 3). Statistical significance assessed with 2-way ANOVA (chow HSCs vs HC HSCs: p = 0.057). K Quantification of DESMIN+ and DAPI+ cells in HC-fed (4 days, n = 3) and chow-fed (n = 3) Ldlr−/− mice (**p = 0.009). L Percentage of KI-67+ KCs and KC numbers in Ldlr−/− female mice fed a chow or HC diet for 3 days and treated with PLX3397 (CSF1R inhibitor) or vehicle. Statistical significance tested with 1-way ANOVA and Tukey multiple comparison test (n = 10, 8 and 9 mice for chow, HC and HC + PLX respectively; Combined 2 independent experiments; For KI-67+ KCs, chow vs HC and HC vs HC + PLX: ****p < 0.0001 and for KC numbers, chow vs HC: **p = 0.009 and HC vs HC + PLX: *p = 0.02). All data in this figure are presented as mean values ± SEM. Statistical significance has been assessed with a two-sided t-test unless otherwise stated on the corresponding panel legend. Source data are provided as a Source Data File.
Fig. 2
Fig. 2. Hypercholesterolemia generates cholesterol-loaded foamy KCs.
A Gene Set Enrichment analysis (GSEA) of the reactome_cholesterol_biosynthesis and foamy plaque macrophages gene signatures in KC from chow- and HC-fed (4 days) Ldlr−/− mice using the Phantasus software. The foamy plaque macrophages gene signature was generated from a previously published dataset (GSE116239). B KCs in HC-fed mice exhibit high granularity (SSC-Ahi) and (C) strongly stain for lipids (bodipy; n = 8 chow and n = 7 HC; combined 2 independent experiments; ****p < 0.0001). D Changes in cholesterol content (*p = 0.0115), in cholesteryl-esters (*p = 0.0115) and various CE species in KCs sorted from chow- and HC-fed (4 days) Ldlr−/− mice (n = 3 chow and n = 4 HC; 1 experiment). E Two-photon laser scanning microscopy images of the liver of chow and HC-fed (4 days) Ldlr−/− mice. Numerous lipid droplets (white spots) are detected by Coherent anti-Stokes Raman Spectroscopy (CARS) in TIMD4+ KCs (red; 3D reconstruction by mask rendering on the right images) and in the hepatocytes (autofluorescence in green) of HC-fed mice as compared to the chow condition. Scale bar = 10 μm. F Calculated amount of total cholesterol (**p = 0.006) and of free cholesterol (FC) and cholesteryl-esters (CE) (****p < 0.0001) present in the liver of chow- (n = 6 mice) and HC-fed (4 days; n = 8 mice; 1 experiment) Ldlr−/− mice. G Calculated amount of total cholesterol (****p < 0.0001) and of FC (**p = 0.003) and CE (**p = 0.003) present in the KC pool of chow- (n = 3 mice) and HC-fed (4 days; n = 5 mice; 1 experiment) Ldlr−/− mice. H Heatmap generated from the RNA-Seq depicting the level of expression of scavenger receptors in KCs from chow- and HC-fed (4 days) Ldlr−/− mice. I Changes in the granularity (SSC-A; ***p = 0.0002) and lipid content (bodipy; **p = 0.005) of KCs in mice fed HC diet overnight and injected in vivo either with anti-CD36 blocking antibodies (n = 8) or isotype control antibodies (n = 9) (2 independent experiments combined). All data in this figure are presented as mean values ± SEM. Statistical significance has been assessed with a two-sided t-test unless otherwise stated on the corresponding panel legend. Source data are provided as a Source Data File.
Fig. 3
Fig. 3. Hypercholesterolemia is the only trigger for KCs proliferation, pool expansion and foamy phenotype.
A Experimental plan for ezetimibe treatment to block intestinal cholesterol absorption. B Feeding ezetimibe to Ldlr−/− male mice fed HC diet blocked plasma cholesterol elevation (chow vs HC and HC vs HC + Eze: ****p < 0.0001), resulting in (C) no increased proliferation (as determined by KI-67 staining; chow vs HC: ***p = 0.0002 and HC vs HC + Eze: **p = 0.004) (D), no increased pool density (chow vs HC: ***p = 0.0008 and HC vs HC + Eze: **p = 0.002), and (E) no lipid loading (bodipy; chow vs HC and HC vs HC + Eze: ****p < 0.0001) of KCs. (n = 4, 4 and 3 for chow-, HC- and HC + eze-fed mice, respectively). All data in this figure are from one experiment and presented as mean values ± SEM. Statistical significance tested with 1-way ANOVA and Tukey multiple comparison test. Source data are provided as a Source Data File.
Fig. 4
Fig. 4. Long term exposure to hypercholesterolemia generates monocyte-derived KCs with reduced lipid-loading capacity.
A KC numbers before and 4, 8, 13 and 21 days after induction of hypercholesterolemia (0 vs 4 days: ****p < 0.0001 and 0 vs 13 days: *p = 0.04). B Representative flow cytometry of CLEC2 + TIMD4- KCs during prolonged exposure of the mice to hypercholesterolemia. C Frequency of CLEC2 + TIMD4- KCs (0 vs 8 days: **p = 0.0015, 0 vs 13 days: ***p = 0.0001 and 0 vs 21 days: ****p < 0.0001). D EmKCs and MoKCs numbers before and at 4, 8, 13 and 21 days after induction of hypercholesterolemia (Panels A, C and D: n = 9, 8, 5, 4 and 8 mice for experimental points 0, 4, 8,13, and 21 days; 2 independent experiments combined) (1-way ANOVA and multiple comparison test; EmKCs: 0 vs 4 days: ****p < 0.0001; MoKCs: 0 vs 8 days: **p = 0.0013, 0 vs 13 days: ***p = 0.0002 and 0 vs 21 days: ****p < 0.0001). E Representative FACS plots showing TIMD4- cells among CLEC2 + KCs in Ldlr−/− and Ccr2−/− x Ldlr−/− female mice subjected to hypercholesterolemia for 3 weeks. F Fold-change in Csf1 expression (normalized to day 0) in livers of Ldlr−/− mice fed HC diet (n = 5, 4, 4, 4 and 4 mice for day 0, 4, 7, 13 and 21, respectively; 1-way ANOVA and multiple comparison test; 0 vs 4 days: *p = 0.026, 0 vs 8 days: ****p < 0.0001, 0 vs 13 days: *p = 0.043 and 0 vs 21 days: **p = 0.007). G Percentage of KI-67+ cells among EmKCs and MoKCs in HC-fed female Ldlr−/− mice for 3 weeks (***p = 0.0007). H Ly6C+ monocytes and MoDMacs in livers of Ldlr−/− mice fed chow (n = 4) or HC diet (n = 4) for 21 days. (Holm-Sidak multiple comparison test; Chow vs HC: Monocytes **p = 0.002 and MoDMacs **p = 0.006). I Granularity (****p < 0.0001) and (J) lipid content (****p < 0.0001) of EmKCs and MoKCs of mice (n = 9) fed HC diet for 3 weeks. K Lipidomic analysis of sorted EmKCs and MoKCs of mice fed HC diet for 3 weeks (n = 3 mice; Chow vs HC, FC: *p = 0.04 and CE: ***p < 0.001). L Heatmap of scavenger receptors mRNA expression in sorted EmKCs and MoKCs from Ldlr−/− mice after 3 weeks of HC diet (n = 4 mice). M CD36 expression (ΔMFI = CD36 MFI minus MFI of non-stained cells) on EmKCs and on VSIG4 and VSIG4+ MoKCs at 3 weeks of HC diet (n = 4 mice) showing lower expression on VSIG4 MoKCs (**p = 0.009). N FITC MFI (bodipy) for EmKCs and for VSIG4- and VSIG4+ MoKCs after injection of oxidized-LDL labeled with bodipy or not (1-way ANOVA; 2 independent experiments combined; EmKCs vs VSIG4+ MoKCs: *p = 0.031 and EmKCs vs VSIG4 MoKCs: ***p = 0.0008). All data in this figure are presented as mean values ± SEM. Statistical significance has been assessed with a two-sided t-test (or multiple t-tests) unless otherwise stated on the corresponding panel legend. Source data are provided as a Source Data File.
Fig. 5
Fig. 5. Protection of EmKCs from mitochondrial apoptosis limits MoKCs generation during hypercholesterolemia.
A Generation of mitochondrial ROS determined by mitosox staining in EmKCs of Ldlr−/− female mice fed chow (n = 5) or HC diet for 4 (n = 4) or 21 days (n = 4). Statistical significance tested with 1-way ANOVA and Tukey multiple comparison test (Chow vs HC4: *p = 0.025, Chow vs HC21: ****p < 0.0001 and HC4 vs HC21: ****p < 0.0001). B Comparative mitosox staining between EmKCs and MoKCs of Ldlr−/− female mice fed HC diet 21 days (n = 4 mice, **p = 0.0012). C Experimental strategy to track the fate of monocytes in hypercholesterolemic chimeric mice with apoptosis-resistant EmKCs. D Representative flow cytometry analysis showing the contribution of monocyte-derived (GFP+) cells to EmKCs and MoKCs. E Frequency of MoKCs (***p = 0.0009) and (F) absolute numbers of GFP+ MoKCs (*p = 0.018) in female Ccr2−/− (n = 6 mice) and Cd68-hBcl2 x Ccr2−/− (n = 6 mice) chimeras fed the HC diet for 3 weeks (2 independent experiments combined). All data in this figure are presented as mean values ± SEM. Statistical significance has been assessed with a two-sided t-test unless otherwise stated on the corresponding panel legend. Source data are provided as a Source Data File.
Fig. 6
Fig. 6. Loss of EmKCs increases hypercholesterolemia and favors atherosclerosis development.
A Experimental strategy used to deplete EmKCs in the context of hypercholesterolemia (n = 7 mice for bDT and n = 6 mice for DT). B Total KC and (C) EmKCs (****p < 0.0001) and MoKCs (***p = 0.0002) numbers in livers of Cd207-DTR × Ldlr−/− male mice after 8 days of HC diet and injected either with bDT or DT. D Percentage of MoKCs (****p < 0.0001), E bodipy staining of EmKCs (*p = 0.049) and MoKCs (*p = 0.034), F numbers for liver monocytes and neutrophils, and (G) plasma cholesterol concentrations after 8 days HC diet feeding (1 independent experiment; **p = 0.0033). H Hepatic production of VLDLs in Cd207-DTR × Ldlr−/− mice 8 days post-injection of DT (n = 5) or bDT (n = 5) and HC diet feeding (2 independent experiments combined). Plasma triglycerides (TG) were measured overtime after p407 injection (intravascular lipolysis inhibition). I Experimental strategy. J Total KC (*p = 0.044) and (K) EmKCs (**p = 0.0027) and MoKCs numbers in livers of Cd207-DTR × Ldlr−/− female mice after 4 weeks of HC diet and injected either with bDT (n = 9) or DT (n = 9) (2 independent experiments combined). L Percentage of MoKCs (****p < 0.0001) and (M) plasma cholesterol concentrations (***p = 0.0009) after 4 weeks HC diet feeding. N The list of significantly downregulated genes (RNA-Seq) in livers of DT-treated mice as compared to bDT-treated controls was submitted to Enrichr for transcription factor enrichment analysis (ChEA_2022). O Heat map showing fold-changes in cholesterol biosynthesis intermediates in livers of DT-treated mice (n = 9) as compared to bDT-treated animals (n = 9). Differences in cholesterol (*p = 0.048) and cholesteryl-esters liver (*** < 0.001) concentrations between the two-groups are shown. P Liver content in primary (I) and secondary (II) bile acids. Fold-change for specific I and II bile acids species in livers of DT-treated mice (n = 5) as compared to bDT-treated (n = 5) animals provided as a heat map. Q Hepatic damage (ALT) in Cd207-DTR × Ldlr−/− female mice injected with bDT (n = 10) or DT (n = 11) (2 independent experiments combined) after 4 weeks of HC diet feeding. R Bile acids (I BA: *p = 0.043 and II BA: *p = 0.032) and (S) cholesterol contents in feces for both groups (n = 6 in each group) were also determined. T Representative images of atherosclerosis in the aortic root of Cd207-DTR × Ldlr−/− mice after 4 weeks of HC diet and injected either with bDT or DT. Lipid lesions were quantified by ORO staining in female (n = 6 in each group; 2 independent experiments combined; **p = 0.008) and male mice (DT, n = 9 and bDT, n = 11; 4 independent experiments combined; *p = 0.013). U Plasma cholesterol (*p = 0.05) and arterial lipid lesions (*p = 0.05) of Cd207-DTR × Ldlr−/− female mice after 2 months of HC diet and injected either with bDT (n = 7) or DT (n = 7) (2 independent experiments combined). All data in this figure are presented as mean values ± SEM. Statistical significance has been assessed with a two-sided t-test (or multiple comparison t-tests). Source data are provided as a Source Data File.

References

    1. Ference, B. A. et al. Low-density lipoproteins cause atherosclerotic cardiovascular disease. 1. Evidence from genetic, epidemiologic, and clinical studies. A consensus statement from the European Atherosclerosis Society Consensus Panel. Eur. Heart J.38, 2459–2472 (2017). - PMC - PubMed
    1. Que, X. et al. Oxidized phospholipids are proinflammatory and proatherogenic in hypercholesterolaemic mice. Nature558, 301–306 (2018). - PMC - PubMed
    1. Shearn, A. I. U. et al. Bcl-x inactivation in macrophages accelerates progression of advanced atherosclerotic lesions in Apoe(−/−) mice. Arterioscler. Thromb. Vasc. Biol.32, 1142–1149 (2012). - PubMed
    1. Demetz, E. et al. The haemochromatosis gene Hfe and Kupffer cells control LDL cholesterol homeostasis and impact on atherosclerosis development. Eur. Heart J.41, 3949–3959 (2020). - PubMed
    1. Bouchareychas, L. et al. Promoting macrophage survival delays progression of pre-existing atherosclerotic lesions through macrophage-derived apoE. Cardiovasc. Res.108, 111–123 (2015). - PubMed

Publication types

MeSH terms

LinkOut - more resources