. 2024 Sep 27;15(1):8273.
doi: 10.1038/s41467-024-52621-x.

Lipid droplets sequester palmitic acid to disrupt endothelial ciliation and exacerbate atherosclerosis in male mice

Affiliations

Lipid droplets sequester palmitic acid to disrupt endothelial ciliation and exacerbate atherosclerosis in male mice

Yanjie Tan et al. Nat Commun. .

Abstract

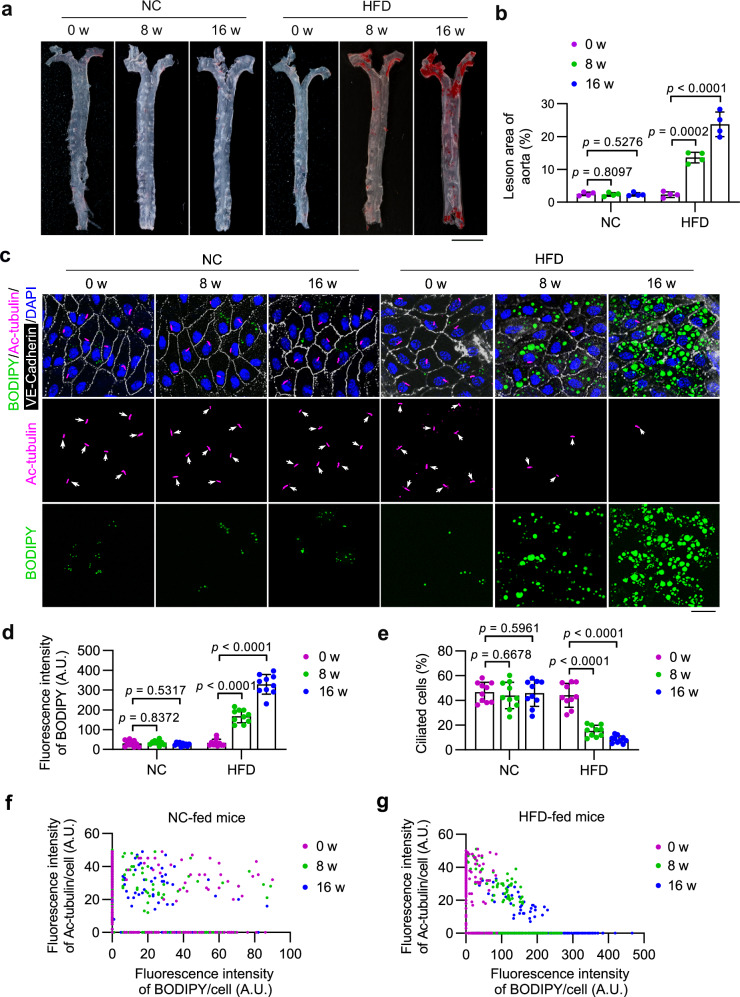
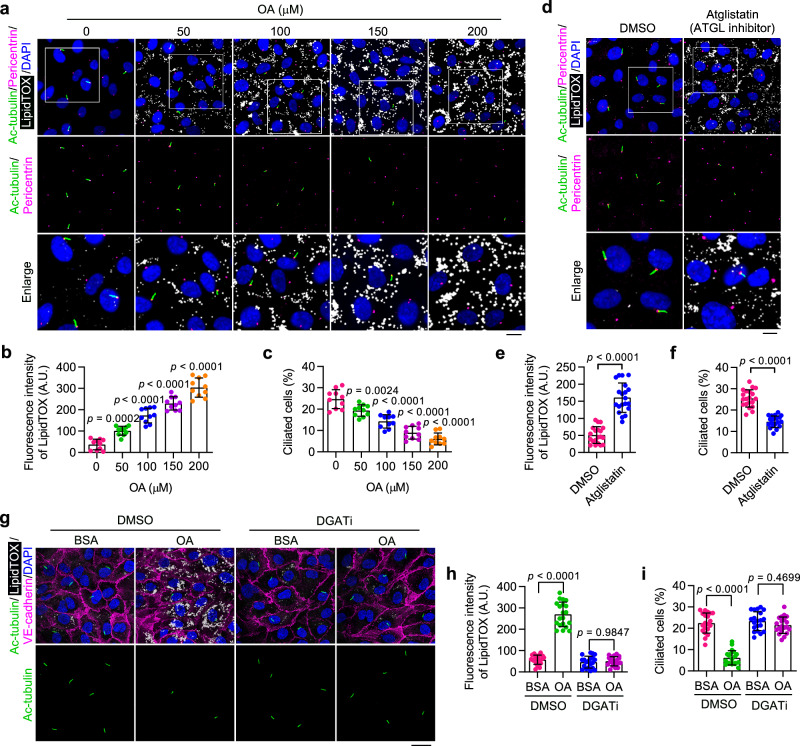
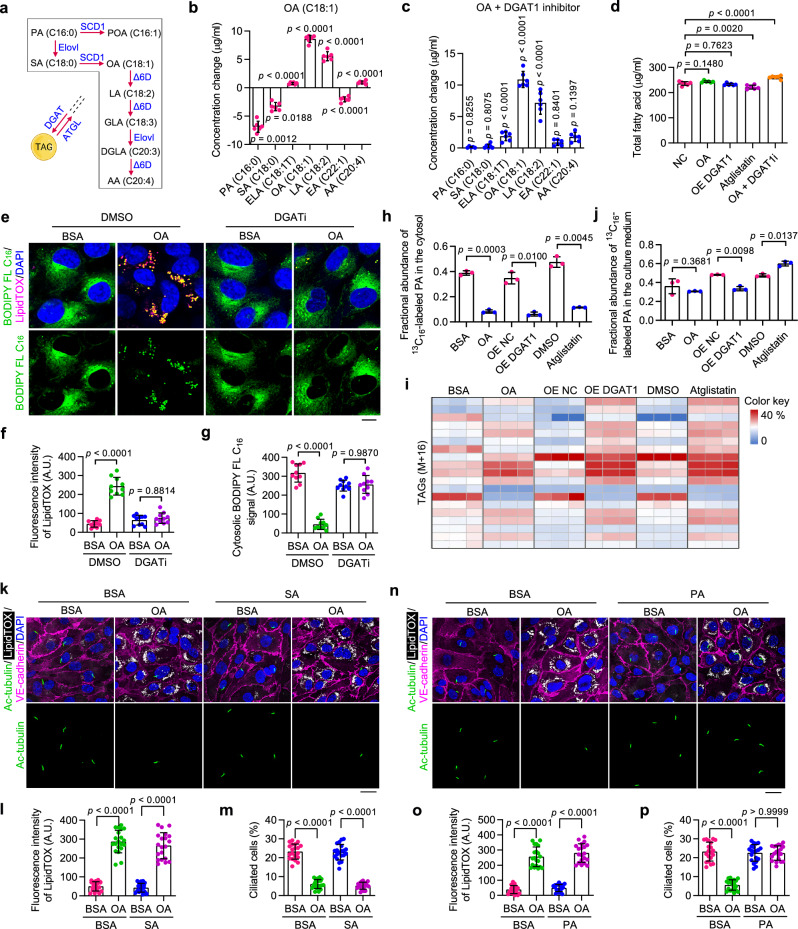
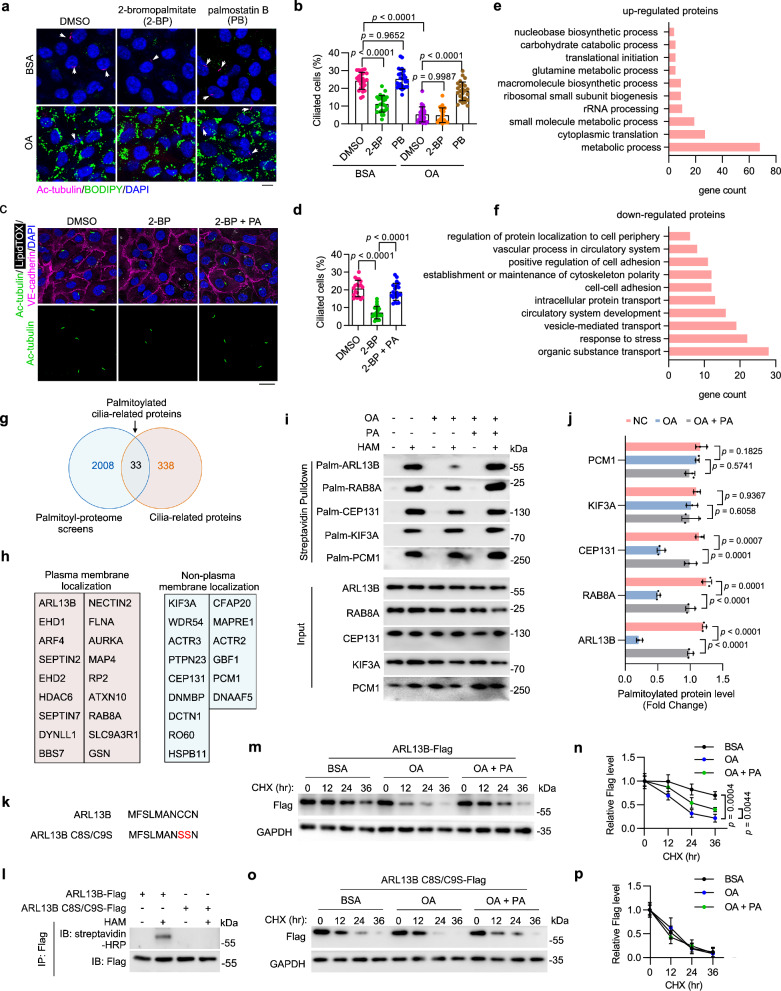
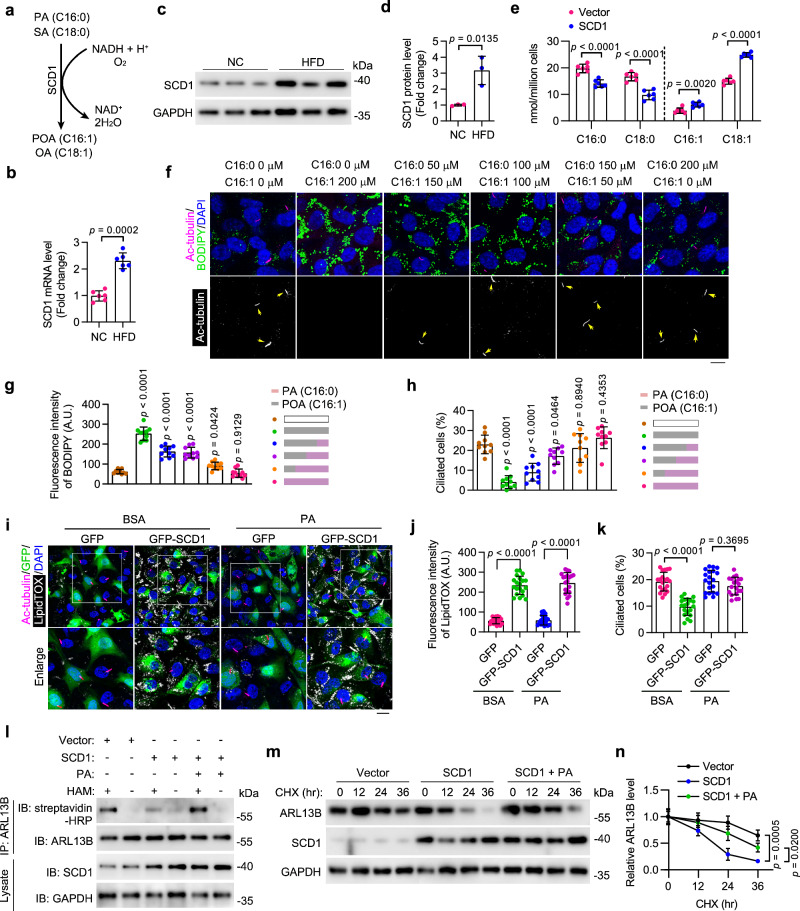
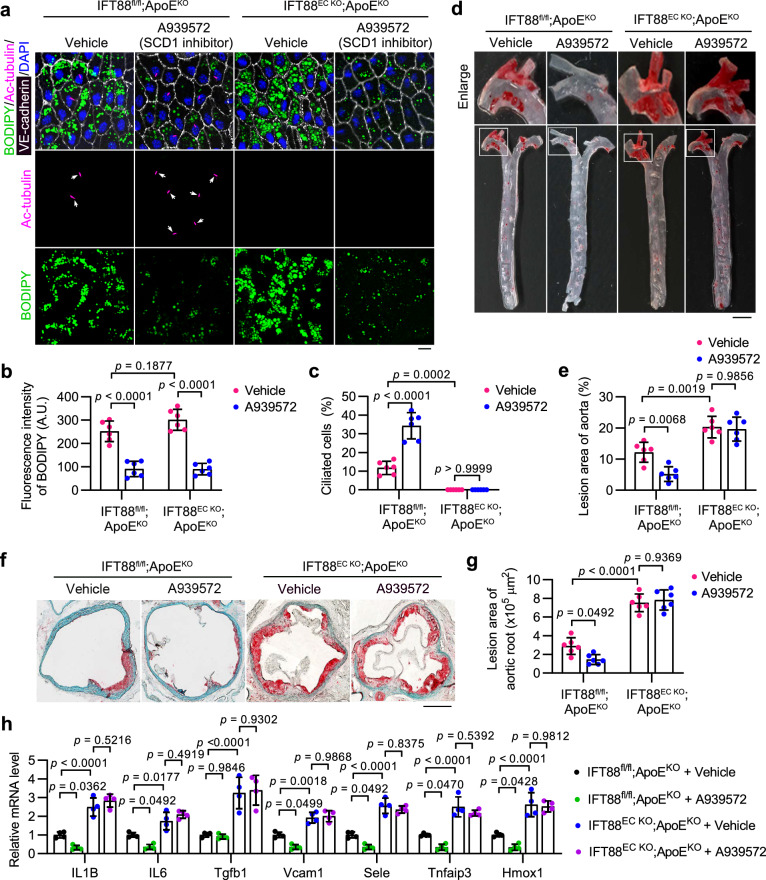
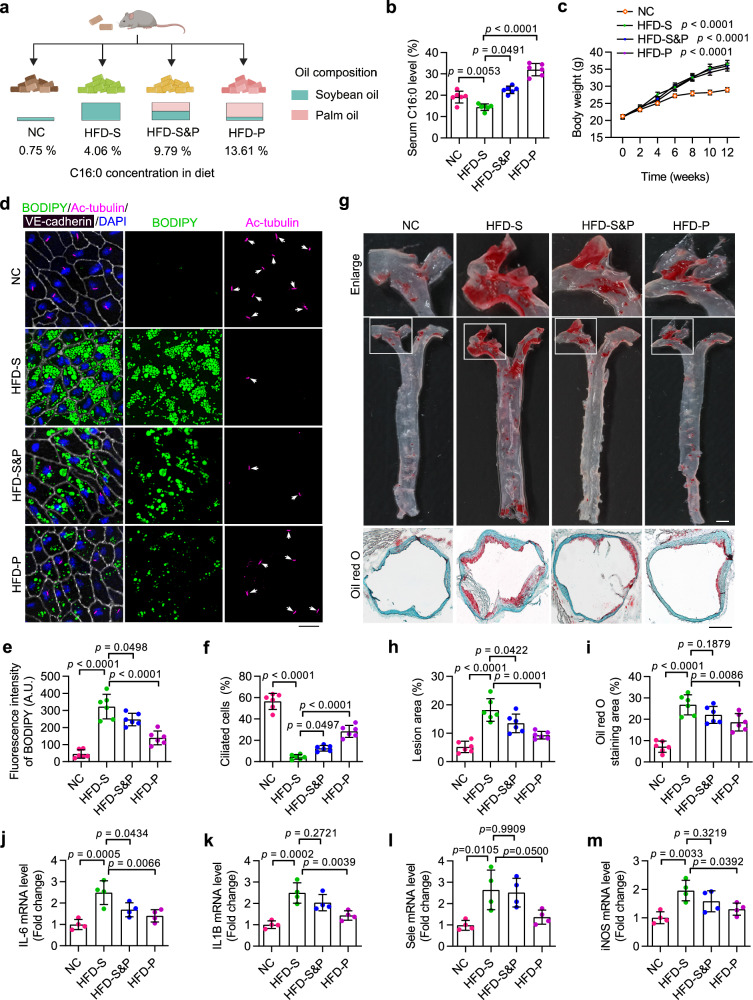
Disruption of ciliary homeostasis in vascular endothelial cells has been implicated in the development of atherosclerosis. However, the molecular basis for the regulation of endothelial cilia during atherosclerosis remains poorly understood. Herein, we provide evidence in male mice that the accumulation of lipid droplets in vascular endothelial cells induces ciliary loss and contributes to atherosclerosis. Triglyceride accumulation in vascular endothelial cells differentially affects the abundance of free fatty acid species in the cytosol, leading to stimulated lipid droplet formation and suppressed protein S-palmitoylation. Reduced S-palmitoylation of ciliary proteins, including ADP ribosylation factor like GTPase 13B, results in the loss of cilia. Restoring palmitic acid availability, either through pharmacological inhibition of stearoyl-CoA desaturase 1 or a palmitic acid-enriched diet, significantly restores endothelial cilia and mitigates the progression of atherosclerosis. These findings thus uncover a previously unrecognized role of lipid droplets in regulating ciliary homeostasis and provide a feasible intervention strategy for preventing and treating atherosclerosis.


Conflict of interest statement

The authors declare no competing interests.

Figures

Fig. 1
Fig. 1. LD accumulation coincides with ciliary loss in VECs during atherosclerosis progression.
a, b Representative ORO staining and quantitative analysis of the whole aorta from 8-week-old ApoEKO mice fed a normal chow (NC) or a high-fat diet (HFD) for 0, 8, and 16 weeks (n = 4 mice). Scale bar, 5 mm. c En face immunofluorescence images of the inner curvature of the aortic arch VECs stained with antibodies against VE-cadherin (white) and ac-tubulin (magenta). LDs were stained with BODIPY (green), and nuclei were stained with DAPI (blue). Scale bar, 10 μm. d, e Quantification of BODIPY staining (d) and ciliation (e) of VECs of the aortic arch shown in (c) (n = 10 mice). f, g Scatter plots showing the relationship between ciliary signal and LD signal of randomly chosen ciliated VECs of the inner curvature of the aortic arch (n = 10 mice for each group). Male mice were used for this study. Data are presented as mean ± SEM. Statistical significance was determined by one-way ANOVA with post hoc analysis. Source data are provided as a Source Data file.
Fig. 2
Fig. 2. Accumulation of LDs triggers ciliary loss in cultured VECs.
ac Immunofluorescence images (a) and quantifications of LipidTOX staining (b) and ciliation (c) of cultured HAECs treated with oleic acid (OA) at the indicated concentration for 12 h, followed by serum starvation for 48 h (n = 10 fields from 3 independent experiments). Boxed areas are enlarged in the bottom panel. Scale bar (for enlarged images), 10 µm. df Immunofluorescence images (d) and quantifications of LipidTOX staining (e) and ciliation (f) of HAECs treated with ATGL inhibitor (Atglistatin, 10 µM) for 12 h, followed by serum starvation for 48 h (n = 20 fields from 3 independent experiments). Boxed areas are enlarged in the bottom panel. Scale bar (for enlarged images), 10 µm. gi Immunofluorescence images (g) and quantifications of LipidTOX staining (h) and ciliation (i) of HAECs treated with DMSO or DGAT inhibitors (A922500, 10 µM and PF-06424439, 5 µM) for 24 h, exposed to bovine serum albumin (BSA) or OA for 12 h, and then serum-starved for 48 h (n = 20 fields from 3 independent experiments). 200 µM OA was used to stimulate LD formation. BSA was used as a control treatment. Scale bar, 20 µm. Data are presented as mean ± SEM. Statistical significance was determined by unpaired two-tailed Student’s t-test (e, f), one-way (b, c), or two-way (h, i) ANOVA with post hoc analysis. Source data are provided as a Source Data file.
Fig. 3
Fig. 3. LD accumulation disrupts ciliary homeostasis by reducing cytosolic PA availability.
a Metabolic pathway of indicated fatty acids. SCD1 stearoyl-CoA desaturase-1, Elovl Elongation of very long-chain fatty acid, Δ6D Δ6 desaturase, PA palmitic acid, POA palmitoleic acid, SA stearic acid, OA oleic acid, LA linoleic acid, GLA gamma-linolenic acid, DGLA dihomo-γ-linolenic acid, AA arachidonic acid. b, c GC-MS analysis showing changes in levels of indicated free fatty acids in HUVECs (n = 6 samples). ELA elaidic acid, EA erucic acid. d GC-MS analysis showing changes in the total free fatty acid level in HUVECs (n = 6 samples). eg Immunofluorescence images (e) and quantifications of LipidTOX staining (f) and cytosolic BODIPY FL C16 signal (g) of treated HUVECs (n = 10 fields from 3 independent experiments). Scale bar, 5 µm. hj LC-MS analysis showing the fractional abundance of 13C16-labeled PA in the cytosol (h), 13C16-labeled triglycerides in whole cells (i), and 13C16-labeled PA in the culture medium (j) of HUVECs with the following treatment: OA (200 μM) for 12 h; DGAT1 overexpression for 48 h; or Atglistatin (10 µM) for 24 h (n = 3 samples). HUVECs were pretreated with 13C16-PA (200 μM) for 24 h and rinsed with fresh medium before the above treatments. kp Immunofluorescence images (k, n) and quantifications of LipidTOX staining (l, o) and ciliation (m, p) of HAECs treated with 200 μM OA and/or 200 μM SA or PA for 12 h (n = 20 fields from 3 independent experiments). Cells were treated with BSA or OA for 12 h, exposed to SA or PA for 12 h, and then serum-starved for 48 h. Scale bars, 20 µm. Data are presented as mean ± SEM. Statistical significance was determined by unpaired two-tailed Student’s t-test (b, c, h, j), one-way (d), or two-way (f, g, l, m, o, and p) ANOVA with post hoc analysis. Source data are provided as a Source Data file.
Fig. 4
Fig. 4. Reduced PA availability decreases ciliary protein S-palmitoylation and stability.
a, b Immunofluorescence images (a) and quantification of ciliation (b, n = 20 fields from 3 independent experiments) of HUVECs treated with DMSO, 2-Bromopalmitate (2-BP, 50 μM), or Palmostatin B (PB, 10 μM) for 24 h, exposed to BSA or oleic acid (OA, 200 μM) for 12 h, and then serum-starved for 48 h. Scale bar, 10 μm. c, d Immunofluorescence images (c) and quantification of ciliation (d, n = 20 fields from 3 independent experiments) of treated HAECs. Scale bar, 20 μm. e, f COG analysis of upregulated (e) or downregulated (f) S-palmitoylated proteins upon OA treatment in HUVECs. g Venn diagram showing the overlap of S-palmitoylated proteins (identified in our study) and cilia-related proteins (based on the GO database). h Annotation of subcellular localization of palmitoylated cilia-related proteins identified in (g) (based on the Human Protein Atlas database). i, j Detection (i) and quantification (j) of S-palmitoylation levels of indicated cilia-related proteins (n = 3 samples). MAECs were pre-incubated with OA (200 μM) or BSA for 12 h and then supplemented with PA (200 μM) for another 12 h. In hydroxylamine+ (HAM+) groups, the palmitate residues were cleaved off and replaced with biotin, which allows the detection of palmitoylated proteins by IP-ABE. k, l HUVECs were overexpressed with ARL13B-Flag or ARL13B C8S/C9S-Flag (l), and the S-palmitoylation level of ARL13B-Flag and ARL13B C8S/C9S-Flag was examined by IP-ABE and immunoblotting. mp HUVECs were overexpressed with ARL13B-Flag or ARL13B C8S/C9S-Flag, pretreated with BSA, OA (200 μM), or OA+PA (200 μM, respectively) for 12 h and then treated with CHX (20 μg/mL) for the indicated time. The levels of ARL13B-Flag and ARL13B C8S/C9S-Flag were examined by immunoblotting (m, o) and quantified by densitometry (n, p) (n = 3 samples). Data are presented as mean ± SEM. Statistical significance was determined by one-way (d, j, n, and p) or two-way (b) ANOVA with post hoc analysis. Source data are provided as a Source Data file.
Fig. 5
Fig. 5. HFD-stimulated SCD1 disrupts ciliary homeostasis by reducing PA availability.
a Schematic of the reaction catalyzed by SCD1. b The mRNA level of SCD1 in MAECs isolated from ApoEKO mice fed NC or HFD (n = 6 mice). c, d Immunoblotting (c) and quantification (d, n = 3 mice) of the protein level of SCD1 in MAECs isolated from ApoEKO mice fed NC or HFD. e Levels of indicated fatty acids in HUVECs with or without SCD1 overexpression (n = 6 samples). fh Immunofluorescence images (f) and quantifications of BODIPY staining (g) and ciliation (h) of HUVECs treated with palmitic acid (PA) and palmitoleic acid (POA) at the indicated concentration for 12 h, followed by serum starvation for 48 h (n = 10 fields from 3 independent experiments). Scale bar, 10 µm. ik Immunofluorescence images (i) and quantifications of LipidTOX staining (j) and ciliation (k) of BSA- or PA (200 µM)-treated HAECs with or without SCD1 overexpression (n = 20 fields from 3 independent experiments). Boxed areas are enlarged in the bottom panel. Scale bar (for enlarged images), 10 µm. l HUVECs with or without SCD1 overexpression were treated with BSA or PA (200 µM) for 12 h. IP-ABE and immunoblotting were performed to determine the level of ARL13B S-palmitoylation. pcDNA3.1 vector was used as the Vector control. m, n HUVECs with or without SCD1 overexpression were treated with or without PA (200 µM) for 12 h. 20 mg/mL cycloheximide (CHX) was then added for the indicated time. The levels of ARL13B and SCD1 were examined by immunoblotting (m) and quantified by densitometry (n) (n = 3 samples). Data are presented as mean ± SEM. Statistical significance was determined by unpaired two-tailed Student’s t-test (b, d, and e), one-way (g, h, n), or two-way (j, k) ANOVA with post hoc analysis. Source data are provided as a Source Data file.
Fig. 6
Fig. 6. SCD1 inhibition attenuates atherosclerosis progression in an endothelial cilia-dependent manner.
ac En face immunofluorescence images (a) and quantifications of BODIPY staining (b) and ciliation (c) of aortic arch VECs from IFT88EC KO;ApoEKO and littermate ApoEKO mice intravenously injected with the SCD1 inhibitor A939572 (5 mg/kg body weight/2 days) or vehicle for 4 weeks after an 8-week HFD feeding (n = 6 mice). Scale bar, 10 μm. d Representative images of Oil Red O (ORO) staining of atherosclerosis lesions on the aorta of IFT88EC KO;ApoEKO and littermate ApoEKO mice treated as described in (a). Boxed areas are enlarged in the top panel. Scale bar (for enlarged images), 1 mm. e Quantification of atherosclerotic lesions shown in (d) (n = 6 mice). f Representative ORO staining in the aortic root of IFT88EC KO;ApoEKO and littermate ApoEKO mice treated as described in (a). Scale bar, 500 μm. g Quantification of atherosclerotic lesions shown in (f) (n = 6 mice). h Transcriptional levels of IL1B, IL6, Tgfb1, Vcam1, Sele, Tnfaip3, and Hmox1, in mice treated as described in (a) (n = 4 mice). Data are presented as mean ± SEM. Statistical significance was determined by two-way ANOVA with post hoc analysis. Source data are provided as a Source Data file.
Fig. 7
Fig. 7. A PA-enriched diet preserves VEC cilia and alleviates the progression of atherosclerosis.
a Eight-week-old ApoEKO mice were divided into four groups and fed indicated diets for 12 weeks. NC normal chow, HFD high-fat diet, S soybean oil, P palm oil. b, c Serum palmitic acid (PA) level (b) and body weight (c) of ApoEKO mice treated as described in (a) (n = 6 mice). df En face immunofluorescence images (d) and quantifications of BODIPY staining (e) and ciliation (f) of VECs of the aortic arch from ApoEKO mice treated as described in (a) (n = 6 mice). Scale bar, 20 μm. g Oil Red O (ORO) staining showing atherosclerotic lesions in the aortic tree and the aortic root obtained from mice treated as described in (a). Boxed areas are enlarged in the top panel. Scale bar (for the middle panel), 2 mm; Scale bar (for the bottom panel), 400 μm. h, i Quantification of atherosclerotic lesions in the aortic tree (h) and the aortic root (i) shown in (g) (n = 6 mice). jm Transcriptional levels of IL6, IL1B, Sele, and iNOS in the aorta of ApoEKO mice treated as described in (a) (n = 4 mice). Data are presented as mean ± SEM. Statistical significance was determined by one-way ANOVA with post hoc analysis. Panel (a) was created with BioRender.com and released under a Creative Commons Attribution-NonCommercial-NoDerivs 4.0 International license. Source data are provided as a Source Data file.

References

    1. Shi, L. et al. Brown adipose tissue-derived Nrg4 alleviates endothelial inflammation and atherosclerosis in male mice. Nat. Metab.4, 1573–1590 (2022). - PMC - PubMed
    1. Liu, M. et al. Macrophage K63-linked ubiquitination of YAP promotes its nuclear localization and exacerbates atherosclerosis. Cell Rep.32, 107990 (2020). - PubMed
    1. Karunakaran, D. et al. RIPK1 expression associates with inflammation in early atherosclerosis in humans and can be therapeutically silenced to reduce NF-κB activation and atherogenesis in mice. Circulation143, 163–177 (2021). - PubMed
    1. Ma, H. et al. NuMA forms condensates through phase separation to drive spindle pole assembly. J. Mol. Cell Biol.14, mjab081 (2022). - PMC - PubMed
    1. Jia, M. et al. Deletion of BACH1 attenuates atherosclerosis by reducing endothelial inflammation. Circ. Res.130, 1038–1055 (2022). - PubMed

Publication types

LinkOut - more resources