. 2024 Sep 27;14(1):22111.
doi: 10.1038/s41598-024-72793-2.

Investigating the modulatory effects of lactoferrin on depressed rats through 16S rDNA gene sequencing and LC-MS metabolomics analysis

Affiliations

Investigating the modulatory effects of lactoferrin on depressed rats through 16S rDNA gene sequencing and LC-MS metabolomics analysis

Jing Zhang et al. Sci Rep. .

Erratum in

Abstract

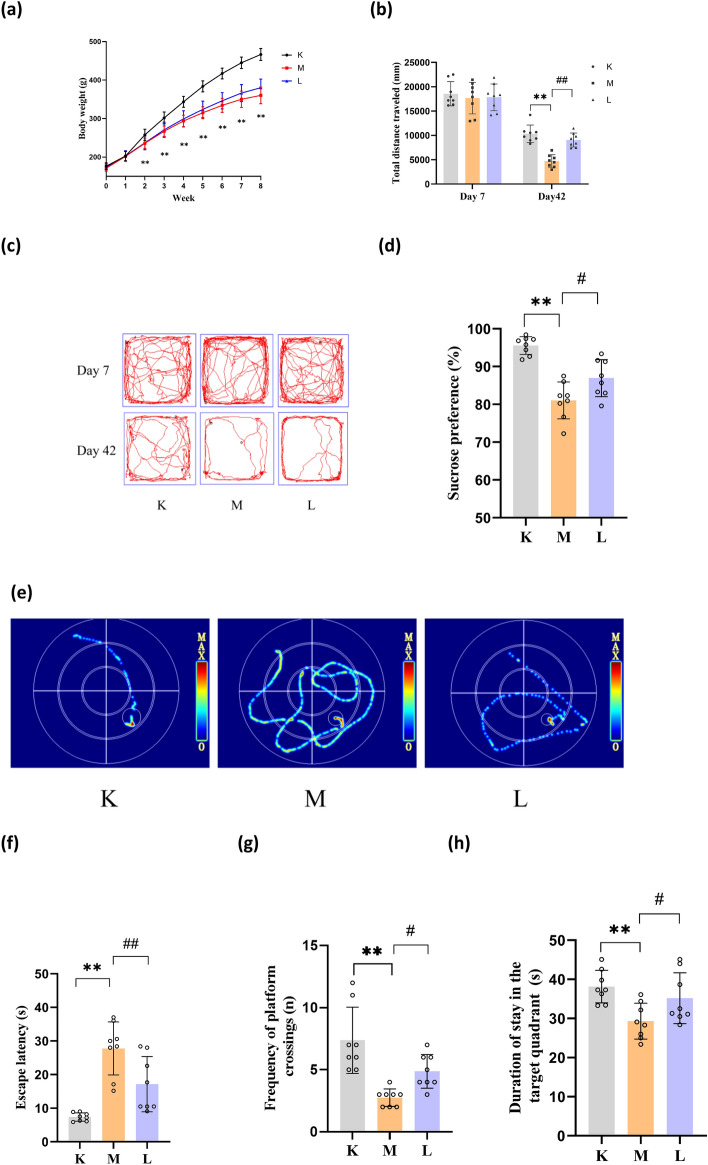
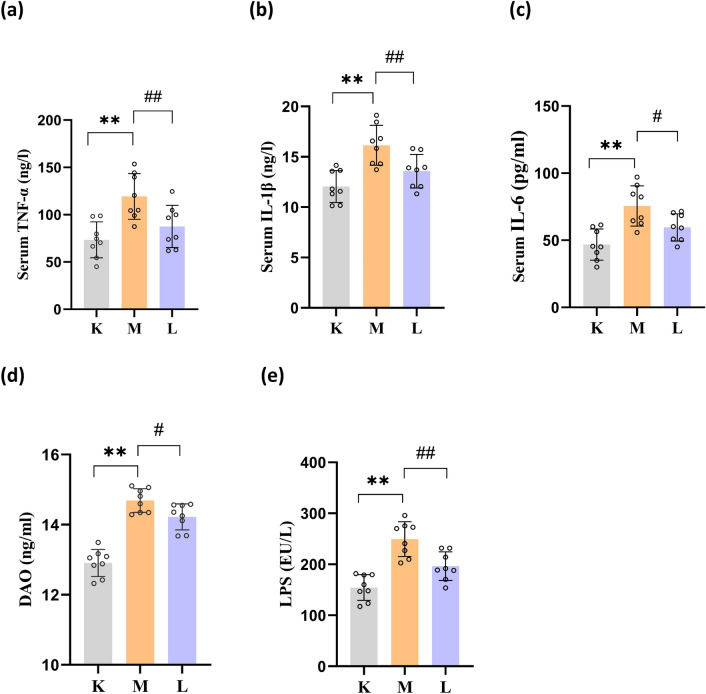
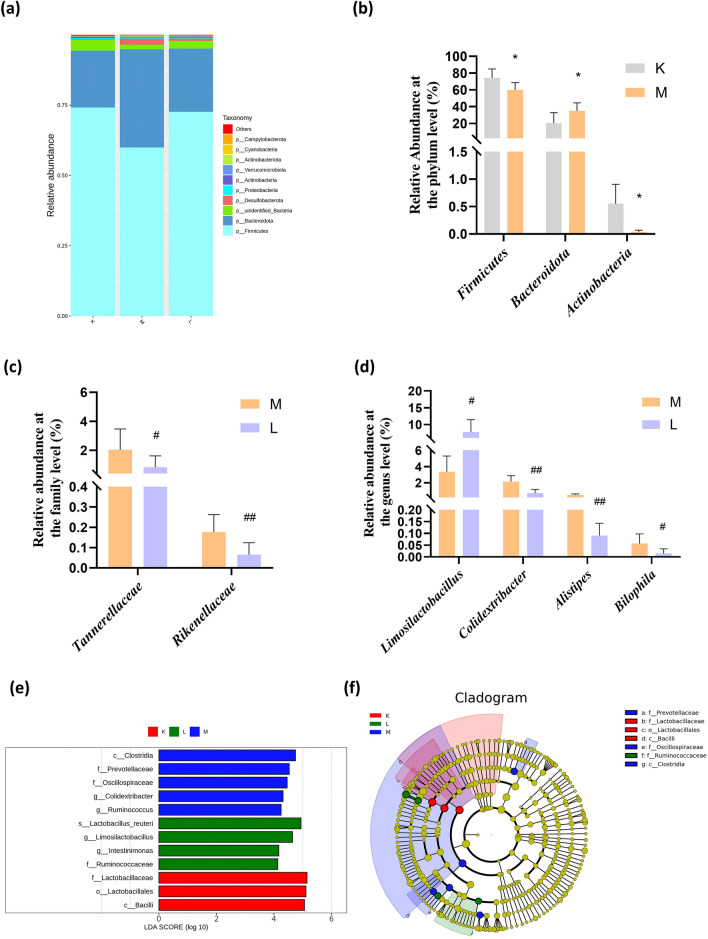
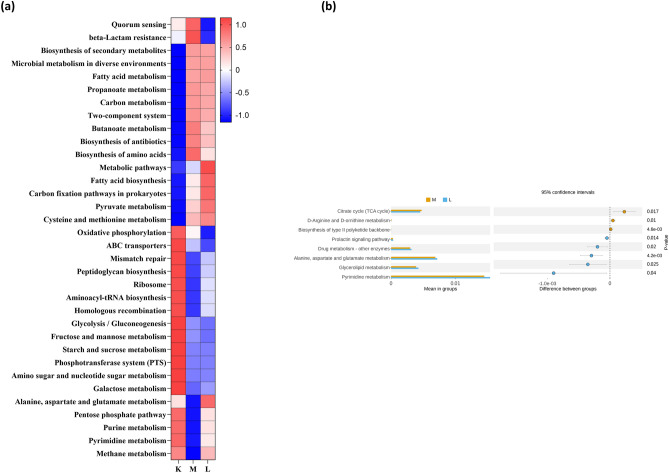
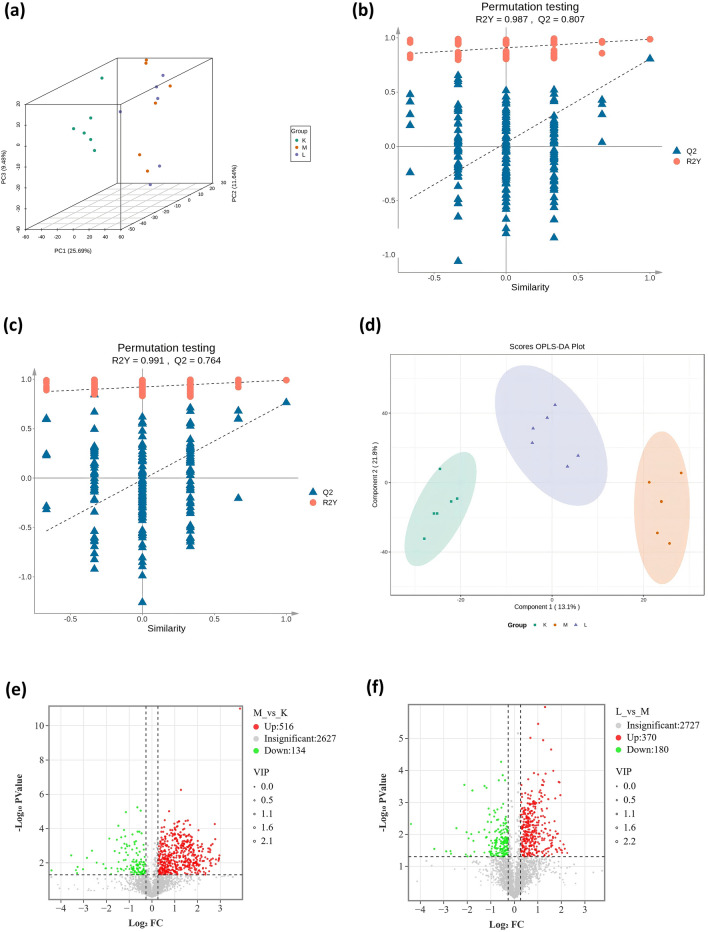
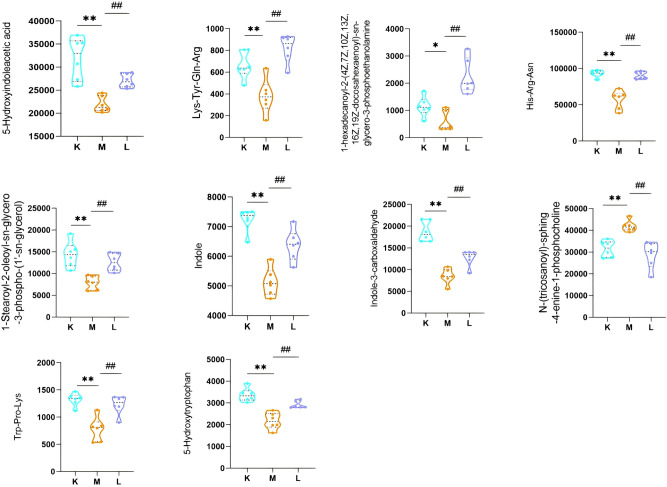
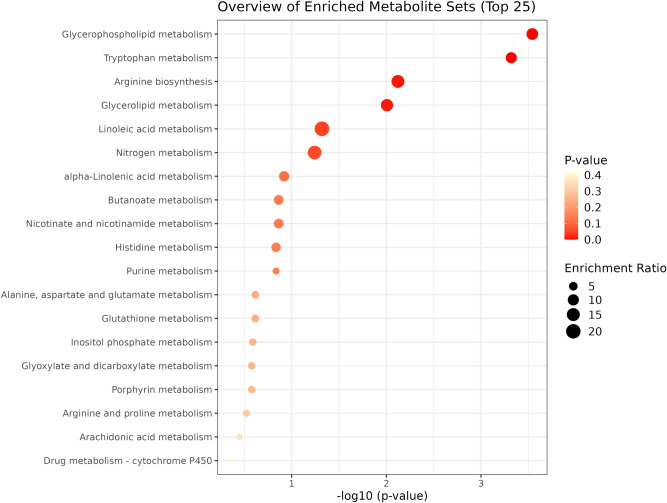
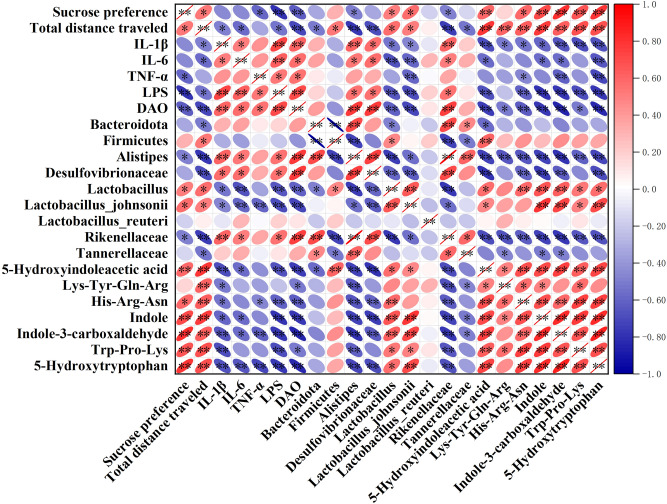
Lactoferrin is a natural multifunctional glycoprotein with potential antidepressant-like effects. However, the mechanism of its antidepressant effect has not been explored from the perspective of gut flora metabolism. Therefore, we employed both 16S rDNA gene sequencing and LC-MS metabolomics analysis to investigate the regulatory effects and mechanisms of lactoferrin in a rat model of depression. After one week of acclimatization, twenty-four 7-week-old male Sprague-Dawley rats were randomly and equally assigned into three groups: the control group, the model group, and the lactoferrin intervention group. The control group rats were housed under standard conditions, while the rats in the model and lactoferrin intervention groups were individually housed and exposed to chronic unpredictable mild stress for 44 days simultaneously. The lactoferrin intervention group was provided with water containing 2% lactoferrin (2 g/100 ml). Behavioural tests were conducted at week 7. Upon completion of the behavioral tests, the rats were anesthetized with isoflurane, humanely euthanized using a rat guillotine, and tissue samples were collected for further experiments. The results indicated that lactoferrin intervention led to an increase in sucrose solution consumption, horizontal movement distance, number of cross platforms, and residence time in the target quadrant. Additionally, it resulted in an increase in jejunal tight junction protein ZO-1 expression and a suppression of serum expression of inflammatory factors, Lipopolysaccharide and Diamine oxidase. In summary, lactoferrin can regulate the metabolic disorder of intestinal flora, reduce intestinal permeability, and further regulate the metabolic balance of hippocampal tissues through the microbiota-gut-brain axis. This process ultimately alleviates the depression-like behavior in rats.

Keywords: Depression; Gut microbiota; Lactoferrin; Metabolic disorders; Microbiota-gut-brain axis.


Conflict of interest statement

The authors declare no competing interests.

Figures

Fig. 1
Fig. 1
Effects of LF on body weight and behaviors in depressed rats. (a) Weekly changes in body mass of rats. (b) Total horizontal distance traveled in the OFT. (c) Trajectory map of three groups of rats on day 7 and day 42 of the OFT. (d) Sucrose preference in three groups of rats. (e) Trajectory map of localization voyage in three groups of rats. (f) Latency of avoidance behavior in the MWM. (g) Frequency of platform crossings in the MWM. (h) Duration of stay in the target quadrant. Note: Compared to group K, *p < 0.05, **p < 0.01; and compared to group M, #p < 0.05, ##p < 0.01. K control group; M model group; L LF treatment group.
Fig. 2
Fig. 2
Effects of LF on jejunal tissue and intestinal mucosal barrier in depressed rats (a) jejunal tissues stained with HE (b) ZO-1 expression in jejunal tissue from three groups of rats (c) The relative expression of ZO-1 is indicated by the mean optical density (MOD). Note: Compared to group K, *p < 0.05, **p < 0.01; and compared to group M, #p < 0.05, ##p < 0.01. K control group; M model group; L LF treatment group.
Fig. 3
Fig. 3
Effects of LF on levels of pro-inflammatory cytokines, DAO and LPS in depressed rats. (a) Level of TNF-α. (b) Level of IL-1β. (c) Level of IL-6. (d) Level of DAO. (e) Level of LPS. Note: Compared to group K, *p < 0.05, **p < 0.01; and compared to group M, #p < 0.05, ##p < 0.01. K control group; M model group; L LF treatment group.
Fig. 4
Fig. 4
Effects of LF on gut microbial diversity in depressed rats. (a) Indices of chao 1. (b) Indices of ace. (c) Indices of shannon. (d) Beta diversity of PCoA. There was a noticeable difference in the composition of the flora structure between the K and M groups. Additionally, it was observed that the structure of intestinal flora in the L group rats closely resembled that of K group. Note: *p < 0.05, **p < 0.01. K control group; M model group; L LF treatment group.
Fig. 5
Fig. 5
Effects of LF on gut microbial composition of depressed rats. (a) Composition at the phylum level. The ratio of Firmicutes and Bacteroidetes (F/B) increased in L group relative to M group. (b) t-test analysis at the phylum level. (c) t-test analysis at the family level (d) t-test analysis at the genus level. (e) Histogram of LDA analysis. When species with LDA Score > 4 are statistically different, the length of the histogram (LDA Score) represents the impact size of the different species. (f) The distribution difference of flora was analyzed using LEfSe. Note: Compared to group K, *p < 0.05, **p < 0.01; and compared to group M, #p < 0.05, ##p < 0.01. K control group; M model group; L LF treatment group.
Fig. 6
Fig. 6
The KEGG prediction of the intestinal microbiota. (a) Annotations of functional gene. (b) Analysis of expression levels using t-test. Note: The difference was deemed statistically significant when P < 0.05. K control group; M model group; L LF intervention group.
Fig. 7
Fig. 7
Effects of LF on the metabolism of the hippocampus in depressed rats (a) three-dimensional diagram of PCA. (b) Validation of the OPLS-DA model between groups K and M, where a Q2 value > 0.5 is considered as an effective model. (c) Validation of the OPLS-DA model between groups M and L, where R2 and Q2 values closer to 1 indicate a more stable and reliable predictive effect of the model. (d) Scores OPLA-DA plot. (e) Differential metabolite volcano plot comparing groups M and K. (f) Differential metabolite volcano plot comparing groups L and M.
Fig. 8
Fig. 8
Violin diagram of differential metabolites among the three groups. Note: The top 10 differential metabolites are presented in order of p-value. * p < 0.05 and ** p < 0.01 indicate significance compared to group K; # p < 0.05 and ## p < 0.01 indicate significance compared to group M. K control group; M model group; L LF intervention group.
Fig. 9
Fig. 9
KEGG enrichment analysis of differential metabolites. KEGG enrichment analysis of the aforementioned differential metabolites revealed that LF may exert its antidepressant effects through various metabolic pathways, such as glyceropholipid metabolism and tryptophan metabolism.
Fig. 10
Fig. 10
Correlation analysis of behavior, inflammatory factors, differential flora, and differential metabolites. Note: The color red indicates a positive correlation, while blue indicates a negative correlation. * p < 0.05, and ** p < 0.01.

Similar articles

References

    1. Tian, T. et al. Multi-omics data reveals the disturbance of glycerophospholipid metabolism caused by disordered gut microbiota in depressed mice. J. Adv. Res.39, 135–145 (2022). - PMC - PubMed
    1. Monroe, S. M. & Harkness, K. L. Major depression and its recurrences: life course matters. Annu. Rev. Clin. Psychol.18, 329–357 (2022). - PubMed
    1. Athira, K. V. et al. An overview of the heterogeneity of major depressive disorder: current knowledge and future prospective. Curr. Neuropharmacol.18, 168–187 (2020). - PMC - PubMed
    1. Cui, L. et al. Major depressive disorder: hypothesis, mechanism, prevention and treatment. Signal Transduct. Target. Ther.9, 30 (2024). - PMC - PubMed
    1. Winiarska-Mieczan, A. et al. Anti-inflammatory, antioxidant, and neuroprotective effects of polyphenols-polyphenols as an element of diet therapy in depressive disorders. Int. J. Mol. Sci.24, 2258 (2023). - PMC - PubMed

MeSH terms

LinkOut - more resources