. 2024 Dec;25(12):5331-5351.
doi: 10.1038/s44319-024-00266-8. Epub 2024 Sep 27.

A novel bacterial effector protein mediates ER-LD membrane contacts to regulate host lipid droplets

Affiliations

A novel bacterial effector protein mediates ER-LD membrane contacts to regulate host lipid droplets

Rajendra Kumar Angara et al. EMBO Rep. 2024 Dec.

Abstract

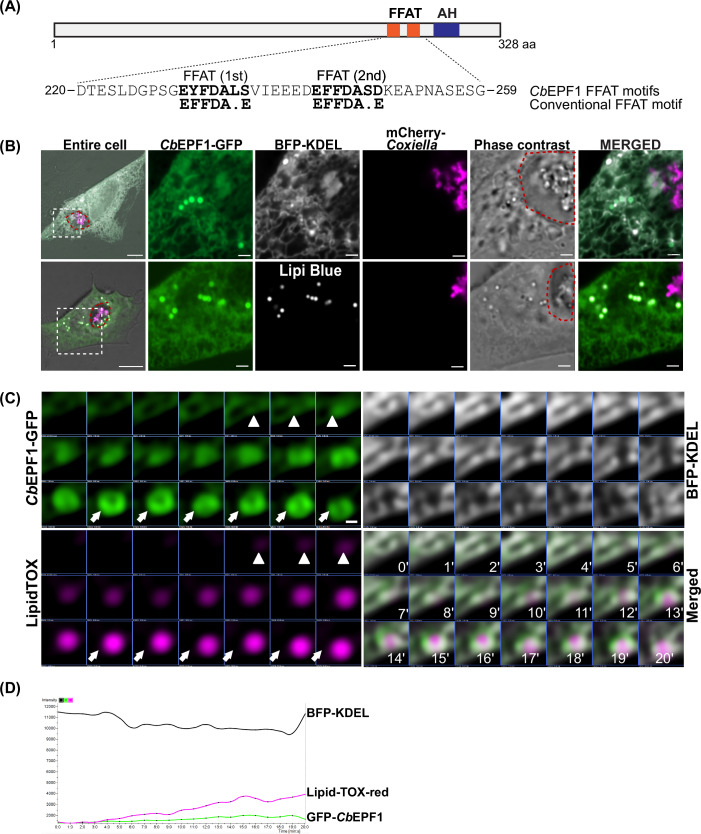
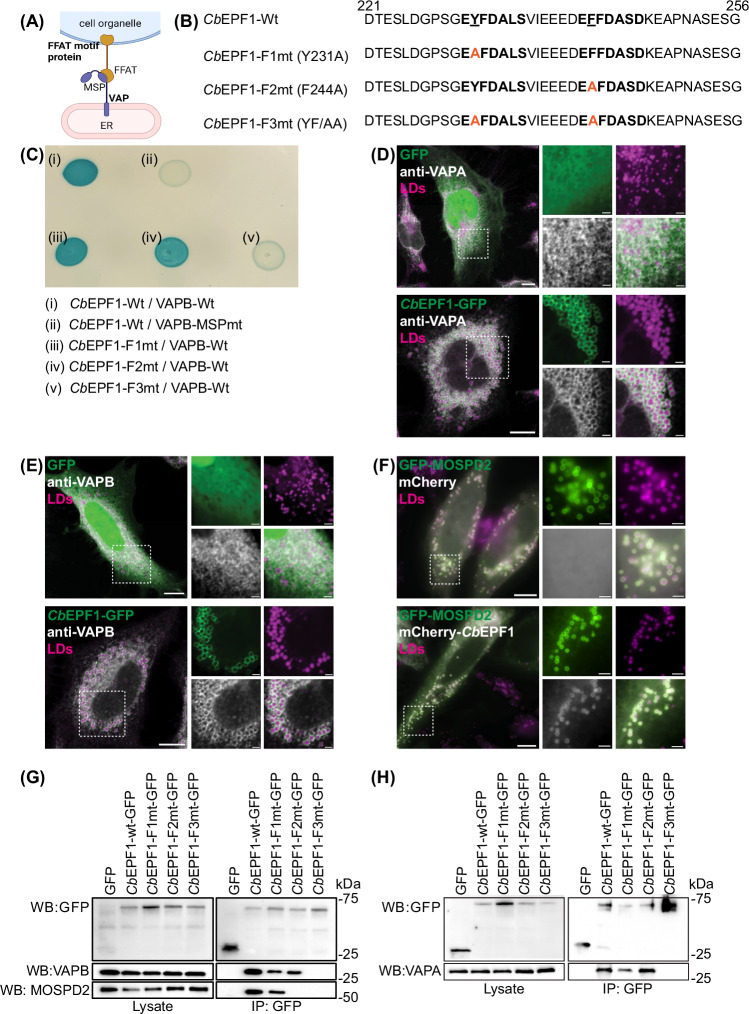
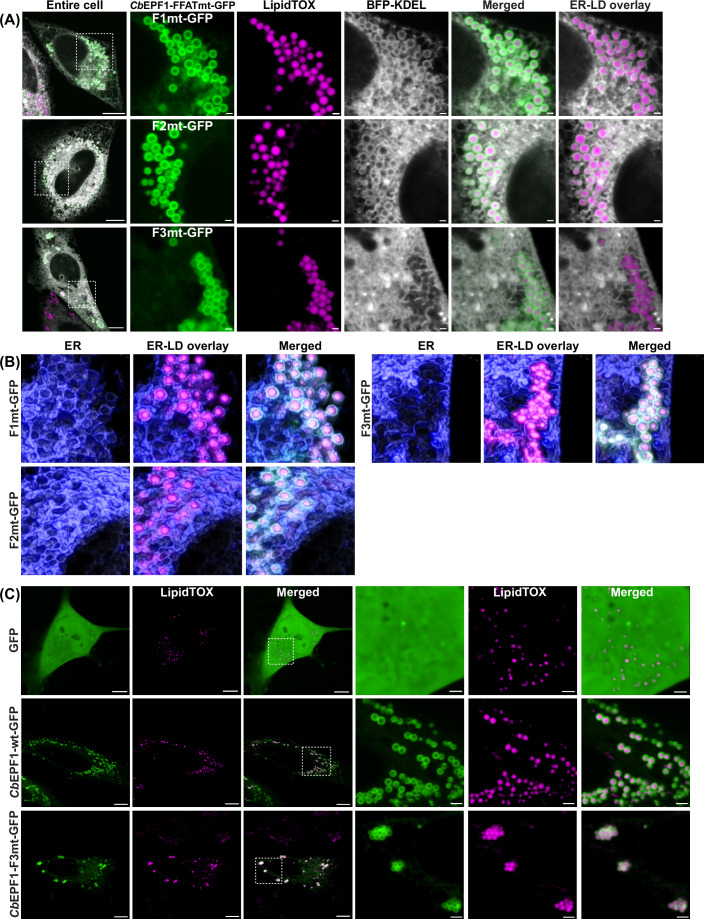
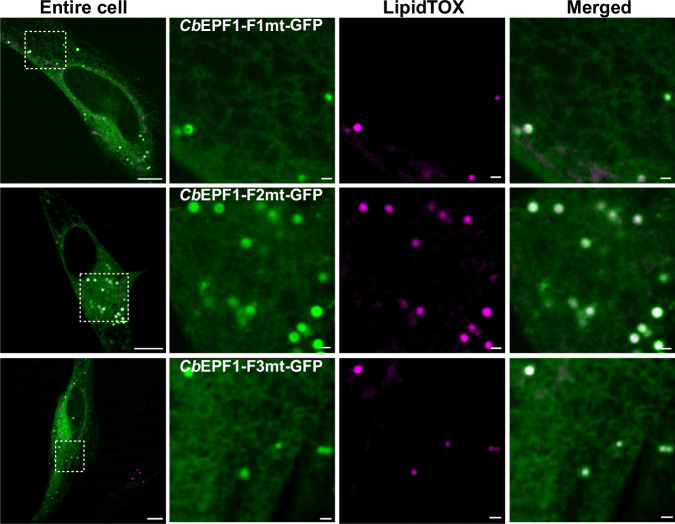
Effective intracellular communication between cellular organelles occurs at dedicated membrane contact sites (MCSs). Tether proteins are responsible for the establishment of MCSs, enabling direct communication between organelles to ensure organelle function and host cell homeostasis. While recent research has identified tether proteins in several bacterial pathogens, their functions have predominantly been associated with mediating inter-organelle communication between the bacteria containing vacuole (BCV) and the host endoplasmic reticulum (ER). Here, we identify a novel bacterial effector protein, CbEPF1, which acts as a molecular tether beyond the confines of the BCV and facilitates interactions between host cell organelles. Coxiella burnetii, an obligate intracellular bacterial pathogen, encodes the FFAT motif-containing protein CbEPF1 which localizes to host lipid droplets (LDs). CbEPF1 establishes inter-organelle contact sites between host LDs and the ER through its interactions with VAP family proteins. Intriguingly, CbEPF1 modulates growth of host LDs in a FFAT motif-dependent manner. These findings highlight the potential for bacterial effector proteins to impact host cellular homeostasis by manipulating inter-organelle communication beyond conventional BCVs.

Keywords: Coxiella burnetii; FFAT Motif; Inter-organelle Contacts; Lipid Droplets; Molecular Tethers.


Conflict of interest statement

Disclosure and competing interests statement. The authors declare no competing interests.

Figures

Figure 1
Figure 1. CbEPF1-GFP localizes to host ER and LDs.
(A) Two putative FFAT motifs were identified in the C-terminal region of CbEPF1 protein. The sequence and position of the FFAT motifs are shown, with amino acid numbers indicated. Conventional FFAT motif sequence is shown below predicted CbEPF1 FFAT motifs. AH represents a predicted site of amphipathic helix. (B) Live cell microscopy shows that ectopically expressed CbEPF1-GFP localized to the host ER and LDs in mCherry-Coxiella infected HeLa cells. The ER was labeled with BFP-KDEL and LDs were labeled with LipidTOX-red. The Coxiella-containing vacuole (CCV) membrane is outlined in red in the phase image. Scale bar 10 µm (overview) and 2 µm (magnified). (C) CbEPF1-GFP associated with LD biogenesis in the ER. Arrowheads indicate early-stage LD biogenesis sites (t = 4–6 min) and arrows mark larger LDs with CbEPF1-GFP localized on the entire LD surface (t > 13 min). Images were acquired every 1 min (t = 0–20 min) by spinning disc confocal microscopy. Scale bar 0.2 µm. (D) Intensity profile of BFP-KDEL, CbEPF1-GFP, and LipidTOX-red from Fig. 1C during LD biogenesis in the ER from t = 0–20 min. From 4 min time point, the increase in LipidTOX-red intensity indicates emergence and growth of LD.
Figure 2
Figure 2. CbEPF1 associates with host LDs and induces inter-organelle contact sites between the host ER and LDs.
(A) HeLa cells expressing CbEPF1-GFP and BFP-KDEL were treated with OA (30 µM) and imaged every 6 h by live cell spinning disc microscopy. Representative deconvoluted images show CbEPF1-GFP relocates from the ER to the LD surface as LDs grow (arrowhead). Scale bar 10 µm (overview) and 1 µm (magnified). (B) HeLa cells expressing GFP or CbEPF1-GFP and BFP-KDEL were treated with OA (100 µM, overnight) to induce LD biogenesis. LDs were visualized with LipidTOX red. ER shows limited association with LDs in GFP expressing cells (top panel). CbEPF1-GFP expression induces extended contacts between ER and LDs (bottom panel). Arrows show ER wrapping around CbEPF1 localized LDs. Arrowheads show absence of ER interaction at the regions of LDs where CbEPF1-GFP localization is absent. Scale bar 10 µm (overview) and 1 µm (magnified). (C) Representative image of 3D rendering of a Z-stack image illustrating the association between LDs (magenta) and ER (blue). (i) In cells expressing GFP alone, the ER exhibits minor contacts with LDs. (ii) In contrast, cells expressing CbEPF1-GFP display extended ER-LD contacts, with ER-LD interactions specifically localized to regions where CbEPF1-GFP (green) is present on LDs.
Figure 3
Figure 3. CbEPF1 FFAT motifs interact with the VAP MSP domain.
(A) Schematic representation of the FFAT motif-containing protein interaction with the ER protein VAP to form inter-organelle contact sites between ER and LDs. Created with BioRender.com. (B) CbEPF1 amino acid sequence contains two FFAT motifs. Number indicates amino acid position; essential position (2nd residue) in FFAT motif is underlined. Mutations in FFAT motif(s) are highlighted in orange. (C) Bacterial adenylate cyclase-based two-hybrid assay (BACTH) shows CbEPF1 interacts with VAPB in an MSP-FFAT motif-dependent manner. (D) HeLa cells expressing GFP (green) or CbEPF1-GFP (green) were treated with OA (100 µM, overnight) and labeled with anti-VAPA (white). LDs were stained with Lipi Blue (magenta). Scale bars: 10 µm (overview) and 2 µm (magnified). (E) HeLa cells expressing GFP (green) or CbEPF1-GFP (green) were treated with OA (100 µM, overnight) and labeled with anti-VAPB (white). LDs were stained with Lipi Blue (magenta). Scale bars: 10 µm (overview) and 2 µm (magnified). (F) HeLa cells expressing GFP-MOSPD2 (green) along with mCherry (white) or mCherry-CbEPF1 (white) were treated with OA (100 µM, overnight) and LDs were stained with Lipi Blue (magenta). Scale bars: 10 µm (overview) and 2 µm (magnified). (G, H) Immunoprecipitation of GFP and CbEPF1-GFP (WT, F1mt, F2mt, and F3mt) from lysates of HEK293 induced with OA (100 µM, overnight). WB represents western blot analysis using respective primary antibody. Source data are available online for this figure.
Figure 4
Figure 4. Functional FFAT motifs are required for CbEPF1-induced ER-LDs contact sites.
(A) CbEPF1-F1mt-GFP and CbEPF1-F2mt-GFP induce ER-LD contact sites while CbEPF1-F3mt-GFP failed to induce ER-LD contact sites. Scale bar 10 µm (overview) and 1 µm (magnified). (B) Representative image of 3D rendering of a Z-stack image illustrating the association between LDs (magenta) and ER (blue) in CbEPF1-FFAT mutant-GFP expressing cells. CbEPF1-F1mt-GFP or CbEPF1-F2mt-GFP expressing cells exhibited ER-LD contacts, while the CbEPF1-F3mt-GFP expressing cells showed exclusion of ER around LD clusters. (C) CbEPF1-F3mt-GFP expression in cells causes clustering of LDs. Scale bar 10 µm (overview) and 1 µm (magnified).
Figure 5
Figure 5. C. burnetii infection induces ER-LD contacts in macrophages.
(A) Representative transmission electron micrograph of uninfected or C. burnetii-infected MH-S cells. Black arrows mark the ER-LD contact areas that are less then 40 nm distance. Yellow lines are LDs, Magenta lines are endoplasmic reticulum and red dashed lines are CCV membrane. CCV, C. burnetii Containing Vacuole; LD, lipid droplets; ER, endoplasmic reticulum. Scale bar represents 2 μm (overview) and 500 nm (magnified). (B) Quantification of LD surface covered with ER at <40 nm distance. Random LDs from ten different cells were measured to calculate % of LD surface covered with ER (n = 30 LDs for uninfected cells and n = 31 LDs for Coxiella-infected cells). Data was collected from a single experiment. Statistical analysis was performed using Two‐tailed Unpaired Student’s t‐test. P = 0.0042 (Uninfected vs Coxiella-infected). Error bars represent the mean ± SEM. Source data are available online for this figure.
Figure 6
Figure 6. An amphipathic helix (AH) in the C-terminal region and a hydrophobic region in the middle of CbEPF1 are crucial for LD targeting.
(A) Helical wheel representation of the wild-type amphipathic helix (AH) (left) and mutant amphipathic helix (AHmt) (right) (aa 262–279) generated with HeliQuest. The mutations in AHmt alters the amphipathic character of the helix by reducing its hydrophobic moment (μH) from 0.403 (AH) to 0.103 (AHmt). (B) Top: Schematic representation of full-length CbEPF1-WT as GFP fusion. Bottom: Localization of the CbEPF1-WT-GFP (green) along with BFP-KDEL (white) in HeLa cells treated with OA; LDs were stained with Lipi Red (magenta). Scale bars: 10 μm (overview) and 2 μm (magnified). (C) Top: Schematic representation of full-length CbEPF1-WT with mutations in AH region as GFP fusion. Bottom: Localization of the CbEPF1-AHmt-GFP along with BFP-KDEL (white) in HeLa cells treated with OA; LDs were stained with Lipi Red (magenta). Arrow heads show LDs without CbEPF1-AHmt-GFP localization and arrows show LDs with CbEPF1-AHmt-GFP localization. Scale bars: 10 μm (overview) and 2 μm (magnified). (D) Top: Schematic representation of WT amphipathic helix region (AH) as GFP fusion. Bottom: Localization of the AH-GFP along with BFP-KDEL (white) in HeLa cells treated with OA; LDs were stained with Lipi Red (magenta). Scale bars: 10 μm (overview) and 2 μm (magnified). (E) Top: Schematic representation of mutant amphipathic helix region (AHmt) as GFP fusion. Bottom: Localization of the AHmt-GFP along with BFP-KDEL (white) in HeLa cells treated with OA; LDs were stained with Lipi Red (magenta). Scale bars: 10 μm (overview) and 2 μm (magnified). (F) Top: Schematic representation of N-terminal 101 amino acids of CbEPF1 (CbEPF1-N(1-101aa)) as GFP fusion. Bottom: Localization of the CbEPF1-N(1-101aa)-GFP along with BFP-KDEL (white) in HeLa cells treated with OA; LDs were stained with Lipi Red (magenta). Scale bars: 10 μm (overview) and 2 μm (magnified). (G) Top: Schematic representation of middle 111 amino acids of CbEPF1 (CbEPF1-M(101-212aa)) as GFP fusion. Bottom: Localization of the CbEPF1-M(101-212aa)-GFP along with BFP-KDEL (white) in HeLa cells treated with OA; LDs were stained with Lipi Red (magenta). Scale bars: 10 μm (overview) and 2 μm (magnified). (H) Top: Schematic representation of C-terminal 115 amino acids of CbEPF1 (CbEPF1-C(213-328aa)) as GFP fusion. Bottom: Localization of the CbEPF1-C(213-328aa)-GFP along with BFP-KDEL (white) in HeLa cells treated with OA; LDs were stained with Lipi Red (magenta). Scale bars: 10 μm (overview) and 2 μm (magnified). (I) Top: Schematic representation of C-terminal 115 amino acids of CbEPF1 with mutations in AH region (CbEPF1-C-AHmt(213-328aa)) as GFP fusion. Bottom: Localization of the CbEPF1-C-AHmt(213-328aa)-GFP along with BFP-KDEL (white) in HeLa cells treated with OA; LDs were stained with Lipi Red (magenta). Scale bars: 10 μm (overview) and 2 μm (magnified). (J) Top: Schematic representation of N-terminal 252 amino acids of CbEPF1 (CbEPF1(1-252aa)) as GFP fusion. Bottom: Localization of the CbEPF1(1-252aa)-GFP along with BFP-KDEL (white) in HeLa cells treated with OA; LDs were stained with Lipi Red (magenta). Scale bars: 10 μm (overview) and 2 μm (magnified).
Figure 7
Figure 7. CbEPF1 regulates host LD metabolism.
(A) HeLa cells expressing CbEPF1-GFP or CbEPF1-FFAT mutant-GFP contain significantly high number of LDs compared to GFP expressing cells. The number of LDs/cell in HeLa cells transiently expressing respective protein were quantified and shown as mean ± SEM. Data were collected from GFP (n = 39), CbEPF1-GFP (n = 41), CbEPF1-F1mt-GFP (n = 46), CbEPF1-F2mt-GFP (n = 48), CbEPF1-F3mt-GFP (n = 44) transfected HeLa cells. Cells were randomly selected from three independent experiments. Independent experiments are color-coded. Statistical analysis was performed using one-way ANOVA with Tukey’s multiple comparisons test. P = 62 × 10−7 (GFP vs CbEPF1-GFP), P = 9.1 × 10⁻⁷ (GFP vs CbEPF1-F1mt-GFP), P = 5.1 × 10⁻⁷ (GFP vs CbEPF1-F2mt-GFP), and P = 0.0133 (GFP vs CbEPF1-F3mt-GFP). (B) HeLa cells with CbEPF1-GFP or CbEPF1-F1mt-GFP or CbEPF1-F2mt-GFP expression show larger LDs when induced with OA (100 μM) compared to GFP or CbEPF1-F3mt-GFP expressing cells. LD size in cells expressing the respective protein were quantified and shown as mean ± SEM. Data were collected from GFP (n = 230 LDs from 13 cells); CbEPF1-GFP (n = 270 LDs from 17 cells); CbEPF1-F1mt-GFP (n = 260 LDs from 15 cells); CbEPF1-F2mt-GFP (n = 260 LDs from 16 cells); CbEPF1-F3mt-GFP (n = 230 LDs from 14 cells) transfected HeLa cells. Cells were randomly selected from three independent experiments. Independent experiments are color-coded. Statistical analysis was performed using one-way ANOVA with Tukey’s multiple comparisons test. P < 1 × 10⁻¹⁵ (GFP vs CbEPF1-GFP), P < 1 × 10⁻¹⁵ (GFP vs CbEPF1-F1mt-GFP), P < 1 × 10⁻¹⁵ (GFP vs CbEPF1-F2mt-GFP), P = 0.9248 (GFP vs CbEPF1-F3mt-GFP), P < 1 × 10⁻¹⁵ (CbEPF1-GFP vs CbEPF1-F3mt-GFP), P < 1 × 10⁻¹⁵ (CbEPF1-F1mt-GFP vs CbEPF1-F3mt-GFP) and P < 1 × 10⁻¹⁵ (CbEPF1-F2mt-GFP vs CbEPF1-F3mt-GFP). (C) Representative images for LD size in HeLa cells expressing GFP or CbEPF1-GFP or CbEPF1-FFAT mutants, treated with OA (100 µM, overnight). Scale bars: 10 μm (overview) and 1 μm (magnified). Source data are available online for this figure.
Figure EV1
Figure EV1. CbEPF1-GFP and BFP-KDEL localization along lipid droplets.
Intensity profiles of CbEPF1-GFP and BFP-KDEL along the two lipid droplets (dotted lines). The shown image is from Fig. 2B bottom panel, which was reused for representation and intensity profile analysis. Scale bar on merged image: 1 μm. Intensity profiles: Black—BFP-KDEL, Green—CbEPF1-GFP, and Magenta—LipidTOX red.
Figure EV2
Figure EV2. Localization of CbEPF1-FFAT mutant-GFP in HeLa cells.
The ectopically expressed CbEPF1-F1mt-GFP or CbEPF1-F2mt-GFP or CbEPF1-F3mt-GFP localized to ER and LDs in HeLa cells. The CbEPF1-FFAT mutant-GFP proteins showed a similar localization pattern to CbEPF1-GFP (Fig. 1B). The LDs were labeled with LipidTOX-Red. Scale bars: 10 μm (overview) and 1 μm (magnified).
Figure EV3
Figure EV3. Dispersion of LDs in cells expressing CbEPF1-F1/F2 mutant-GFP.
Cells expressing CbEPF1-F1mt-GFP or CbEPF1-F2mt-GFP exhibit dispersed LDs in the HeLa cells. Scale bars: 10 μm (overview) and 1 μm (magnified).

Update of

References

    1. Agaisse H, Derré I (2015) STIM1 is a novel component of ER-Chlamydia trachomatis inclusion membrane contact sites. PLoS ONE 10:e0125671 - PMC - PubMed
    1. Almeida C, Amaral MD (2020) A central role of the endoplasmic reticulum in the cell emerges from its functional contact sites with multiple organelles. Cell Mol Life Sci 77:4729–4745 - PMC - PubMed
    1. Alpy F, Rousseau A, Schwab Y, Legueux F, Stoll I, Wendling C, Spiegelhalter C, Kessler P, Mathelin C, Rio M-C et al (2013) STARD3 or STARD3NL and VAP form a novel molecular tether between late endosomes and the ER. J Cell Sci 126:5500–5512 - PubMed
    1. Beare PA, Howe D, Cockrell DC, Omsland A, Hansen B, Heinzen RA (2009) Characterization of a Coxiella burnetii ftsZ mutant generated by Himar1 transposon mutagenesis. J Bacteriol 191:1369–1381 - PMC - PubMed
    1. Bi D, Liu L, Tai C, Deng Z, Rajakumar K, Ou H-Y (2013) SecReT4: a web-based bacterial type IV secretion system resource. Nucleic Acids Res 41:D660–D665 - PMC - PubMed

Substances

LinkOut - more resources