. 2024 Nov;43(22):5690-5717.
doi: 10.1038/s44318-024-00252-9. Epub 2024 Sep 27.

The TrkC-PTPσ complex governs synapse maturation and anxiogenic avoidance via synaptic protein phosphorylation

Affiliations

The TrkC-PTPσ complex governs synapse maturation and anxiogenic avoidance via synaptic protein phosphorylation

Husam Khaled et al. EMBO J. 2024 Nov.

Abstract

The precise organization of pre- and postsynaptic terminals is crucial for normal synaptic function in the brain. In addition to its canonical role as a neurotrophin-3 receptor tyrosine kinase, postsynaptic TrkC promotes excitatory synapse organization through interaction with presynaptic receptor-type tyrosine phosphatase PTPσ. To isolate the synaptic organizer function of TrkC from its role as a neurotrophin-3 receptor, we generated mice carrying TrkC point mutations that selectively abolish PTPσ binding. The excitatory synapses in mutant mice had abnormal synaptic vesicle clustering and postsynaptic density elongation, more silent synapses, and fewer active synapses, which additionally exhibited enhanced basal transmission with impaired release probability. Alongside these phenotypes, we observed aberrant synaptic protein phosphorylation, but no differences in the neurotrophin signaling pathway. Consistent with reports linking these aberrantly phosphorylated proteins to neuropsychiatric disorders, mutant TrkC knock-in mice displayed impaired social responses and increased avoidance behavior. Thus, through its regulation of synaptic protein phosphorylation, the TrkC-PTPσ complex is crucial for the maturation, but not formation, of excitatory synapses in vivo.

Keywords: Avoidance Behavior; Neurotrophin Receptor; Protein Phosphorylation; Social Novelty; Synapse Organizer.


Conflict of interest statement

Disclosure and competing interests statement The authors declare no competing interests.

Figures

Figure 1
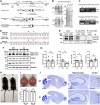
Figure 1. Generation and validation of the D240A;D242A TrkC knock-in mutant mouse line.
(A) Gene targeting strategy based on a traditional homologous recombination method. (B) Validation of planned homologous recombination and lack of random insertion by Southern blotting using 5’, 3’ and neo probes. A single asterisk and hash indicate bands from the wild-type (WT) allele, whereas double ones indicate bands from the knock-in (KI) allele. (C) PCR-based genotyping before and after the removal of neo cassette by crossing with ACTB:FLPe B6J mice. (D) Validation of nucleotide sequences encoding D240A;D242A in TrkC heterozygous and homozygous mutant mice. The highlighted M’s indicate the presence of both adenine and cytosine bases in heterozygous mice. (E) Co-immunoprecipitation validating absence of protein interaction between endogenous TrkC and PTPσ in TrkC KI homozygous mouse brains. (F) Representative immunoblots of TrkC TK + , TrkC TK − , PTPσ and NT-3 in hippocampal synaptosomes of TrkC KI mice and WT littermates. (G) Quantification of protein expression normalized to β-actin loading controls in hippocampal synaptosomes, expressed as a ratio of the values in WT mice. n = 8 pooled hippocampal synaptosome samples; Student’s t tests, P = 0.80, P = 0.11, P = 0.90, and P = 0.096 for TrkC TK + , TrkC TK − , PTPσ and NT-3, respectively. (H) No obvious anatomical defects in TrkC KI homozygous mice (TrkC KI mice). (I) No significant difference between TrkC KI and WT mouse brain size, gross morphology or weight. n = 3 mice per genotype per each sex. Student’s t tests, P = 0.23 for males and P = 0.53 for females. (J) Gross brain structure and layer formation of the hippocampus and cortex in Nissl-stained brain sections from a TrkC KI mouse and WT littermate are indistinguishable. Scale bars: 2 cm (H), 0.5 cm (I), 0.2 mm (J, left), and 500 μm (J, center and right). Data are presented as mean ± SEM. ns not significant. Source data are available online for this figure.
Figure 2
Figure 2. Synaptic expression of excitatory synaptic proteins VGLUT1 and PSD-95 is unchanged but their immunofluorescence signal intensity is increased in TrkC KI mice.
(A) Double immunolabeling of a brain section for VGLUT1 and PSD-95 showing the hippocampal CA1 region of TrkC KI mice and WT littermates. (B) High-magnification images of VGLUT1 and PSD-95 immunolabeling in the stratum radiatum (st. rad.) and quantification of the total intensity of VGLUT1 and PSD-95 puncta per area in this region. n = 12 regions from four mice (3 regions from each mouse) per genotype. Student’s t tests, ***P = 7.0 ×  10−7 for VGLUT1 and ***P = 0.00030 for PSD-95. (C) High-magnification images of VGLUT1 and PSD-95 immunolabeling in the stratum oriens (st. ori.) and quantification of the total intensity of VGLUT1 and PSD-95 puncta per area in this region. n = 12 regions from 4 mice per genotype. Student’s t tests, ***P = 5.0 × 10−5 for VGLUT1 and P = 0.93 for PSD-95. (D) High-magnification images and quantification of the number of DAPI-labeled cells per area in the hippocampal CA1 pyramidal layer. n = 12 regions from 4 mice per genotype. Student’s t test, P = 0.74. (E) Representative immunoblots of VGLUT1 and PSD-95 in synaptosomes from the hippocampus of TrkC KI mice and WT littermates, with quantification showing protein expression normalized to β-actin loading controls and expressed as a ratio of the values in WT mice. n = 9 hippocampal synaptosomal samples per genotype, with each sample prepared from pooled hippocampi derived from 6 mice of the same genotype. Student’s t tests, P = 0.70 for VGLUT1 and P = 0.91 for PSD-95. (F) Representative immunoblots of VGLUT1 and PSD-95 in total lysates from the hippocampus of TrkC KI mice and WT littermates, with quantification showing protein expression normalized to β-actin loading controls and expressed as a ratio of the values in WT mice. n = 9 hippocampal total lysate samples per genotype, with each sample prepared from pooled hippocampi derived from six mice of the same genotype. Student’s t tests, P = 0.45 for VGLUT1 and P = 0.49 for PSD-95. Scale bars: 500 μm (A) and 25 μm (BD). Data are presented as mean ± SEM. ns not significant. Source data are available online for this figure.
Figure 3
Figure 3. Excitatory synapses in TrkC KI mice show condensed clustering of synaptic vesicles and postsynaptic density elongation.
(A) Electron micrographs showing the hippocampal CA1 st. rad. and st. ori. of TrkC KI mice and WT littermates at 4 postnatal weeks. (B) Quantification of the number of asymmetric and symmetric synapses in the st. rad. and the st. ori. n = 6 samples from three mice for each genotype. Student’s t test, P = 0.40 and P = 0.68 for asymmetric and symmetric synapses in the st. rad., and P = 0.87 and P = 0.55 for asymmetric and symmetric synapses in the st. ori., respectively. (C) Quantification of PSD length in asymmetric synapses in the st. rad. and the st. ori. in TrkC KI mice and WT littermates. n = 556 WT and 566 KI asymmetric synapses in the st. rad. and 466 WT and 493 KI synapses in the st. ori. from three mice for each genotype were analyzed. Kolmogorov–Smirnov test, *P = 0.043 and P = 0.24 in the st. rad. and st. ori cumulative probability curves, respectively. Student’s t tests, ***P = 0.00014 and P = 0.77 in the st. rad. and st. ori. bar graphs, respectively. (D) Electron micrographs showing asymmetric synapses on dendritic regions in the hippocampal CA1 st. rad and st. ori. of TrkC KI and WT mice. (E, F) Quantification of the number of synaptic vesicles (SVs) per bouton area (E) and distance between SVs in asymmetric synapses (F) in the st. rad. and st. ori. n = 54 synapses for each region from three mice for each genotype. Student’s t tests, P = 0.38 and P = 0.44 in the st. rad. and st. ori., respectively, for SV number (E), and ***P = 3.8 × 10−14 and ***P = 4.5 × 10−13 in the st. rad. and st. ori., respectively, for SV distance (F). Scale bars represent 2 μm (A) and 250 nm (D). Data are presented as mean ± SEM. ns not significant. Source data are available online for this figure.
Figure 4
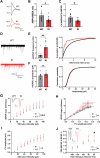
Figure 4. Preventing TrkC–PTPσ interaction increases silent synapses and causes aberrant active synapses on hippocampal CA1 pyramidal cells.
(A) Representative traces of AMPAR-mediated evoked EPSCs recorded at −70 mV and AMPAR plus NMDAR-mediated evoked EPSCs recorded at +40 mV from CA1 pyramidal cells of TrkC KI (red) and WT (black) mice in response to Schaffer collateral stimulation. (B) A comparison of the AMPAR/NMDAR ratio showed a significant reduction in TrkC KI mice. Student’s t test, *P = 0.019, n = 12 cells/5 mice per group. (C) The ratio of CV-NMDAR to CV-AMPAR significantly decreased in TrkC KI compared to WT mice. Student’s t test, *P = 0.022, n = 12 cells/5 mice per group. (D) Sample traces of AMPAR-mediated mEPSCs recorded from hippocampal CA1 pyramidal cells in TrkC KI (red) and WT (black) mice. (E) mEPSC frequency was increased in TrkC KI compared to WT mice. Student’s t test, **P = 0.0026, n = 10 WT cells/5 mice and 10 KI cells/4 mice. This increase resulted in a leftward shift in the cumulative probability curve corresponding to decreased inter-event intervals (Kolmogorov–Smirnov test, P < 1.0 × 10−15). (F) No significant differences were found between TrkC KI and WT neurons in mEPSC amplitude. Student’s t test, P = 0.24, n = 10 WT cells/5 mice and 10 KI cells/4 mice. (G) Input–output curves of fEPSPs elicited by Schaffer collateral stimulation and recorded from the CA1 st. rad. fEPSP input/output responses were significantly elevated in TrkC KI mouse hippocampal slices. n = 7 WT slices (3 mice) and 8 TrkC KI slices (3 mice); two-way repeated measures ANOVA, F(1,130) = 22.34, ***P = 5.8 × 10−6. Inset: Representative fEPSPs from CA1 elicited with stepwise increases in stimulation intensity (scale bar, 1 mV, 5 ms). (H) Linear fit slopes comparing fiber volley (FV) to fEPSP amplitude plots. The slopes were significantly different (F(1,146) = 6.221, *P = 0.014), with FV/slope values elevated in the TrkC KI slices. (I) Quantification of FV amplitude. No differences were detected in the relationships between stimulus intensity and presynaptic FV amplitude between groups. Two-way repeated measures ANOVA, F(1,130) = 0.7274, P = 0.40. (J) A presynaptic function assay identified a significant increase in the paired-pulse ratio (PPR) at inter-stimulus intervals <50 ms. n = 8 WT slices (5 mice) and 8 KI slices (6 mice); two-way repeated measures ANOVA, F(4,70) = 3.121, *P = 0.020; Šídák’s post hoc test at 20 ms (#P = 0.039). Inset: fEPSP PPR trace at 20 ms interpulse interval; scale bar, 1 mV, 40 ms. Data are presented as mean ± SEM. ns not significant. Source data are available online for this figure.
Figure 5
Figure 5. Unbiased quantitative phosphoproteomics detected altered phosphorylation in a group of synaptic proteins.
(A, B) Volcano plots showing no proteins are differentially expressed in hippocampal (A) or cortical (B) synaptosomes from TrkC KI mice and WT littermates. Differential protein expression was determined by a criteria of absolute fold change ( | FC | ) greater than 1.5 and P value in Student’s t test less than 0.05. n = 5 and three mice per genotype for the hippocampus and the cortex, respectively. (C, D) Volcano plots showing altered phosphorylated peptides in the hippocampus (C) and the cortex (D) of TrkC KI mice and WT littermates. Differential phosphopeptide expression was determined by a criteria of |FC| greater than 1.5 and P value in Student’s t test less than 0.05. n = 4 mice per genotype for the hippocampus and the cortex. (E) Venn diagram showing the number of peptides with altered phosphorylation in the hippocampus and the cortex of TrkC KI mice. (F) Heatmap showing the fold change (FC) of the altered phosphorylation sites detected in both the hippocampus and the cortex. Molecules indicated in red are listed in the SFARI Human Gene database. (G) GO analysis of the phosphorylated molecules altered in both the hippocampus and the cortex in TrkC KI mice for Cellular Component (CC), Biological Process (BP) and Molecular Function (MF). Enrichment for the GO term was determined with g:Profiler (Fisher’s Exact test with multiple testing correction based on the g:SCS algorithm). (H) SynGO analysis of the phosphorylated molecules altered in both the hippocampus and the cortex in TrkC KI mice for Biological Process. 18 of the altered 48 genes have Biological Processes annotation in the SynGO analysis. 10 of 208 Biological Processes terms were significantly enriched at 1% FDR (testing terms with at least three matching input genes).
Figure 6
Figure 6. TrkC KI mice show impaired social novelty.
(A) Three-chamber test showing normal social preference behavior in TrkC KI mice (upper) and social novelty test showing significantly less preference to a novel mouse than a familiar one in TrkC KI mice of both sexes (lower). Thus, TrkC KI mice show impaired social novelty but normal sociability. Equivalent total contact time with stranger mice in the three-chamber tests, suggesting no social anxiety in the TrkC KI mice (upper/lower right). One-way ANOVA with post hoc Šídák’s multiple comparison test, F(7,62) = 11.91, P = 1.6 × 10−9 for social preference, ***P (WT) = 7.6 × 10−6 and ***P (KI) = 0.00032 for males, and ***P (WT) = 2.3 × 10−5 and **P (KI) = 0.0043 for females. One-way ANOVA with post hoc Šídák’s multiple comparison test, F(7,62) = 4.397, P = 0.00051 for social novelty, ***P (WT) = 0.00065 and P (KI) = 0.98 for males, and **P (WT) = 0.0029 and P (KI) = 0.99 for females. Student’s t tests for interaction times, P (male) = 0.99 and P (female) = 0.45 for social preference, and P (male) = 0.30 and P (female) = 0.83 for social novelty. (B) Y-maze spontaneous alternation test showing no difference between TrkC KI and WT mice of either sex in spontaneous alternation percentage. Thus, TrkC KI mice exhibit normal spatial working memory. Student’s t tests, P (male) = 0.40 and P (female) = 0.29. (C) Fear conditioning test. The fear acquisition curve (left) made by the percentage of freezing responses shows that TrkC KI mice as well as WT mice in both sexes have the ability to acquire cued fear. Two-way repeated measures ANOVA, F(1,56) = 13.89, ***P = 0.00045 for males and F(1,68) = 9.632, **P = 0.003 for females. Quantification of the percentage of freezing responses in the contextual test (middle). Student t tests, *P (male) = 0.013 and *P (female) = 0.045. Quantification of the percentage of freezing responses in the altered-context test (context discrimination) and the tone test (cued fear memory test) (right). Two-way ANOVA with Šídák’s multiple comparisons test, F(1, 28) = 11.54, **P = 0.0021 in genotype and F(1, 28) = 86.43, ***P = 4.7 ×  10−10 in test for males, and F(1, 34) = 5.301, *P = 0.028 in genotype and F(1, 34) = 109.8, ***P = 3.5 × 10−12 in test for females. In genotype comparison, *P (male) = 0.018 and P (female) = 0.32 in the altered-context test, and P (male) = 0.57 and P (female) = 0.72 in the tone test. In comparison between the two tests, ***P (WT male) = 2.7 × 10−7, ***P (KI male) = 2.3 × 10−5, ***P (WT female) = 6.0 × 10−8, and ***P (KI female) = 1.1 × 10−7. TrkC KI mice of both sexes show normal contextual fear memory, contextual discrimination and cued fear memory. n = 12 WT male, 12 KI male, 13 WT female and 14 KI female littermate mice for Y-maze, n = 8 WT males, 8 KI males, 9 WT females and 10 KI females for the other tests. Data are presented as mean ± SEM. ns not significant. Source data are available online for this figure.
Figure 7
Figure 7. TrkC KI mice show enhanced avoidance of anxiogenic conditions.
(A) Number of mice exhibiting jumping behavior in the habituation session. (B) Open-field test showing normal anxiety behavior in TrkC KI mice. There was no difference between TrkC KI mice and WT mice of either sex in center area duration (left graph). Student’s t tests, P (male) = 0.91 and P (female) = 0.84. TrkC KI females traveled significantly less than WT females, while TrkC KI males showed equivalent distance to WT males (middle). Student’s t tests, P (male) = 0.62 and ***P (female) = 9.8 × 10−5. TrkC KI females as well as TrkC KI males had equivalent velocity compared to their WT littermates (right). Student’s t tests, P (male) = 0.90 and P (female) = 0.61. (C) Elevated plus maze test showing normal anxiety behavior in TrkC KI mice. There was no difference between TrkC KI mice and WT mice of either sex in open-arm entry frequency (upper) or duration (lower). Student’s t tests, P (male) = 0.37 and P (female) = 0.63 in open-arm frequency and P (male) = 0.50 and P (female) = 0.94 in open-arm duration. (D) TrkC KI mice buried fewer marbles than WT mice. Many marbles also seem untouched by the TrkC KI mice and remain located in their initial starting position (left image). Student’s t tests, **P (male) = 0.002 and ***P (female) = 0.00027. (E) Normal grooming behavior in TrkC KI mice after splashing sucrose solution. There was no difference between TrkC KI and WT mice of either sex in grooming frequency (left) or grooming duration (right). Student’s t tests, P (male) = 0.62 and P (female) = 0.82 in grooming frequency and P (male) = 0.99 and P (female) = 0.62 in grooming duration. (F) TrkC KI mice took longer than WT mice to enter the lit compartment (left) but then spent equivalent time in the lit compartment (right). Student’s t tests, *P (male) = 0.048 and *P (female) = 0.040 in latency to enter lit compartment, and P (male) = 0.21 and P (female) = 0.57 in total duration in lit compartment. n = 12 WT male, 12 KI male, 13 WT female and 14 KI female littermate mice for open-field and elevated plus maze tests, n = 8 WT males, 8 KI males, 9 WT females and 10 KI females for the other tests. Data are presented as mean ± SEM. ns not significant. Source data are available online for this figure.

References

    1. Abrahams BS, Arking DE, Campbell DB, Mefford HC, Morrow EM, Weiss LA, Menashe I, Wadkins T, Banerjee-Basu S, Packer A (2013) SFARI Gene 2.0: a community-driven knowledgebase for the autism spectrum disorders (ASDs). Mol Autism 4:36 - PMC - PubMed
    1. Alonso P, Gratacos M, Menchon JM, Segalas C, Gonzalez JR, Labad J, Bayes M, Real E, de Cid R, Pertusa A et al (2008) Genetic susceptibility to obsessive-compulsive hoarding: the contribution of neurotrophic tyrosine kinase receptor type 3 gene. Genes Brain Behav 7:778–785 - PubMed
    1. Ammendrup-Johnsen I, Naito Y, Craig AM, Takahashi H (2015) Neurotrophin-3 enhances the synaptic organizing function of TrkC-protein tyrosine phosphatase sigma in rat hippocampal neurons. J Neurosci 35:12425–12431 - PMC - PubMed
    1. Armengol L, Gratacos M, Pujana MA, Ribases M, Martin-Santos R, Estivill X (2002) 5′ UTR-region SNP in the NTRK3 gene is associated with panic disorder. Mol Psychiatry 7:928–930 - PubMed
    1. Ashburner M, Ball CA, Blake JA, Botstein D, Butler H, Cherry JM, Davis AP, Dolinski K, Dwight SS, Eppig JT et al (2000) Gene ontology: tool for the unification of biology. The Gene Ontology Consortium. Nat Genet 25:25–29 - PMC - PubMed

Substances

LinkOut - more resources