. 2024 Sep 27;22(1):66.
doi: 10.1186/s12960-024-00949-2.

Health workforce needs in Malawi: analysis of the Thanzi La Onse integrated epidemiological model of care

Affiliations

Health workforce needs in Malawi: analysis of the Thanzi La Onse integrated epidemiological model of care

Bingling She et al. Hum Resour Health. .

Abstract

Background: To make the best use of health resources, it is crucial to understand the healthcare needs of a population-including how needs will evolve and respond to changing epidemiological context and patient behaviour-and how this compares to the capabilities to deliver healthcare with the existing workforce. Existing approaches to planning either rely on using observed healthcare demand from a fixed historical period or using models to estimate healthcare needs within a narrow domain (e.g., a specific disease area or health programme). A new data-grounded modelling method is proposed by which healthcare needs and the capabilities of the healthcare workforce can be compared and analysed under a range of scenarios: in particular, when there is much greater propensity for healthcare seeking.

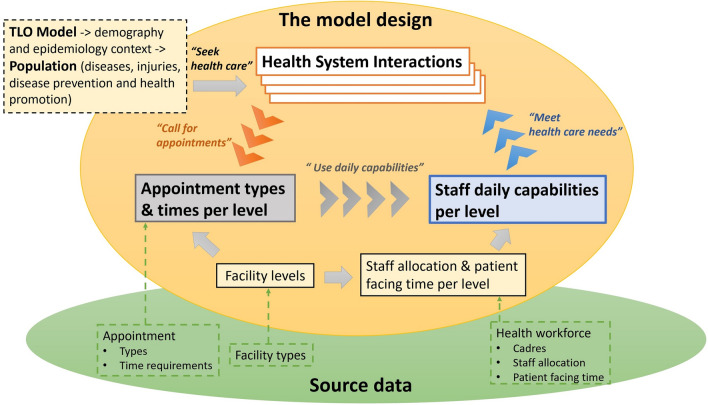
Methods: A model representation of the healthcare workforce, one that formalises how the time of the different cadres is drawn into the provision of units of healthcare, was integrated with an individual-based epidemiological model-the Thanzi La Onse model-that represents mechanistically the development of disease and ill-health and patients' healthcare seeking behaviour. The model was applied in Malawi using routinely available data and the estimates of the volume of health service delivered were tested against officially recorded data. Model estimates of the "time needed" and "time available" for each cadre were compared under different assumptions for whether vacant (or established) posts are filled and healthcare seeking behaviour.

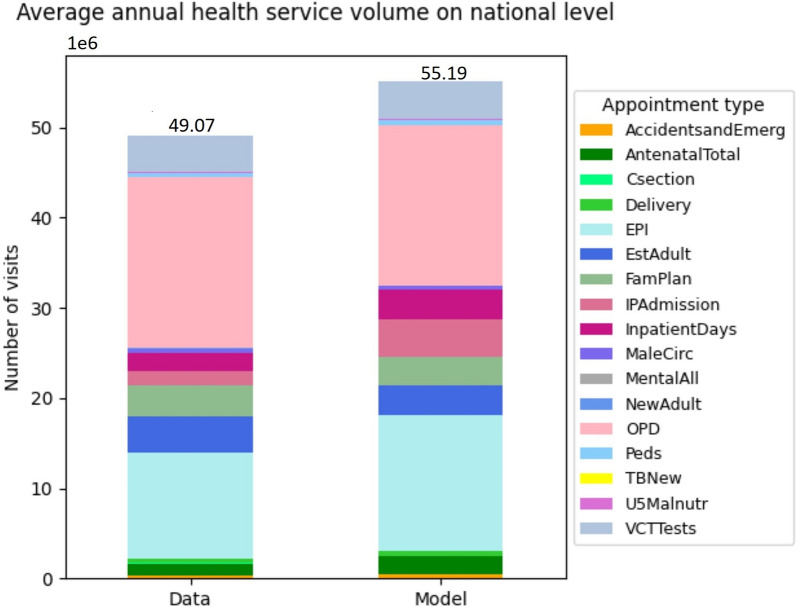
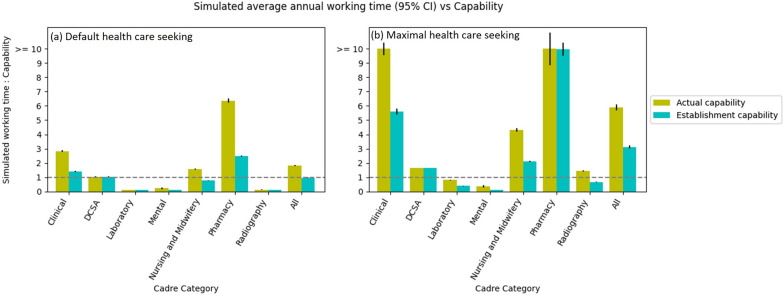
Results: The model estimates of volume of each type of service delivered were in good agreement with the available data. The "time needed" for the healthcare workforce greatly exceeded the "time available" (overall by 1.82-fold), especially for pharmacists (6.37-fold) and clinicians (2.83-fold). This discrepancy would be largely mitigated if all vacant posts were filled, but the large discrepancy would remain for pharmacists (2.49-fold). However, if all of those becoming ill did seek care immediately, the "time needed" would increase dramatically and exceed "time supply" (2.11-fold for nurses and midwives, 5.60-fold for clinicians, 9.98-fold for pharmacists) even when there were no vacant positions.

Conclusions: The results suggest that services are being delivered in less time on average than they should be, or that healthcare workers are working more time than contracted, or a combination of the two. Moreover, the analysis shows that the healthcare system could become overwhelmed if patients were more likely to seek care. It is not yet known what the health consequences of such changes would be but this new model provides-for the first time-a means to examine such questions.

Keywords: Health care needs; Health services; Health system interactions; Healthcare workforce; Model design.


Conflict of interest statement

The authors declare that they have no competing interests.

Figures

Fig. 1
Fig. 1
Model design for healthcare workforce capability
Fig. 2
Fig. 2
Mapping cadre category and appointment category according to appointment time requirement. This diagram demonstrates the required health worker cadres to deliver each health service type at each facility level. For example, the top flow shows that DCSA cadre is required to deliver the health service of consultancy with DCSA at level 0. Note that Nutrition cadre category is not presented because of no appointment requiring their working time in the Data Source. These Sankey diagrams were plotted using the FLOWEAVER package [36]
Fig. 3
Fig. 3
Actual scenario workforce allocation and daily capabilities. a Staff counts per cadre category by district, b daily minutes available per cadre category by district, c staff counts per cadre category by level, d daily minutes available per cadre category by level. See the Actual Scenario workforce allocation and daily capabilities per district-level in Additional file 1: Sect. 5
Fig. 4
Fig. 4
Illustration of exemplar appointment types being drawn upon by HSIs at facility level 1a. The HSIs on the right are named in the format of “Disease module_Treatment type”: for example, “HIV_Test” means the health system interaction event of test for HIV. Full details of HSIs can be found in the TLO documentation [24, 37]. The width of each flow is proportional to the number of calls for each Appointment Type in the model
Fig. 5
Fig. 5
Simulated vs officially recorded annual average health service volume on national level 2015–2019. Refer to Table 3 above and the table in Additional file 1: Sect. 3 for descriptions of appointment types. The health service volume for each appointment type is measured by number of visits or cases or frequencies
Fig. 6
Fig. 6
Comparison of simulated average annual working time and actual/establishment capabilities per cadre category in two health care seeking scenarios. The annual working time is the annual number of appointments times the appointment time requirements. The line of “simulated working time: capability” = 1 means the usage of healthcare workers’ patient facing time in the model perfectly matches their capabilities. Note that since the data for the ConWithDCSA appointment time requirement are not available, in the simulation, it is assumed such a value (i.e. 20 minutes for DCSA per appointment) that the simulated total working time can well match the Actual capabilities of DCSA; and that the extra capabilities of Laboratory and Radiography cadres may be due to that cancer modules in TLO Model have not fully represented the HSIs of laboratory and radiography services such as diagnostic test and screening on one hand and that the laboratory and radiography appointment time requirements might have been underestimated in data source on the other hand. Also note that Nutrition and Dental cadres are not analysed because of no relevant service data
Fig. 7
Fig. 7
Simulated annual working time flow per cadre category in two health care seeking scenarios. The overall height of each diagram reflects the annual total working time required in each scenario, and the width of each flow reflects the proportion of working time required for each cadre by each disease module. The total working time in Maximal health care seeking scenario (7.14 × 10^9 minutes per year) is approximately 3.23 times of the Default scenario (2.21 × 10^9 minutes per year). Note that each disease module here represents a group of relevant diagnosis and treatment HSI events. Particularly, the “FirstAttendance” module represents HSI events that capture the first contact of a person seeking health care from the healthcare system, and the “Inpatient” module represents HSIs that specify the needs of inpatient care

References

    1. Hauck K, Morton A, Chalkidou K, Chi Y-L, Culyer A, Levin C, et al. How can we evaluate the cost-effectiveness of health system strengthening? A typology and illustrations. Soc Sci Med. 2019;220:141–9. - PMC - PubMed
    1. Government of Malawi. Malawi human resources for health strategic plan 2018–2022. New Delhi: Government of Malawi: Ministry of Health and Population; 2018.
    1. Berman L, Prust ML, Maungena Mononga A, Boko P, Magombo M, Teshome M, et al. Using modeling and scenario analysis to support evidence-based health workforce strategic planning in Malawi. Hum Resour Health. 2022;20(1):1–14. - PMC - PubMed
    1. Kunjumen T, Okech M, Diallo K, Mcquide P, Zapata T, Campbell J. Global experiences in health workforce policy, planning and management using the Workload Indicators of Staffing Need (WISN) method, and way forward. BioMed Central. 2022. 10.1186/s12960-021-00695-9. - PMC - PubMed
    1. Mziray E, Gorgens M, McCauley P. Analysis of human resources for health in Malawi. Washington, DC: World Bank; 2017.

Publication types

LinkOut - more resources