. 2024 Sep 27;21(1):240.
doi: 10.1186/s12974-024-03221-5.

Modulation of cannabinoid receptor 2 alters neuroinflammation and reduces formation of alpha-synuclein aggregates in a rat model of nigral synucleinopathy

Affiliations

Modulation of cannabinoid receptor 2 alters neuroinflammation and reduces formation of alpha-synuclein aggregates in a rat model of nigral synucleinopathy

Valerie Joers et al. J Neuroinflammation. .

Abstract

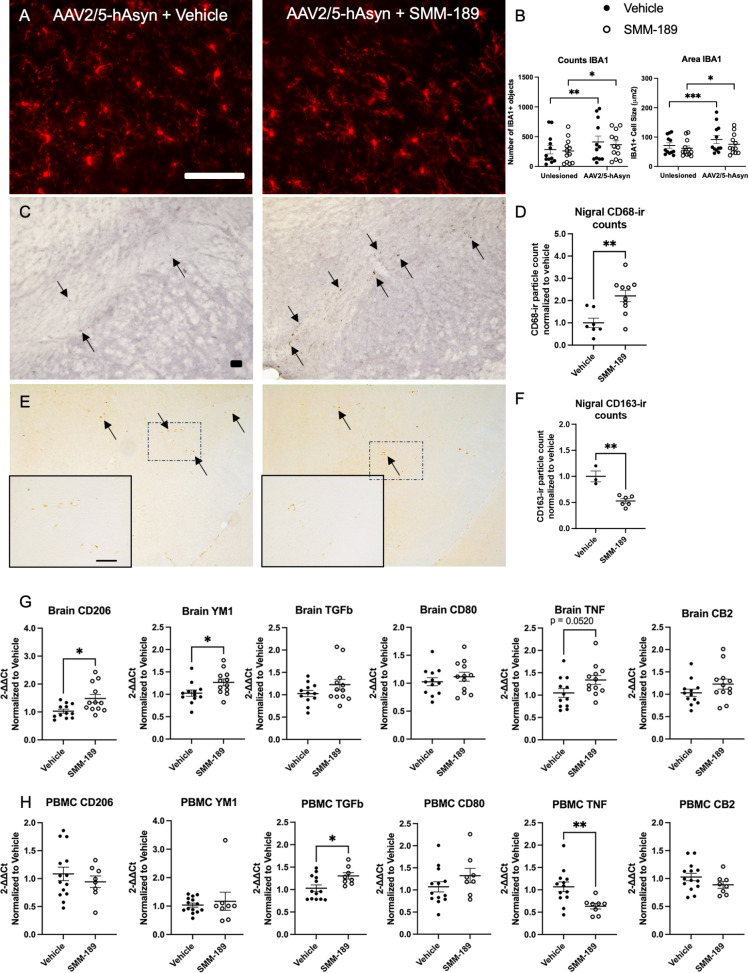
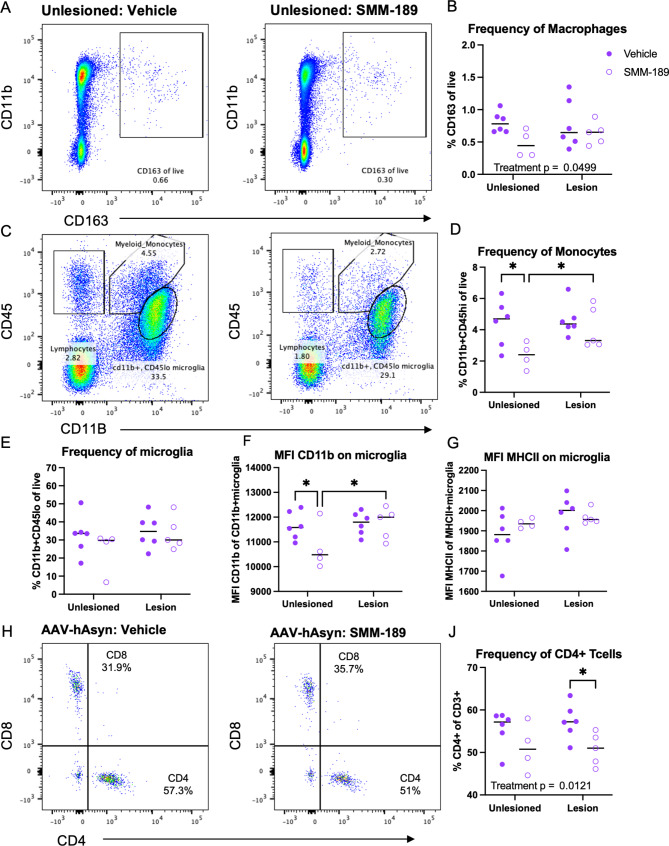
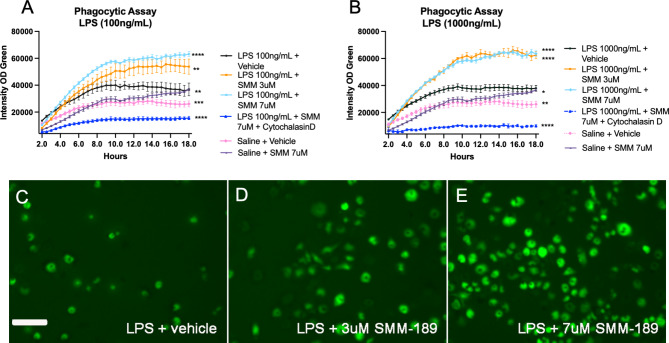
Research into the disequilibrium of microglial phenotypes has become an area of intense focus in neurodegenerative disease as a potential mechanism that contributes to chronic neuroinflammation and neuronal loss in Parkinson's disease (PD). There is growing evidence that neuroinflammation accompanies and may promote progression of alpha-synuclein (Asyn)-induced nigral dopaminergic (DA) degeneration. From a therapeutic perspective, development of immunomodulatory strategies that dampen overproduction of pro-inflammatory cytokines from chronically activated immune cells and induce a pro-phagocytic phenotype is expected to promote Asyn removal and protect vulnerable neurons. Cannabinoid receptor-2 (CB2) is highly expressed on activated microglia and peripheral immune cells, is upregulated in the substantia nigra of individuals with PD and in mouse models of nigral degeneration. Furthermore, modulation of CB2 protects against rotenone-induced nigral degeneration; however, CB2 has not been pharmacologically and selectively targeted in an Asyn model of PD. Here, we report that 7 weeks of peripheral administration of CB2 inverse agonist SMM-189 reduced phosphorylated (pSer129) Asyn in the substantia nigra compared to vehicle treatment. Additionally, SMM-189 delayed Asyn-induced immune cell infiltration into the brain as determined by flow cytometry, increased CD68 protein expression, and elevated wound-healing-immune-mediator gene expression. Additionally, peripheral immune cells increased wound-healing non-classical monocytes and decreased pro-inflammatory classical monocytes. In vitro analysis of RAW264.7 macrophages treated with lipopolysaccharide (LPS) and SMM-189 revealed increased phagocytosis as measured by the uptake of fluorescence of pHrodo E. coli bioparticles. Together, results suggest that targeting CB2 with SMM-189 skews immune cell function toward a phagocytic phenotype and reduces toxic aggregated species of Asyn. Our novel findings demonstrate that CB2 may be a target to modulate inflammatory and immune responses in proteinopathies.

Keywords: Alpha-synuclein; Cannabinoid receptor-2; Microglia phenotype; Parkinson’s disease.


Conflict of interest statement

The authors declare no competing interests.

Figures

Fig. 1
Fig. 1
Experimental design and outcome measures. Rats were injected unilaterally with AAV2/5-human WT alpha-synuclein (low cohort: 2.9–4.3E11 vg/mL) using stereotaxic coordinates to target the substantia nigra and one week later were dosed daily with peripheral injections of SMM-189, a novel CB2 inverse agonist (6 mg/kg, ip) or vehicle for 7 remaining weeks until perfusion. Blood was collected at baseline and every 4 weeks to measure plasma drug levels. Endpoint brain and PBMCs were evaluated for changes in inflammatory pathway gene expression using qPCR and the midbrain was subjected to immunohistochemistry to evaluate synuclein pathology and immune cells. An additional cohort of rats followed similar experimental design (high cohort: 4.6E12 vg/mL) to evaluate immune cells in blood (PBMCs) and brain by flow cytometry. Blood was collected at baseline, 4 weeks and 8 weeks to measure plasma drug levels and immunophenotype by flow cytometry and brains collected at either 4 or 8 weeks to immunophenotype by flow cytometry
Fig. 2
Fig. 2
Modulation of CB2 with SMM-189 decreases accumulation of pSer129 alpha-synuclein in the lesioned nigra. A) Representative nigral images of pSer129 Asyn (scale bar = 250 μm) and B) quantification in nigra of AAV injected rats treated with SMM-189 normalized to vehicle showed reduced pSer129 Asyn compared to vehicle. C) Representative nigral images of proteinase K-resistant Asyn and D) optical density quantification showed reduced intensity of proteinase K-insoluble Asyn. E) Representative nigral images of total human Asyn. F) Total human Asyn did not differ between groups when evaluating the optical density of Asyn-ir within the lesioned nigra normalized by vehicle. G) Representative western immunoblots of pSer129 and total human Asyn from striatal lysates and their corresponding total protein used for normalization. H) Quantification of western bands of hemispheres ipsilateral to the AAV2/5-hAsyn injections demonstrate that pSer129 was significantly reduced following SMM-189 treatment, but human Asyn was not different between treatments. *p < 0.05, **p < 0.01
Fig. 3
Fig. 3
Modulation of CB2 with SMM-189 modifies central neuroinflammation. A) Representative microphotographs of midline midbrain sections immunostained for IBA1. B) Quantification of IBA1 + immunofluorescent staining reveals significant lesion effect in both vehicle- and SMM-189-treated rats based on count and area for each treatment group. C) Representative images of midbrain sections immunostained for CD68. Arrows highlight the CD68 + cells included in the quantification. D) CD68 quantification using ImageJ particle counting and normalized to vehicle found significant increases in SMM-189 compared to vehicle-treated rats. E) Representative microphotographs of nigral sections immunostained for CD163 with a magnified insert for each treatment. Arrows identify the CD163 + staining that was included in quantification. F) CD163 quantification within the lesioned nigra was decreased by SMM-189 treatment. G) The mRNA expression of inflammatory cytokines CD206, YM1, TGFβ, CD80, TNF, CB2 are displayed for both frontal cortex or brain H) and PBMCs. Relative PBMC mRNA abundance was normalized to GAPDH, frontal cortex to HPRT1. Scale bars = 100 μm. *p < 0.05, **p < 0.01, ***p < 0.001
Fig. 4
Fig. 4
Modulation of CB2 with SMM-189 globally reduces macrophages and infiltrating monocytes and CD4 T lymphocytes at 4 weeks. Brain immune cells from high cohort rats were isolated from lesioned (+ AAV-human Asyn) and unlesioned (-AAV-human Asyn) rat hemispheres at 4 weeks and flow cytometry analysis conducted to identify monocyte, lymphocyte and microglia populations from CD45 and CD11b expression and further gated into more distinct populations. Macrophage populations (CD163 + CD11b+) were identified from live cells (see Figure S1). A) Representative dot blots of CD163 + macrophages in the unlesioned hemisphere of a vehicle and SMM-189-treated rat at 4 weeks. B) Quantification of CD163 + reveals a global reduction of macrophages from SMM-189 treatment. C) Representative dot blots of CD45 and CD11b in the unlesioned hemisphere of a vehicle and SMM-189-treated rat. D) Quantification of the monocyte population as a frequency of all live cells (CD45hiCD11b+). E) Quantification of microglia (CD45loCD11b+), and microglia MFI of F) CD11b and G) MHCII. H) Representative dot blots of CD3 + lymphocytes stratified by CD4 and CD8 populations in the lesion hemisphere of a vehicle and SMM-189-treated rat. I) Quantification of CD4-expressing T lymphocytes. *p < 0.05
Fig. 5
Fig. 5
Modulation of CB2 with SMM-189 promotes innate immune cell activation and altered infiltration of T lymphocytes in the brain at 8 weeks. Brain immune cells from high cohort rats were isolated from lesioned- (+ AAV-human Asyn) and unlesioned (-AAV-human Asyn) hemispheres at 8 weeks and flow cytometry analysis conducted to identify monocyte, lymphocyte and microglia populations using CD45 and CD11b expression and further gated into more distinct populations (see Figure S1). A) Representative dot blots of CD163 + macrophages in the unlesioned hemisphere of a vehicle and SMM-189-treated rat at 8 weeks. B) Quantification of monocyte (CD45hiCD11b+) and C) MHCII-expressing classical monocyte (MHCII + CD43-) frequencies. D) Analysis of microglia (CD45loCD11b+) and microglia MFI of E) MHCII F) CD172a and G) CD11b. H) Dot blots of CD3 + lymphocytes stratified by CD4 and CD8 populations in the lesion hemisphere of a vehicle and SMM-189-treated rat at 8 weeks. I) Quantification of CD4-expressing and J) CD8-expressing T cells. *p < 0.05, **p < 0.01
Fig. 6
Fig. 6
Modulation of CB2 with SMM-189 skews PBMC phenotype and increases frequency of circulating wound-healing non-classical monocytes. A) PBMCs were isolated from whole blood at baseline, 4 and 8 weeks after AAV2/5-hAsyn injections from rats in the high cohort. SMM-189 treatment resulted in no change in frequency of His48 + CD43 + non-classical monocytes, but B) decreased circulating His48 + classical monocytes (CD43 - CD11b + CD172a+) at 4 and 8 weeks compared to vehicle treatment. C) Mean fluorescent intensity (MFI) of MHCII on His48 + classical monocytes was elevated on PBMCs from SMM-189-treated rats compared to vehicle at 4 weeks. D) Parent gate CD43 + non-classical monocytes demonstrated increased frequency of CD43 + non-classical monocytes, but E) no changes in parent gate CD43- classical monocytes. F) Frequency of granulocytes as defined by CD3- and granularity (SSC) were decreased at 8 weeks from SMM-189 treatment compared to vehicle (F). *p < 0.05
Fig. 7
Fig. 7
Modulation of CB2 with SMM-189 increases RAW264.7 macrophage phagocytosis after an inflammagen challenge. A) Quantification of GFP fluorescent intensity in RAW264.7 macrophage cultures challenged with either 100ng/mL or B) 1000 ng/mL lipopolysaccharide and pre-treated with SMM-189 or vehicle and 24 h later incubated with pHrodo green E. coli. Treatments are analyzed across time using a one-way ANOVA with Dunnett’s multiple comparisons test. Data are representative of 2 separate experiments. C) Representative GFP images of fluorescent pHrodo green E. coli at 12 h for 100ng/mL LPS + vehicle, D) 100ng/mL LPS + 3 μm SMM-189, E) 100ng/mL LPS + 7 μm SMM-189 conditions. *p < 0.05, **p < 0.01, ***p < 0.001, ****p < 0.0001

Update of

References

    1. Uriarte Huarte O, Kyriakis D, Heurtaux T, Pires-Afonso Y, Grzyb K, Halder R, et al. Single-cell transcriptomics and in situ morphological analyses reveal Microglia Heterogeneity across the Nigrostriatal Pathway. Front Immunol. 2021;12:639613. - PMC - PubMed
    1. Paolicelli RC, Sierra A, Stevens B, Tremblay ME, Aguzzi A, Ajami B, et al. Microglia states and nomenclature: a field at its crossroads. Neuron. 2022;110(21):3458–83. - PMC - PubMed
    1. Smajic S, Prada-Medina CA, Landoulsi Z, Ghelfi J, Delcambre S, Dietrich C, et al. Single-cell sequencing of human midbrain reveals glial activation and a Parkinson-specific neuronal state. Brain. 2022;145(3):964–78. - PMC - PubMed
    1. Mastroeni D, Nolz J, Sekar S, Delvaux E, Serrano G, Cuyugan L, et al. Laser-captured microglia in the Alzheimer’s and Parkinson’s brain reveal unique regional expression profiles and suggest a potential role for hepatitis B in the Alzheimer’s brain. Neurobiol Aging. 2018;63:12–21. - PMC - PubMed
    1. Joers V, Tansey MG, Mulas G, Carta AR. Microglial phenotypes in Parkinson’s disease and animal models of the disease. Prog Neurobiol. 2017;155:57–75. - PMC - PubMed

LinkOut - more resources