Unleashing the full potential of digital outcome measures in clinical trials: eight questions that need attention
- PMID: 39334286
- PMCID: PMC11438362
- DOI: 10.1186/s12916-024-03590-x
Unleashing the full potential of digital outcome measures in clinical trials: eight questions that need attention
Abstract
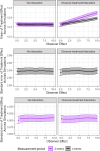
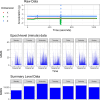
The use of digital health technologies to measure outcomes in clinical trials opens new opportunities as well as methodological challenges. Digital outcome measures may provide more sensitive and higher-frequency measurements but pose vital statistical challenges around how such outcomes should be defined and validated and how trials incorporating digital outcome measures should be designed and analysed. This article presents eight methodological questions, exploring issues such as the length of measurement period, choice of summary statistic and definition and handling of missing data as well as the potential for new estimands and new analyses to leverage the time series data from digital devices. The impact of key issues highlighted by the eight questions on a primary analysis of a trial are illustrated through a simulation study based on the 2019 Bellerophon INOPulse trial which had time spent in MVPA as a digital outcome measure. These eight questions present broad areas where methodological guidance is needed to enable wider uptake of digital outcome measures in trials.
Keywords: Clinical trial; Digital endpoints; Digital health technology; Digital outcome measures; Validation.
© 2024. The Author(s).
Conflict of interest statement
SSV is on the advisory board for PhaseV (unrelated to this work).
Figures


References
-
- Harris T, Kerry SM, Limb ES, Victor CR, Iliffe S, Ussher M, et al. Effect of a primary care walking intervention with and without nurse support on physical activity levels in 45- to 75-year-olds: the Pedometer And Consultation Evaluation (PACE-UP) cluster randomised clinical trial. PLoS Med. 2017;14(1):1–19. 10.1371/journal.pmed.1002210. - DOI - PMC - PubMed
-
- Harris T, Kerry SM, Limb ES, Furness C, Wahlich C, Victor CR, et al. Physical activity levels in adults and older adults 3–4 years after pedometer-based walking interventions: long-term follow-up of participants from two randomised controlled trials in UK primary care. PLoS Med. 2018;15(3):e1002526. - DOI - PMC - PubMed
-
- Kruizinga MD, van der Heide N, Moll A, Zhuparris A, Yavuz Y, de Kam ML, et al. Towards remote monitoring in pediatric care and clinical trials-Tolerability, repeatability and reference values of candidate digital endpoints derived from physical activity, heart rate and sleep in healthy children. PLoS ONE. 2021;16:1–17. 10.1371/journal.pone.0244877. - DOI - PMC - PubMed
-
- Robertson L, Newman J, Clayton S, Ferguson M, Pepke-Zaba J, Cannon J, et al. The Digital 1-Minute Walk Test: a new patient-centered cardiorespiratory endpoint. Am J Respir Crit Care Med. 2024. 10.1164/rccm.202310-1855LE. - PubMed
Publication types
MeSH terms
Grants and funding
LinkOut - more resources
Full Text Sources
Medical

