Survival advantage of native and engineered T cells is acquired by mitochondrial transfer from mesenchymal stem cells
- PMID: 39334383
- PMCID: PMC11429672
- DOI: 10.1186/s12967-024-05627-4
Survival advantage of native and engineered T cells is acquired by mitochondrial transfer from mesenchymal stem cells
Abstract
Background: Apoptosis, a form of programmed cell death, is critical for the development and homeostasis of the immune system. Chimeric antigen receptor T (CAR-T) cell therapy, approved for hematologic cancers, retains several limitations and challenges associated with ex vivo manipulation, including CAR T-cell susceptibility to apoptosis. Therefore, strategies to improve T-cell survival and persistence are required. Mesenchymal stem/stromal cells (MSCs) exhibit immunoregulatory and tissue-restoring potential. We have previously shown that the transfer of umbilical cord MSC (UC-MSC)-derived mitochondrial (MitoT) prompts the genetic reprogramming of CD3+ T cells towards a Treg cell lineage. The potency of T cells plays an important role in effective immunotherapy, underscoring the need for improving their metabolic fitness. In the present work, we evaluate the effect of MitoT on apoptotis of native T lymphocytes and engineered CAR-T cells.
Methods: We used a cell-free approach using artificial MitoT (Mitoception) of UC-MSC derived MT to peripheral blood mononuclear cells (PBMCs) followed by RNA-seq analysis of CD3+ MitoTpos and MitoTneg sorted cells. Target cell apoptosis was induced with Staurosporine (STS), and cell viability was evaluated with Annexin V/7AAD and TUNEL assays. Changes in apoptotic regulators were assessed by flow cytometry, western blot, and qRT-PCR. The effect of MitoT on 19BBz CAR T-cell apoptosis in response to electroporation with a non-viral transposon-based vector was assessed with Annexin V/7AAD.
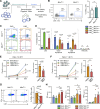
Results: Gene expression related to apoptosis, cell death and/or responses to different stimuli was modified in CD3+ T cells after Mitoception. CD3+MitoTpos cells were resistant to STS-induced apoptosis compared to MitoTneg cells, showing a decreased percentage in apoptotic T cells as well as in TUNEL+ cells. Additionally, MitoT prevented the STS-induced collapse of the mitochondrial membrane potential (MMP) levels, decreased caspase-3 cleavage, increased BCL2 transcript levels and BCL-2-related BARD1 expression in FACS-sorted CD3+ T cells. Furthermore, UC-MSC-derived MitoT reduced both early and late apoptosis in CAR-T cells following electroporation, and exhibited an increasing trend in cytotoxic activity levels.
Conclusions: Artificial MitoT prevents STS-induced apoptosis of human CD3+ T cells by interfering with the caspase pathway. Furthermore, we observed that MitoT confers protection to apoptosis induced by electroporation in MitoTpos CAR T-engineered cells, potentially improving their metabolic fitness and resistance to environmental stress. These results widen the physiological perspective of organelle-based therapies in immune conditions while offering potential avenues to enhance CAR-T treatment outcomes where their viability is compromised.
Keywords: Chimeric antigen receptor T (CAR-T) cells; Induced-apoptosis; Mesenchymal stromal/stem cells; Mitochondria transfer.
© 2024. The Author(s).
Conflict of interest statement
Maroun Khoury is the CEO and CSO of Cells for Cells and Regenero. Angela Court received stipend from Regenero. The remaining authors declare that the research was conducted in the absence of any commercial or financial relationships that could be construed as a potential conflict of interest.
Figures


Similar articles
-
Mitochondrial transfer balances cell redox, energy and metabolic homeostasis in the osteoarthritic chondrocyte preserving cartilage integrity.Theranostics. 2024 Oct 7;14(17):6471-6486. doi: 10.7150/thno.96723. eCollection 2024. Theranostics. 2024. PMID: 39479450 Free PMC article.
-
Specifically Enhanced Immunosuppression of B Cells with Chimeric Antigen Receptors Modify Mesenchymal Stem Cells.Stem Cells Dev. 2025 Jun;34(11-12):249-257. doi: 10.1089/scd.2025.0021. Epub 2025 May 15. Stem Cells Dev. 2025. PMID: 40370257
-
Mesenchymal stem cell suppresses the efficacy of CAR-T toward killing lymphoma cells by modulating the microenvironment through stanniocalcin-1.Elife. 2023 Feb 13;12:e82934. doi: 10.7554/eLife.82934. Elife. 2023. PMID: 36779699 Free PMC article.
-
Musculoskeletal Progenitor/Stromal Cell-Derived Mitochondria Modulate Cell Differentiation and Therapeutical Function.Front Immunol. 2021 Mar 8;12:606781. doi: 10.3389/fimmu.2021.606781. eCollection 2021. Front Immunol. 2021. PMID: 33763061 Free PMC article. Review.
-
Chimeric Antigen Receptor T Cell Therapy for Pediatric B-ALL: Narrowing the Gap Between Early and Long-Term Outcomes.Front Immunol. 2020 Aug 11;11:1985. doi: 10.3389/fimmu.2020.01985. eCollection 2020. Front Immunol. 2020. PMID: 32849662 Free PMC article. Review.
Cited by
-
Mesenchymal stem cells: A new strategy for the treatment of femoral head necrosis.Regen Ther. 2025 Jul 23;30:421-429. doi: 10.1016/j.reth.2025.07.008. eCollection 2025 Dec. Regen Ther. 2025. PMID: 40735198 Free PMC article. Review.
-
From powerhouse to modulator: regulating immune system responses through intracellular mitochondrial transfer.Cell Commun Signal. 2025 May 20;23(1):232. doi: 10.1186/s12964-025-02237-5. Cell Commun Signal. 2025. PMID: 40394666 Free PMC article. Review.
-
Mitochondrial Transfer Between Cancer and T Cells: Implications for Immune Evasion.Antioxidants (Basel). 2025 Aug 18;14(8):1008. doi: 10.3390/antiox14081008. Antioxidants (Basel). 2025. PMID: 40867904 Free PMC article. Review.
-
Advances in brain remodeling, stem cell therapies, and translational barriers in stroke and brain aging.Biogerontology. 2025 Jul 11;26(4):143. doi: 10.1007/s10522-025-10282-3. Biogerontology. 2025. PMID: 40643679 Free PMC article. Review.
-
Recommendations for mitochondria transfer and transplantation nomenclature and characterization.Nat Metab. 2025 Jan;7(1):53-67. doi: 10.1038/s42255-024-01200-x. Epub 2025 Jan 16. Nat Metab. 2025. PMID: 39820558 Review.
References
-
- Taylor RC, Cullen SP, Martin SJ. Apoptosis: controlled demolition at the cellular level. Nat Rev Mol Cell Biol. 2008;9:231–41. - PubMed
-
- Opferman JT. Apoptosis in the development of the immune system. Cell Death Differ. 2008;15:234–42. - PubMed
-
- Rathmell JC, Thompson CB. Pathways of apoptosis in lymphocyte development, homeostasis, and disease. Cell. 2002;109(Suppl):S97–107. - PubMed
MeSH terms
Substances
Grants and funding
LinkOut - more resources
Full Text Sources
Research Materials

