. 2024 Sep 27;21(1):78.
doi: 10.1186/s12987-024-00576-y.

Human iPSC-derived pericyte-like cells carrying APP Swedish mutation overproduce beta-amyloid and induce cerebral amyloid angiopathy-like changes

Affiliations

Human iPSC-derived pericyte-like cells carrying APP Swedish mutation overproduce beta-amyloid and induce cerebral amyloid angiopathy-like changes

Ying-Chieh Wu et al. Fluids Barriers CNS. .

Abstract

Background: Patients with Alzheimer's disease (AD) frequently present with cerebral amyloid angiopathy (CAA), characterized by the accumulation of beta-amyloid (Aβ) within the cerebral blood vessels, leading to cerebrovascular dysfunction. Pericytes, which wrap around vascular capillaries, are crucial for regulating cerebral blood flow, angiogenesis, and vessel stability. Despite the known impact of vascular dysfunction on the progression of neurodegenerative diseases, the specific role of pericytes in AD pathology remains to be elucidated.

Methods: To explore this, we generated pericyte-like cells from human induced pluripotent stem cells (iPSCs) harboring the Swedish mutation in the amyloid precursor protein (APPswe) along with cells from healthy controls. We initially verified the expression of classic pericyte markers in these cells. Subsequent functional assessments, including permeability, tube formation, and contraction assays, were conducted to evaluate the functionality of both the APPswe and control cells. Additionally, bulk RNA sequencing was utilized to compare the transcriptional profiles between the two groups.

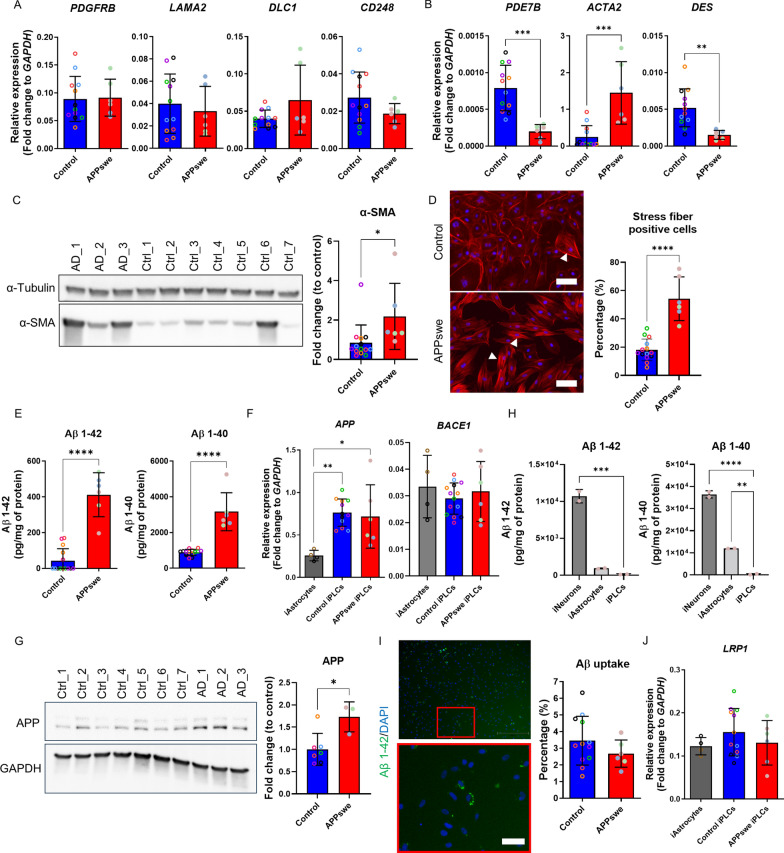
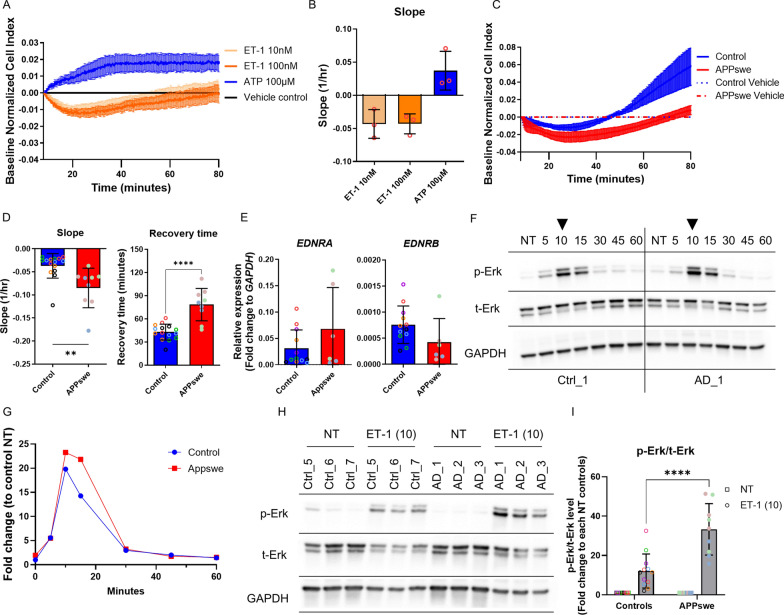
Results: Our study reveals that iPSC-derived pericyte-like cells (iPLCs) can produce Aβ peptides. Notably, cells with the APPswe mutation secreted Aβ1-42 at levels ten-fold higher than those of control cells. The APPswe iPLCs also demonstrated a reduced ability to support angiogenesis and maintain barrier integrity, exhibited a prolonged contractile response, and produced elevated levels of pro-inflammatory cytokines following inflammatory stimulation. These functional changes in APPswe iPLCs correspond with transcriptional upregulation in genes related to actin cytoskeleton and extracellular matrix organization.

Conclusions: Our findings indicate that the APPswe mutation in iPLCs mimics several aspects of CAA pathology in vitro, suggesting that our iPSC-based vascular cell model could serve as an effective platform for drug discovery aimed to ameliorate vascular dysfunction in AD.

Keywords: Alzheimer’s disease; Cerebral amyloid angiopathy; Pericytes; Vascular dysfunction; iPSCs.


Conflict of interest statement

The authors declare no competing interests.

Figures

Fig. 1
Fig. 1
Differentiation and characterization of iPSC-derived pericyte-like cells (iPLCs). A Immunostaining for PDGFRβ, α-SMA, and NG2 in day 21 iPLCs derived from control lines. Nuclei are stained with DAPI. Scale bars, 100 μm. B Comparison of relative gene expression levels for PDGFRB, DES, LAMA2, DLC1, and PDE7B among iPLCs, iECs, iAstrocytes, and iPSCs. Expression levels are shown as fold change relative to GAPDH. C Relative gene expression levels of LAMA2, PDE7B, CD248, DES, and ACTA2 in iPLCs across Day 7, 21, 31, and 50. Expression levels are shown as fold change relative to GAPDH. D 2D tube formation images showing iECs alone, iPLCs alone, iECs exposed to angiogenic cocktail or iPLC-conditioned medium (CM), and iECs co-cultured with iPLCs. Scale bars, 300 μm. E Illustration of master segments (red arrows) and mesh structures (blue polygon). F Statistical analysis of the number of master segments, meshes count, and meshes area. G Schematic of the experimental setup for permeability assays. H Immunostaining of CD31 and α-SMA on iECs and iPLCs cultured on Transwell inserts. Nuclei are stained with DAPI. Scale bars, 100 μm. I Endothelial permeability coefficients (Pe) for 4 kDa and 70 kDa fluorescently labeled dextran across iEC only, iEC bilayers, iECs in co-culture with iPLCs cultures and empty well without cells on inserts as control. J–K Western blots for ZO-1 and Occludin from two experimental batches, analyzing iEC-only, iPLC-only, iEC bilayers, and iECs in co-culture with iPLCs. GAPDH served as a loading control (J). Statistical analysis depicting fold changes in ZO-1 and Occludin expression levels relative to iEC-only controls for each batch (K). The dots indicate the average values of technical replicates for each biological sample (lines, batches), with the color of the dots representing different lines. Except in (I), where the dots from empty well represent the data from one well of one experimental batch. The data are presented as mean ± SD. Statistical analysis utilized one-way ANOVA with Dunnett's multiple comparison test, with significance denoted: *p < 0.05, **p < 0.01,***p < 0.001 and ****p < 0.0001
Fig. 2
Fig. 2
APPswe iPLCs displayed altered expression of pericyte markers, α-SMA stress fibers, and amyloid beta pathology. AB Comparative analysis of relative expression levels of PDGFRB, LAMA2, DLC1, CD248 (A), and PDE7B, ACTA2, DES B between control and APPswe iPLCs. Expression levels are shown as fold change relative to GAPDH. C Representative blots for α-SMA in control and APPswe iPLCs, using α-tubulin as a loading control. D Immunostaining of α-SMA in control and APPswe iPLCs, with nuclei stained by DAPI. Scale bars, 100 μm. The percentage of cells with stress fibers was quantified using ImageJ's threshold function to measure cell coverage. E Aβ1–42 and Aβ1–40 levels in media from control and APPswe iPLCs, normalized to total protein content. F Relative gene expression levels of APP and BACE1 in control and APPswe iPLCs, as well as iAstrocytes, quantified as fold changes relative to GAPDH. G Western blot for APP in control and APPswe iPLCs,with GAPDH as the loading control. H Aβ1–42 and Aβ1–40 levels measured in media from iPSC-neurons, astrocytes, and iPLCs derived from an APPswe individual. The obtained values were normalized to total protein content. I Images of iPLCs internalizing HiLyte 488-labeled Aβ1–42, displayed at 4 × and 10 × magnifications, scale bar 100 μm (10x). The percentage of cells internalizing Aβ1–42 was quantified using 10 × images. J Relative gene expression levels of LRP1 in control iPLCs, APPswe iPLCs, and iAstrocytes, quantified as fold changes relative to GAPDH. The dots indicate the average values of technical replicates for each biological sample (lines, batches), with the color of the dots representing different lines. The data are presented as mean ± SD. Statistical analysis was performed using one-way ANOVA with Dunnett’s multiple comparison test (F, H, J) or t-test (A, B, C, D, E, G, I). The significance levels are denoted as follows: *p < 0.05, **p < 0.01,***p < 0.001 and ****p < 0.0001
Fig. 3
Fig. 3
APPswe iPLCs exhibit an altered transcriptome. A Volcano plot depicting DEGs between control and APPswe iPLCs (cutoffs: Adjusted p‐value < 0.05 and an absolute log2 fold change > 1.5). The analysis included seven control and three APPswe lines. BC Ingenuity Pathway Analysis identifying the top 10 canonical pathways that are most significantly downregulated (B) and upregulated (C) in APPswe iPLCs compared to controls, with pathways selected based on the highest z-scores (p-value < 0.05). D List of DEGs related to AD risk from GWAS, angiogenesis and pericyte contraction process (cutoffs: Adjusted p‐value < 0.05 and an absolute log2 fold change > 1). E List of genes involved in RHOGDI, Paxillin and Actin Cytoskeleton signaling pathways. F Pathview pathway analysis identifying the top 10 pathways most affected in APPswe iPLCs relative to controls, ranked by the highest enrichment scores. G Gene ontology (GO) enrichment analysis revealed pathways enriched in Biological Process, Molecular Function, and Cellular Component in APPswe iPLCs relative to controls
Fig. 4
Fig. 4
APPswe iPLCs show functional deficits in responding to inflammation, supporting angiogenesis, and maintaining barrier integrity. A IL-6, IL-8, MCP-1, RANTES, and VCAM-1 concentrations were measured in iPLCs culture media after 24 h of stimulation with TNFα and IL-1β or LPS and IFNγ stimulation. Results were normalized to total protein content. Statistical differences between treatments and genotypes were indicated. BC 2D tube formation assays involved culturing iECs alongside both control and APPswe iPLCs (B), scale bars, 300 μm. Statistical comparisons were made regarding the number of master segments, number of meshes, and mesh area between co-cultures of control and APPswe iPLCs with iECs (C). D Relative gene expression levels of VEGFA in control and APPswe iPLCs, quantified as fold changes relative to GAPDH. E VEGF-A protein levels in lysates from control and APPswe iPLCs were measured and normalized to total protein content. F Pe for 4 kDa and 70 kDa fluorescently labeled dextran, assessed in iECs only cultures and iECs in co-culture with either control or APPswe iPLCs. G Representative blots of ZO-1 and Occludin from control and APPswe iPLCs, with GAPDH as the loading control. H Quantification results from two batches. The dots indicate the average values of technical replicates for each biological sample (lines, batches), with the color of the dots representing different lines. The data are presented as mean ± SD. Statistical analysis was performed using two-way ANOVA with Bonferroni multiple comparison test (A), one-way ANOVA with Dunnett’s multiple comparison test (F) or t-test (CE, H). The significance levels are denoted: *p < 0.05, **p < 0.01,***p < 0.001 and ****p < 0.0001
Fig. 5
Fig. 5
APPswe iPLCs exhibited a hypercontractile phenotype. A–B Electrical impedance measurements evaluated the contractile response of iPLCs to various concentrations of ET-1 and ATP. Response curves, normalized to vehicle control, depicted cell index showing the response (A), while the response slope indicated contraction speed post-treatment (B). (C) Cell index of the contractile response to ET-1 treatment between control and APPswe iPLCs. D Statistical analysis of response slope and recovery time for iPLCs returning to normal size. E Gene expression levels of EDNRA and EDNRB in control versus APPswe iPLCs, quantified as fold changes relative to GAPDH. F–G Time-resolved blots for phosphorylated (p)-Erk and total (t)-Erk in control and APPswe iPLCs post-ET-1 treatment at intervals of 5, 10, 15, 30, 45, and 60 min, as well as in non-treated (NT) cells (F), with quantifications normalized to GAPDH and control NT wells (G). (HI) Blots of p-Erk and t-Erk from control and APPswe iPLCs 10 min after ET-1 treatment and from NT cells, with GAPDH serving as the loading control (H). Blot quantification was normalized to GAPDH levels, and treatment groups were further normalized to the NT wells of their respective lines (I). The dots indicate the average values of technical replicates for each biological sample (lines, batches), with the color of the dots representing different lines. The data are presented as mean ± SD. Statistical analysis was performed using two-way ANOVA with Bonferroni multiple comparison test (I) or t-test (D, E). The significance levels are denoted: *p < 0.05, **p < 0.01,***p < 0.001 and ****p < 0.0001

References

    1. Waring SC, Rosenberg RN. Genome-wide association studies in alzheimer disease. Arch Neurol. 2008. 10.1001/archneur.65.3.329. - PubMed
    1. Montagne A, Nation DA, Pa J, Sweeney MD, Toga AW, Zlokovic BV. Brain imaging of neurovascular dysfunction in Alzheimer’s disease. Acta Neuropathol (Berl). 2016;131(5):687–707. - PMC - PubMed
    1. Klohs J. An integrated view on vascular dysfunction in Alzheimer’s disease. Neurodegener Dis. 2019;19(3–4):109–27. - PubMed
    1. Hecht M, Krämer LM, Von Arnim CAF, Otto M, Thal DR. Capillary cerebral amyloid angiopathy in Alzheimer’s disease: association with allocortical/hippocampal microinfarcts and cognitive decline. Acta Neuropathol (Berl). 2018;135(5):681–94. - PubMed
    1. Biffi A, Greenberg SM. Cerebral amyloid angiopathy: a systematic review. J Clin Neurol. 2011;7(1):1. - PMC - PubMed

MeSH terms

LinkOut - more resources