. 2024 Sep 27;16(1):114.
doi: 10.1186/s13073-024-01385-6.

Whole genome sequencing analysis identifies sex differences of familial pattern contributing to phenotypic diversity in autism

Affiliations

Whole genome sequencing analysis identifies sex differences of familial pattern contributing to phenotypic diversity in autism

Soo-Whee Kim et al. Genome Med. .

Abstract

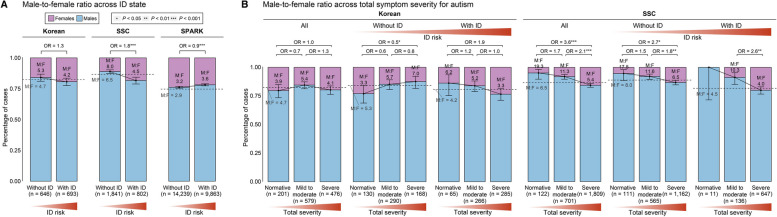
Background: Whole-genome sequencing (WGS) analyses have found higher genetic burden in autistic females compared to males, supporting higher liability threshold in females. However, genomic evidence of sex differences has been limited to European ancestry to date and little is known about how genetic variation leads to autism-related traits within families across sex.

Methods: To address this gap, we present WGS data of Korean autism families (n = 2255) and a Korean general population sample (n = 2500), the largest WGS data of East Asian ancestry. We analyzed sex differences in genetic burden and compared with cohorts of European ancestry (n = 15,839). Further, with extensively collected family-wise Korean autism phenotype data (n = 3730), we investigated sex differences in phenotypic scores and gene-phenotype associations within family.

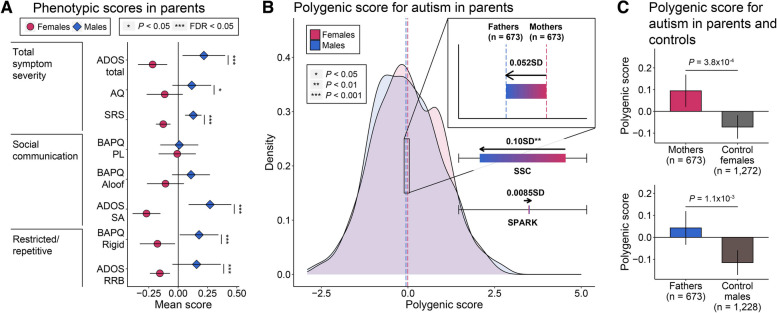
Results: We observed robust female enrichment of de novo protein-truncating variants in autistic individuals across cohorts. However, sex differences in polygenic burden varied across cohorts and we found that the differential proportion of comorbid intellectual disability and severe autism symptoms mainly drove these variations. In siblings, males of autistic females exhibited the most severe social communication deficits. Female siblings exhibited lower phenotypic severity despite the higher polygenic burden than male siblings. Mothers also showed higher tolerance for polygenic burden than fathers, supporting higher liability threshold in females.

Conclusions: Our findings indicate that genetic liability in autism is both sex- and phenotype-dependent, expanding the current understanding of autism's genetic complexity. Our work further suggests that family-based assessments of sex differences can help unravel underlying sex-differential liability in autism.

Keywords: Autism; Familial pattern; Phenotypic diversity; Polygenic burden; Sex difference; Whole-genome sequencing.


Conflict of interest statement

The authors declare no competing interests.

Figures

Fig. 1
Fig. 1
Overview of WGS and phenotype datasets used in this study. A Worldwide distribution of autism WGS cohorts with individuals ≥ 100. The largest published autism GWAS data, to date, is also illustrated in the map. The size of each cohort is illustrated by the size of bands and the composition of ancestries are represented by colors in bands (peach, European; yellow, East Asian; lavender, American; turquoise, African; blue, Admixed; orange, South Asian; gray, Unknown ancestry). Red points mark the location of each consortia/cohort and colored areas further delineate the geographic breadth of participant recruitment. Created with BioRender.com. B Comparison of assessable phenotypic scores in autism families in Korean, SSC, SPARK data. Phenotypic scores investigated consist of autism core symptoms including total symptom severity, social communication deficits, and restricted/repetitive behaviors (higher, more autistic) and developmental scores including cognitive/adaptive scores (lower, more impaired). The percentage of phenotypes assessed in each cohort are represented by shades of red (redder, higher coverage). C Overview of the WGS datasets used in this study. Composition of samples, including groups and sexes, is displayed with pie plot. Male-to-female ratio in children with autism is depicted in red letters. For replication cohorts, we subset samples with European ancestry. Groups are represented by colors in inner rings (green, autism cases; purple, non-autistic siblings; apricot, parents) and sexes are represented by colors in outer rings (pink, female cases; light blue, male cases; dark pink, female siblings; blue-green, male siblings; red, mothers; blue, fathers)
Fig. 2
Fig. 2
Autism-associated de novo and polygenic burden and their sex differences. Data analysis workflow. DNV calling and PS calculations were conducted separately for each cohort, with the exception of the Korean autism and KoGES datasets, where SNP intersection and PS calculations were carried out jointly. For the Korean autism and the KoGES cohort, AF harmonization was performed to align with European-derived associations. For Korean autism data, preprocessing of raw reads, and multi-sample genotyping were conducted by DRAGEN. BC Comparison of the de novo PTVs in constrained genes (LOEUF < 0.37), adjusted for paternal age at birth across the Korean autism, SSC, and SPARK cohorts; B between children with autism and non-autistic siblings; C between sex among children with autism. The y axis indicates the average number of variants. The P-values were computed by one-sided exact binomial test. Groups and sexes are represented by colors (green, autism cases; purple, non-autistic siblings; pink, female cases; light blue, male cases). D The Korean continuum of polygenic burden for autism in the general population and families with autism cases. Group differences are standardized using the distribution of PS in KoGES samples and P-values were computed by two-sample t tests. Deviations and P-values are depicted for only the nearest group comparisons within a continuum of polygenic score. Groups are represented by colors (green, autism cases; purple, non-autistic siblings; apricot, parents; gray, KoGES adults). EF The distribution of PS; E in children with autism and non-autistic siblings; F in female and male cases in Korean autism families. Dashed lines and colored bar in zoomed area correspond to mean PS of each group in Korean families, and colored bars under the zoom-in box correspond to group differences of PS in SSC and SPARK. The direction of arrows represents the direction of enrichment E from cases to non-autistic siblings and F from females to males. Group differences are standardized using the distribution of PS in families and P-values were computed by two-sample t tests. Significance level is denoted by asterisk (“***”, P < 0.001; “**”, P < 0.01; “*”, P < 0.05). Groups and sexes are represented by colors (green, autism cases; purple, non-autistic siblings; pink, female cases; light blue, male cases)
Fig. 3
Fig. 3
Effects of ID and total symptom severity on sex differences in de novo and polygenic burden. The percent of autism cases carrying a de novo PTV in females and males, with or without ID. The P -values were calculated using a one-sided Fisher’s exact test and 95% confidence intervals (CIs) were calculated using a binomial test with siblings. Dashed line displays the percent of siblings carrying a de novo PTV. Significance level is denoted by asterisk (“***”, P  < 0.001; “**”, P  < 0.01; “*”, P  < 0.05). Sex is represented by colors and shapes (light blue circle, female cases; pink diamond, male cases). Proportion of individuals with and without ID among autistic females and autistic males. The OR and P- values were calculated using two-sided Fisher’s exact test. Sex is represented by colors (pink, female cases; light blue, male cases) and co-occurring ID state is displayed by patterns (autism with ID, slashed; autism without ID, no pattern). The relative difference of PS depending on the degree of total symptom severity of autism and comorbid intellectual impairments between individuals with autism and siblings. The OR and P- values were calculated using a logistic regression. Error bars represent the 95% CIs of OR. Significance level is denoted by asterisk (“***”, P  < 0.001; “**”, P  < 0.01; “*”, P  < 0.05). Sex is represented by colors and shapes (green rectangle, total cases; light blue circle, female cases; pink diamond, male cases). Enrichment of phenotype subset, autistic individuals without comorbid ID and with high total symptom severity, across sexes. The OR and P- values were calculated using two-sided Fisher’s exact test. The direction of enrichment is represented by colors (pink, female-enriched; light blue, male-enriched), phenotype subset is displayed by shapes (up-pointing triangle, without ID; down-pointing triangle, high total symptom severity), and the magnitude of enrichment is represented by the size of triangle
Fig. 4
Fig. 4
Male-to-female sex ratio in children with autism depending on comorbid ID and total symptom severity. A,B The number of females and males and male-to-female ratio; A in children with autism across ID comorbid state; B in children with autism depending on total symptom severity and ID comorbid state. The y axis and bar plot represent the percentage of female and male samples. Dashed lines correspond to the sex ratio in children with autism of each group (total cases, cases without ID, or cases with ID). The P -values were calculated using two-sided Fisher’s exact test across phenotype subgroups and 95% CIs were computed by two-sided exact binomial test with base male-to-female ratio in each subgroup in each cohort. Sex and groups are represented by colors of stacked bar plot (pink, female cases; light blue, male cases). Phenotypic severity is displayed by shades of red (redder, more severe)
Fig. 5
Fig. 5
Effects of polygenic burden for various phenotypes in female and male siblings. A,B Comparison of social communication deficit scores across four groups of sibling-case sex pairs in siblings. Phenotypic scores include A abnormalities in reciprocal social interaction (ADIR A); B abnormalities in verbal communication (ADIR B verbal). Two-way ANOVA test, followed by Tukey’s multiple comparisons, was conducted and only adjusted P -values < 0.05 are displayed. Sex is represented by colors (dark pink, female siblings; blue-green, male siblings). C Comparison of z -transformed phenotypic scores including total symptom severity, social communication, restricted/repetitive behaviors, and cognitive/adaptive scores across sex in siblings. Two-sample t tests were used for the comparisons. Points represent mean scores and error bars represent the 95% CIs. Sex is represented by colors and shapes (blue-green circle, female siblings; dark pink diamond, male siblings) and the significance level is denoted by asterisk (“***”, FDR < 0.05; “*”, P  < 0.05).  D The distribution of PS in female and male siblings. The dashed lines and colored bar in the zoomed area correspond to the mean PS of each group in Korean families, while colored bars under the zoom-in box correspond to the group differences regarding PS in the SSC and SPARK cohorts. The direction of arrows represents the direction of enrichment from females to males. Group differences are standardized using the distribution of PS in families, and P- values were computed by two-sample t tests. Significance level is denoted by asterisk (“***”, P  < 0.001; “**”, P  < 0.01; “*”, P  < 0.05). Groups and sexes are represented by colors (dark pink, female siblings; blue-green, male siblings)
Fig. 6
Fig. 6
Effects of polygenic burden for various phenotypes in mothers and fathers.  A Comparison of z -transformed phenotypic scores, including total symptom severity, social communication, and restricted/repetitive behaviors. Two-sample t tests were conducted for the comparisons between groups. Points represent mean scores and error bars represent the 95% CIs. Group and sex are represented by colors and shapes (red circle, mothers; blue diamond, fathers), and the significance level is denoted by asterisk (“**”, FDR < 0.05; “*”, P  < 0.05). B The distribution of PS in parents. Dashed lines and colored bar in zoomed area correspond to the mean PS of each group in Korean families, while the colored bars under the zoom-in box correspond to the group differences regarding PS in the SSC and SPARK cohorts. The direction of arrows represents the direction of enrichment from females to males. Group differences are standardized using the distribution of PS in families and P-values were computed by two-sample t tests. The significance level is denoted by asterisk (“***”, P  < 0.001; “**”, P  < 0.01; “*”, P  < 0.05). The sex of parents is represented by different colors (red, mothers; blue, fathers).  C Comparison of PS between parents and control individuals from the general population. Two-sample t tests were conducted for group comparisons. Error bars represent the 95% CIs. Group and sex are represented by colors (red, mothers; blue, fathers; light gray, control female population; dark gray, control male population)

References

    1. Fombonne E. Epidemiology of pervasive developmental disorders. Pediatr Res. 2009;65(6):591–8. - PubMed
    1. Loomes R, Hull L, Mandy WPL. What is the male-to-female ratio in autism spectrum disorder? A Systematic Review and Meta-Analysis. J Am Acad Child Adolesc Psychiatry. 2017;56(6):466–74. - PubMed
    1. Maenner MJ, Shaw KA, Bakian AV, Bilder DA, Durkin MS, Esler A, et al. Prevalence and characteristics of autism spectrum disorder among children aged 8 years - autism and developmental disabilities monitoring network, 11 sites, United States, 2018. MMWR Surveill Summ. 2021;70(11):1–16. - PMC - PubMed
    1. Werling DM. The role of sex-differential biology in risk for autism spectrum disorder. Biol Sex Differ. 2016;7:58. - PMC - PubMed
    1. Jacquemont S, Coe BP, Hersch M, Duyzend MH, Krumm N, Bergmann S, et al. A higher mutational burden in females supports a “female protective model” in neurodevelopmental disorders. Am J Hum Genet. 2014;94(3):415–25. - PMC - PubMed

LinkOut - more resources