. 2024 Sep 27;21(1):238.
doi: 10.1186/s12974-024-03238-w.

Knockdown of microglial iron import gene, Slc11a2, worsens cognitive function and alters microglial transcriptional landscape in a sex-specific manner in the APP/PS1 model of Alzheimer's disease

Affiliations

Knockdown of microglial iron import gene, Slc11a2, worsens cognitive function and alters microglial transcriptional landscape in a sex-specific manner in the APP/PS1 model of Alzheimer's disease

Katrina Volk Robertson et al. J Neuroinflammation. .

Abstract

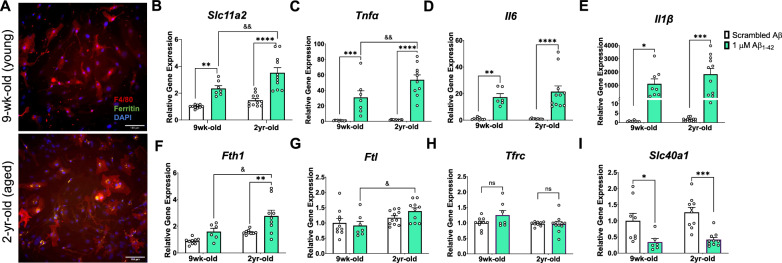
Background: Microglial cell iron load and inflammatory activation are significant hallmarks of late-stage Alzheimer's disease (AD). In vitro, microglia preferentially upregulate the iron importer, divalent metal transporter 1 (DMT1, gene name Slc11a2) in response to inflammatory stimuli, and excess iron can augment cellular inflammation, suggesting a feed-forward loop between iron import mechanisms and inflammatory signaling. However, it is not understood whether microglial iron import mechanisms directly contribute to inflammatory signaling and chronic disease in vivo. These studies determined the effects of microglial-specific knockdown of Slc11a2 on AD-related cognitive decline and microglial transcriptional phenotype.

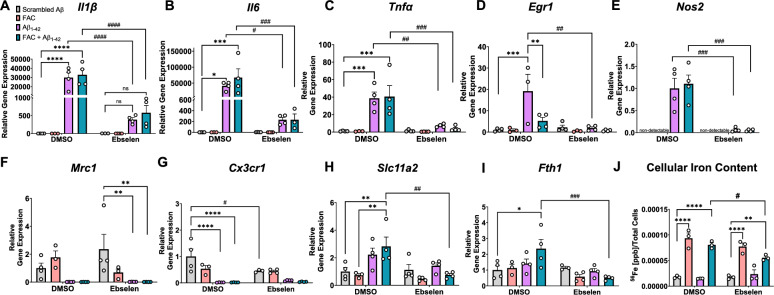
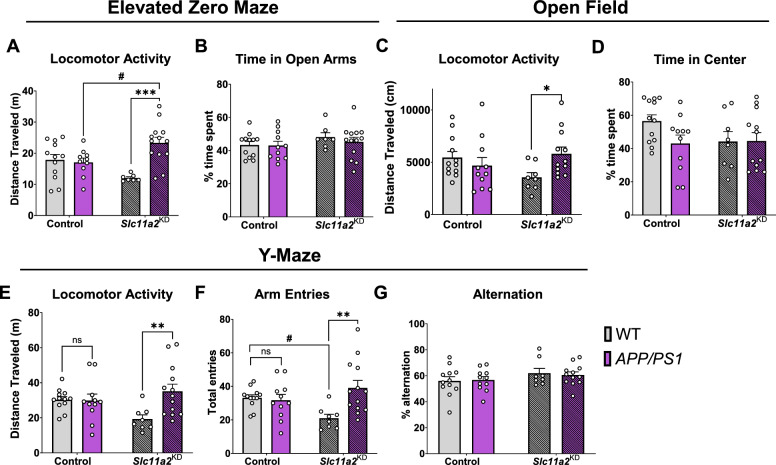
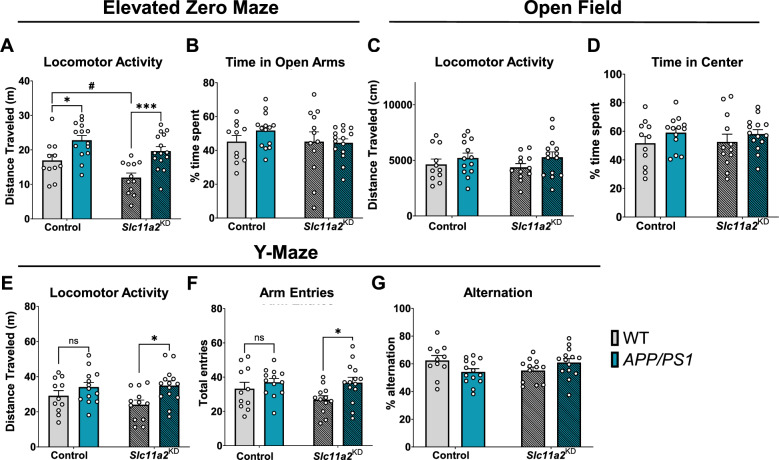
Methods: In vitro experiments and RT-qPCR were used to assess a role for DMT1 in amyloid-β-associated inflammation. To determine the effects of microglial Slc11a2 knockdown on AD-related phenotypes in vivo, triple-transgenic Cx3cr1Cre-ERT2;Slc11a2flfl;APP/PS1+or - mice were generated and administered corn oil or tamoxifen to induce knockdown at 5-6 months of age. Both sexes underwent behavioral analyses to assess cognition and memory (12-15 months of age). Hippocampal CD11b+ microglia were magnetically isolated from female mice (15-17 months) and bulk RNA-sequencing analysis was conducted.

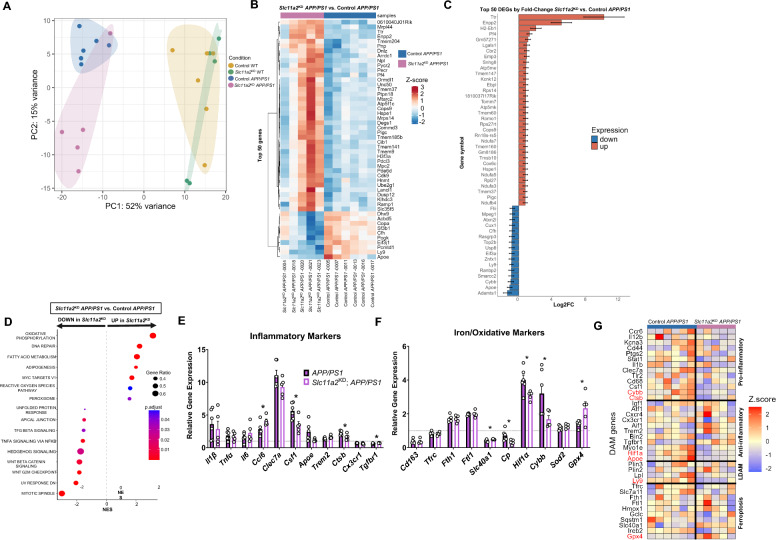
Results: DMT1 inhibition in vitro robustly decreased Aβ-induced inflammatory gene expression and cellular iron levels in conditions of excess iron. In vivo, Slc11a2KD APP/PS1 female, but not male, mice displayed a significant worsening of memory function in Morris water maze and a fear conditioning assay, along with significant hyperactivity compared to control WT and APP/PS1 mice. Hippocampal microglia from Slc11a2KD APP/PS1 females displayed significant increases in Enpp2, Ttr, and the iron-export gene, Slc40a1, compared to control APP/PS1 cells. Slc11a2KD cells from APP/PS1 females also exhibited decreased expression of markers associated with subsets of disease-associated microglia (DAMs), such as Apoe, Ctsb, Ly9, Csf1, and Hif1α.

Conclusions: This work suggests a sex-specific role for microglial iron import gene Slc11a2 in propagating behavioral and cognitive phenotypes in the APP/PS1 model of AD. These data also highlight an association between loss of a DAM-like phenotype in microglia and cognitive deficits in Slc11a2KD APP/PS1 female mice. Overall, this work illuminates an iron-related pathway in microglia that may serve a protective role during disease and offers insight into mechanisms behind disease-related sex differences.

Keywords: APP/PS1; Alzheimer’s disease; Behavior; DMT1; Inflammation; Iron; Microglia; Neuroinflammation; Sex differences; Slc11a2.


Conflict of interest statement

The authors declare no competing interests.

Figures

Fig. 1
Fig. 1
Age and Aβ stimulation synergize to increase microglial Slc11a2 and iron-loading markers in primary microglia. A Representative images of Percoll-isolated glia from a young (top image, 9-week-old) and aged (bottom image, 2-year-old) mouse showing ferritin deposits in microglia from the aged mouse. Isolated glia were stained with antibodies raised against ferritin-L and F4/80, along with DAPI to visualize ferritin, microglia, and nuclei, respectively. Images shown at 20x, scale bar = 100 μm. BI Relative gene expression (compared to control scrambled Aβ) of (B) Slc11a2, C Tnfα, D Il6, E Il1β, F Fth1, G Ftl, H Tfrc, and I Slc40a1 via RT-qPCR. Isolated cells from young and aged mice were plated and treated with scrambled Aβ or 1 μM Aβ1-42 for 24 h before collection for RNA isolation and RT-qPCR analysis. Two-way ANOVA, *p < 0.05, **p < 0.01, ***p < 0.001, ****p < 0.0001 effect of treatment. &p < 0.05, &&p < 0.01 effect of age x treatment. ns not significant. Data represent the mean ± S.E.M of 7–11 mice per group. Statistical outliers were removed using the Grubb’s test
Fig. 2
Fig. 2
DMT1 inhibition in vitro significantly blunts Aβ-induced inflammatory markers and decreases cellular iron levels in immortalized microglia. AI Relative gene expression (compared to scrambled Aβ DMSO) via RT-qPCR of A Il1β, B Il6, C Tnfα, D Egr1, E Nos2, F Mrc1, G Cx3cr1, H Slc11a2, and I Fth1 in IMG cells. IMG cells were treated for 24 h with DMSO or 25 μM ebselen, followed by 24 h treatment with scrambled Aβ or 1 μM Aβ1-42 ± 50 μM ferric ammonium citrate (FAC). J ICP-MS analysis of intracellular 56Fe content from IMG cells following 24 h treatment with DMSO or ebselen, and 24 h scrambled Aβ ± FAC or Aβ1-42 ± FAC treatment. Two-way ANOVA, *p < 0.05, **p < 0.01, ***p < 0.001, ****p < 0.0001 effect of Aβ or FAC treatment. #p < 0.05, ##p < 0.01, ###p < 0.001, ####p < 0.0001 effect of treatment x ebselen. ns not significant. Data show a representative experiment with the mean ± S.E.M of 3–4 technical replicates, and experiment was repeated three times. Statistical outliers were removed using the Grubb’s test
Fig. 3
Fig. 3
Microglial Slc11a2 knockdown results in a hyperactive phenotype in female APP/PS1 mice at 12–15 months. A, B Elevated zero maze. A Total distance traveled (m) in control WT, control APP/PS1, Slc11a2KD WT, and Slc11a2KD APP/PS1 female mice. B Total percent time spent in open arms. C, D Open field locomotor activity assay. C Total distance traveled (cm). D Total percent time spent in the center. EG Exploratory Y-maze. E Total distance traveled (m). F Total number of different arm entries. G Total percent alternation. Two-way ANOVA, *p < 0.05, **p < 0.01, ***p < 0.001 effect of APP/PS1 genotype, #p < 0.05 Slc11a2KD vs. Control. ns not significant. Data represent the mean ± S.E.M of 8–13 female mice per group. Statistical outliers were removed using the Grubb’s test
Fig. 4
Fig. 4
Microglial Slc11a2 knockdown worsens hyperactivity in a novel environment in male APP/PS1 mice at 12–15 months. A-B Elevated zero maze. A Total distance traveled (m) in control WT, control APP/PS1, Slc11a2KD WT, and Slc11a2KD APP/PS1 male mice. B Total percent time spent in open arms. C, D Open field locomotor activity assay. C Total distance traveled (cm). D Total percent time spent in the center. EG Exploratory Y-maze. E Total distance traveled (m). F Total number of different arm entries. G Total percent alternation. Two-way ANOVA, *p < 0.05, ***p < 0.001 effect of APP/PS1 genotype. #p < 0.05 Slc11a2KD vs. Control. ns not significant. Data represent the mean ± S.E.M of 11–15 male mice per group. Statistical outliers were removed using the Grubb’s test
Fig. 5
Fig. 5
Microglial Slc11a2 knockdown worsens memory performance in Morris water maze and cued fear conditioning assay in APP/PS1 female mice. AD Morris water maze (MWM). A Total distance traveled (m) before reaching hidden platform over course of five training days in control WT, control APP/PS1, Slc11a2KD WT, and Slc11a2KD APP/PS1 female mice. Four trials of 60 s each were conducted each day and averaged per animal. Three-way ANOVA, ****p < 0.0001 effect of day. B Average speed (m/s) measured during probe trial. Two-way ANOVA, *p < 0.05 effect of APP/PS1 genotype. ##p < 0.01 Slc11a2KD vs. Control. C Total percent time spent in the target quadrant in probe trial for memory. D Total time (s) spent around where the platform previously was (exact platform location + 1.5 cm radius) during probe trial for memory. EH Fear conditioning assay. E Percent component time freezing during the 8 min training protocol. Every 2 min, a 30 s tone was played, followed by a mild foot shock. Increased freezing behavior over the course of the assay is shown. ****p < 0.0001 effect of time, ****p < 0.0001 effect of APP/PS1 x time. F Percent time freezing during 4 min contextual fear conditioning test. G Total percent time spent freezing during the 4 min of cued fear conditioning testing. H Percent component time spent freezing during 2 min of no-tone versus 2 min of tone presentation in cued fear conditioning test. ****p < 0.0001 effect of tone, *p < 0.05 Slc11a2KD APP/PS1 vs. Control APP/PS1. Data represent the mean ± S.E.M. of 8–13 mice per group. Statistical outliers were removed using the Grubb’s test
Fig. 6
Fig. 6
Microglial Slc11a2 knockdown has no effect on memory performance in male mice. A-D Morris water maze (MWM). A Total distance traveled (m) before reaching hidden platform over course of five training days in control WT, control APP/PS1, Slc11a2KD WT, and Slc11a2KD APP/PS1 male mice. Four trials of 60 s each were conducted each day and averaged per animal. Three-way ANOVA, ****p < 0.0001 effect of day, *p < 0.05 effect of APP/PS1. B Average speed (m/s) measured during probe trial. Two-way ANOVA, *p < 0.05 effect of APP/PS1 genotype. ##p < 0.01 Slc11a2KD vs. Control. C Total percent time spent in the target quadrant in probe trial for memory. D Total time (s) spent around where the platform previously was (exact platform location + 1.5 cm radius) during probe trial for memory. EH Fear conditioning assay. E Percent component time freezing during the 8 min training protocol. Every 2 min, a 30 s tone was played, followed by a mild foot shock. Increased freezing behavior over the course of the assay is shown. ****p < 0.0001 effect of time, **p < 0.0001 effect of APP/PS1 x time. F Percent time freezing during 4 min contextual fear conditioning test. G Total percent time spent freezing during the 4 min of cued fear conditioning testing. H Percent component time spent freezing during 2 min of no-tone versus 2 min of tone presentation in cued fear conditioning test. *p < 0.05 effect of APP/PS1 genotype, ****p < 0.0001 effect of tone. Data represent the mean ± S.E.M. of 11–14 mice per group. Statistical outliers were removed using the Grubb’s test
Fig. 7
Fig. 7
Slc11a2 knockdown shifts transcriptional profile and alters several DAM-related gene markers in hippocampal microglia from female APP/PS1 mice. A Principal component analysis (PCA) of bulk RNA-seq gene expression in sorted CD11b+ microglia from control WT, control APP/PS1, Slc11a2KD WT, and Slc11a2KD APP/PS1 mice. Primary differences in overall gene expression are a result of APP/PS1 genotype. B Heat map of top 50 DEGs (by adjusted p-value in RNA-seq dataset) between Slc11a2KD APP/PS1 versus control APP/PS1 microglia. Blue = downregulated in Slc11a2KD cells, lighter blue and/or red = upregulated in Slc11a2KD cells. C Top 50 DEGS by fold-change in RNA-seq analysis between Slc11a2KD APP/PS1 and control APP/PS1 microglia. Red = upregulated in Slc11a2KD, blue = downregulated in Slc11a2KD cells. D GSEA analysis of hallmark gene pathways significantly altered between Slc11a2KD APP/PS1 and control APP/PS1 microglia. E, F Relative gene expression of targeted E inflammatory markers and F iron and oxidative stress markers from Slc11a2KD APP/PS1 versus control APP/PS1 microglia in the RNA-seq dataset. Gene expression is relative to control WT average (black dotted line set to 1). *p < 0.05, student’s t-test comparing Slc11a2KD APP/PS1 vs. control APP/PS1. G Gene markers representing subsets of DAMs (i.e., pro-inflammatory, anti-inflammatory, LDAM, and ferroptosis) were analyzed via RNA-seq between Control and Slc11a2KD APP/PS1 female microglia. Genes highlighted in red are significantly different between groups, adjusted p-value < 0.05. Data represent the mean ± S.E.M. of 5–6 mice per group

Update of

References

    1. As A. 2023 Alzheimer’s disease facts and figures. Alzheimers Dement. 2023;19(4):1598–695. - PubMed
    1. Kinney JW, Bemiller SM, Murtishaw AS, Leisgang AM, Salazar AM, Lamb BT. Inflammation as a central mechanism in Alzheimer’s disease. Alzheimers Dement. 2018;4:575–90. - PMC - PubMed
    1. Cummings JL, Osse AML, Kinney JW. Alzheimer’s disease: novel targets and investigational drugs for disease modification. Drugs. 2023;83(15):1387–408. - PMC - PubMed
    1. Belaidi AA, Bush AI. Iron neurochemistry in Alzheimer’s disease and Parkinson’s disease: targets for therapeutics. J Neurochem. 2016;139(Suppl 1):179–97. - PubMed
    1. Kenkhuis B, Bush AI, Ayton S. How iron can drive neurodegeneration. Trends Neurosci. 2023;46(5):333–5. - PubMed

Substances