. 2024 Sep 27;22(1):458.
doi: 10.1186/s12964-024-01832-2.

Analysis of early effects of human APOE isoforms on Alzheimer's disease and type III hyperlipoproteinemia pathways using knock-in rat models with humanized APP and APOE

Affiliations

Analysis of early effects of human APOE isoforms on Alzheimer's disease and type III hyperlipoproteinemia pathways using knock-in rat models with humanized APP and APOE

Metin Yesiltepe et al. Cell Commun Signal. .

Erratum in

Abstract

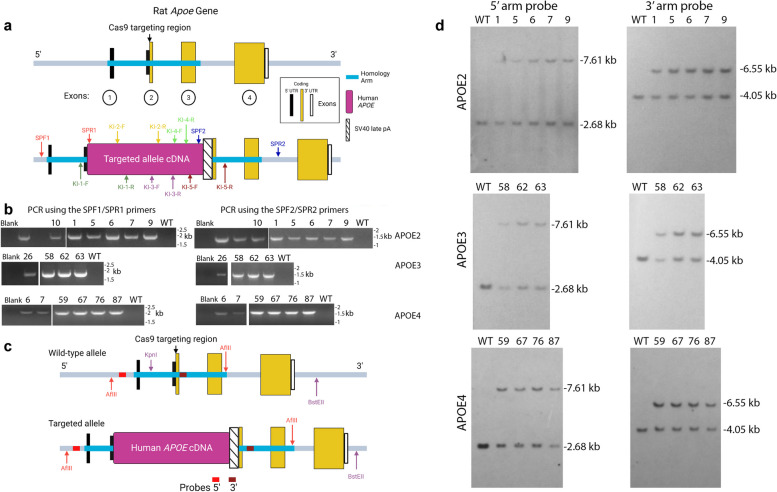
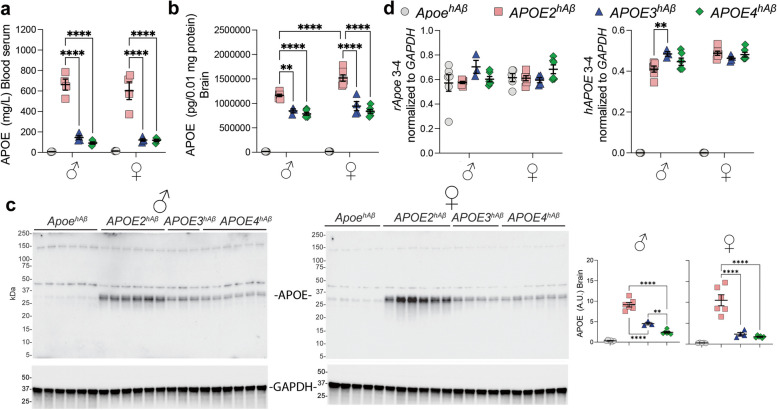
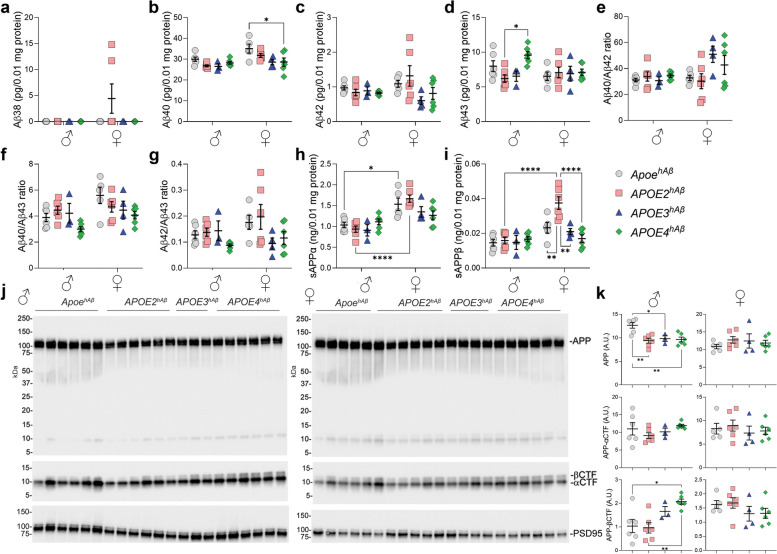
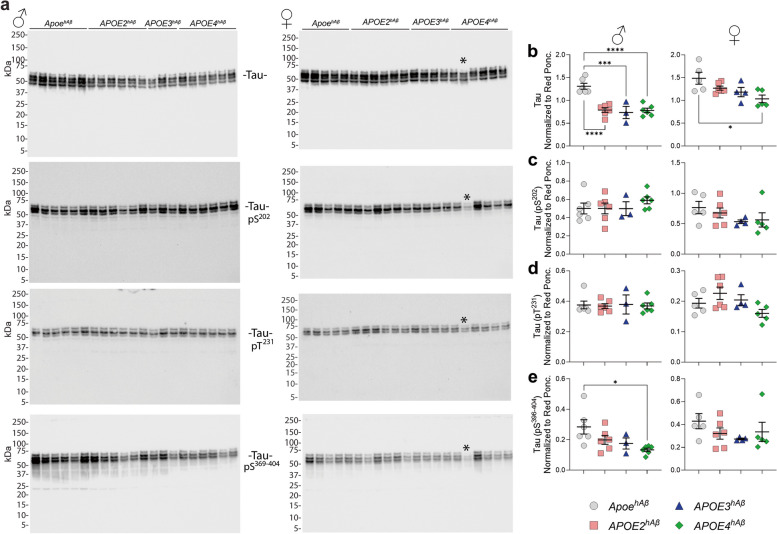
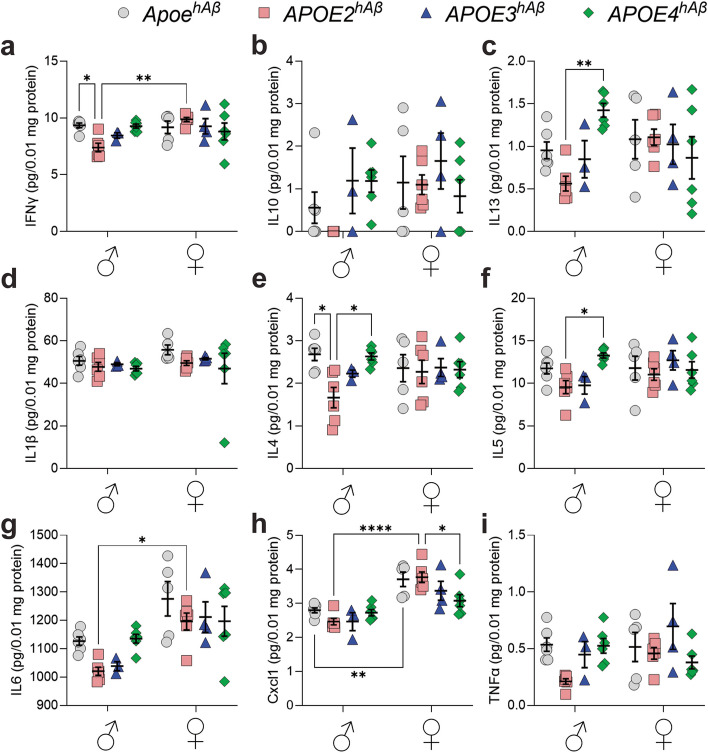
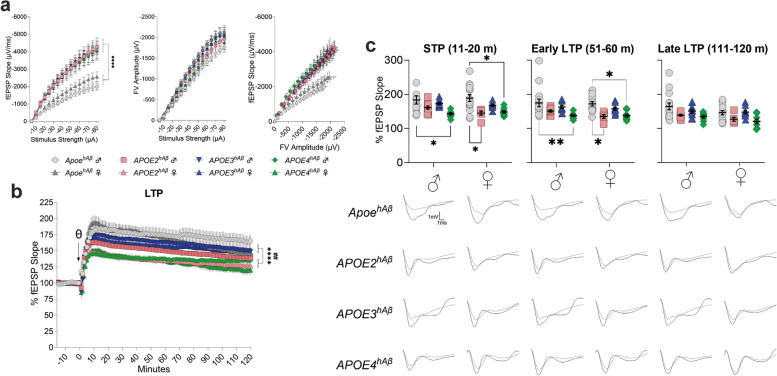
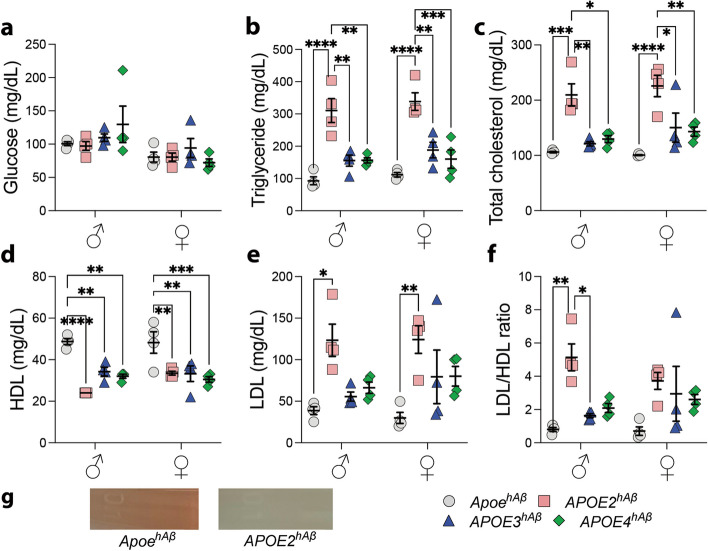
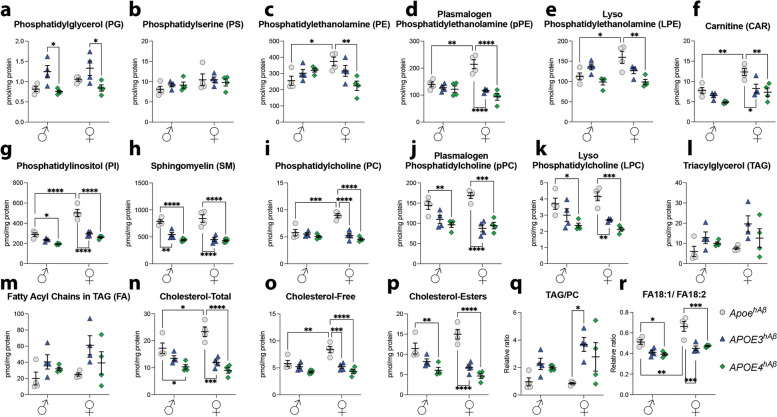
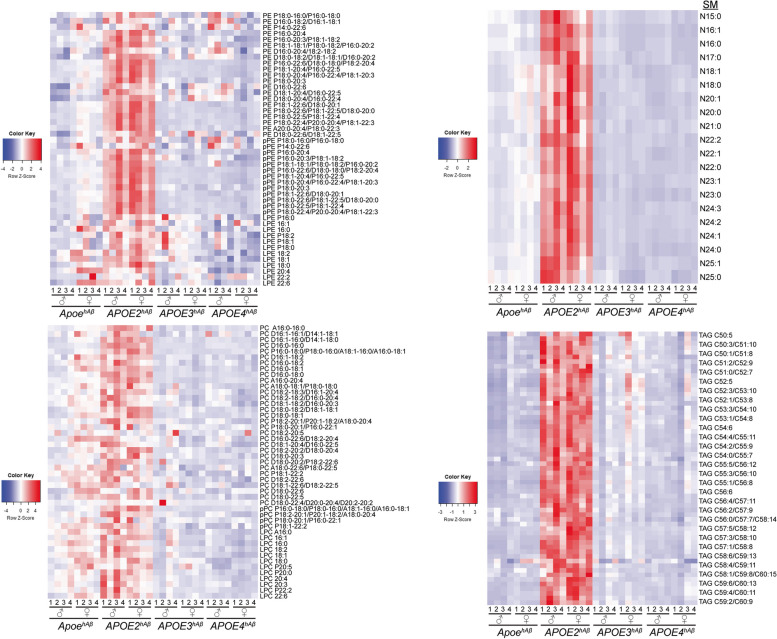
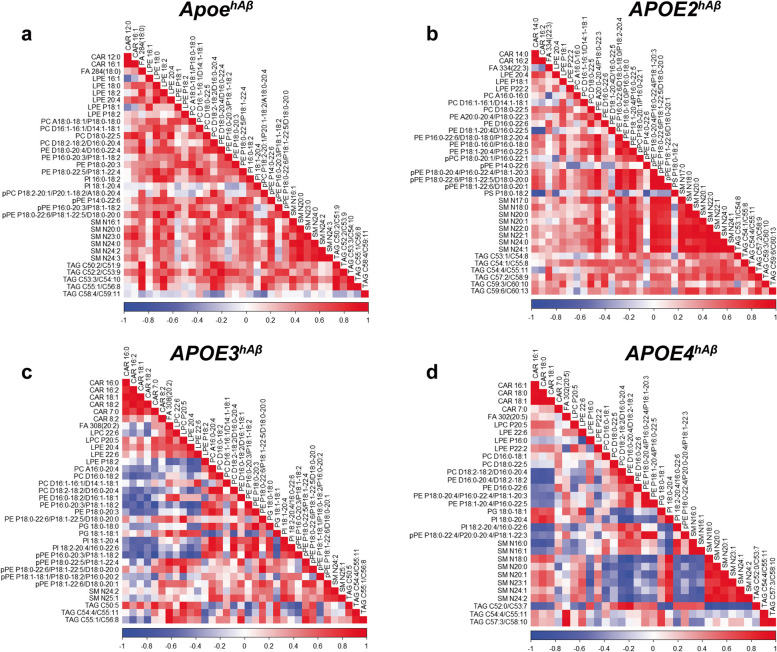
APOE is a major genetic factor in late-onset Alzheimer's disease (LOAD), with APOE4 increasing risk, APOE3 acting as neutral, and APOE2 offering protection. APOE also plays key role in lipid metabolism, affecting both peripheral and central systems, particularly in lipoprotein metabolism in triglyceride and cholesterol regulation. APOE2 is linked to Hyperlipoproteinemia type III (HLP), characterized by mixed hypercholesterolemia and hypertriglyceridemia due to impaired binding to Low-Density Lipoproteins receptors. To explore the impact of human APOE isoforms on LOAD and lipid metabolism, we developed Long-Evans rats with human APOE2, APOE3, or APOE4 in place of rat Apoe. These rats were crossed with those carrying a humanized App allele to express human Aβ, which is more aggregation-prone than rodent Aβ, enabling the study of human APOE-human Aβ interactions. In this study, we focused on 80-day-old adolescent rats to analyze early changes that may be associated with the later development of LOAD. We found that APOE2hAβ rats had the highest levels of APOE in serum and brain, with no significant transcriptional differences among isoforms, suggesting variations in protein translation or stability. Aβ43 levels were significantly higher in male APOE4hAβ rats compared to APOE2hAβ rats. However, no differences in Tau or phosphorylated Tau levels were observed across the APOE isoforms. Neuroinflammation analysis revealed lower levels of IL13, IL4 and IL5 in APOE2hAβ males compared to APOE4hAβ males. Neuronal transmission and plasticity tests using field Input-Output (I/O) and long-term potentiation (LTP) recordings showed increased excitability in all APOE-carrying rats, with LTP deficits in APOE2hAβand APOE4hAβ rats compared to ApoehAβ and APOE3hAβ rats. Additionally, a lipidomic analysis of 222 lipid molecular species in serum samples showed that APOE2hAβ rats displayed elevated triglycerides and cholesterol, making them a valuable model for studying HLP. These rats also exhibited elevated levels of phosphatidylglycerol, phosphatidylserine, phosphatidylethanolamine, sphingomyelin, and lysophosphatidylcholine. Minimal differences in lipid profiles between APOE3hAβ and APOE4hAβ rats reflect findings from mouse models. Future studies will include comprehensive lipidomic analyses in various CNS regions and at older ages to further validate these models and explore the effects of APOE isoforms on lipid metabolism in relation to AD pathology.


Conflict of interest statement

The authors declare no competing interests.

Figures

Fig. 1
Fig. 1
Generation of humanized APOE rats. a The schematic representation of the rat Apoe allele depicts the four exons with the 5’ UTR sequences in black, the coding sequences in orange, and the 3’ UTR in white. The regions utilized for the homology arms of the KI construct are indicated in blue. The Cas9 targeting site is also highlighted. Below is a schematic representation of the human APOE KI allele, with the sites of the oligonucleotides used for PCR analysis indicated. b PCR analysis using primer pairs SPF1/SPR1, which detects correct insertion at the 5’ region, and primer pairs SPF2/SPR2, which detects correct insertion at the 3’ region. The data show that the rats designed as APOE2, APOE3, and APOE4 F0 and F1 have correct 5’ and 3’ insertions. c The schematic representation of the Southern blotting technique used for genotyping the APOE2, APOE3, and APOE4 rats is presented. For the 5’ arm probe Southern blot, genomic DNA was digested with AflII. The expected fragment size for the wild-type rat Apoe allele was 2.68 kb, while for the human APOE KI allele, it was 7.61 kb. For the 3’ arm, genomic DNA was digested with KpnI plus BstEII. The expected fragment size for the wild-type rat Apoe allele was 4.05 kb, and for the human APOE KI allele, it was 6.55 kb. d Southern blot analysis shows that the wild-type sample displayed the expected rat Apoe bands of 2.68 kb and 4.05 kb for the 5’ arm probe and 3’ arm probe, respectively. In contrast, the samples identified as APOE2, APOE3, and APOE4 F1s by the PCR analysis in part b, exhibited both the wild-type bands and the APOE KI bands of 7.61 kb and 6.55 kb for the 5’ arm probe and 3’ arm probe, respectively. No other bands that would indicate off-target, random integration are detected
Fig. 2
Fig. 2
Levels of human APOE in 80 days old ApoehAβ, APOE2hAβ, APOE3hAβ and APOE4hAβ rats. a ELISA measurements of human APOE in blood serum (n=4 per sex per genotype) showed significantly higher levels in APOE2hAβ compared to APOE3hAβ and APOE4hAβ in both males and females. b ELISA analysis of human APOE in brain homogenates (ApoehAβ, females n=6, males n=5; APOE2hAβ, females n=6, males n=6; APOE3hAβ, females n=4, males n=3; APOE4hAβ, females n=6, males n=6) revealed higher levels in APOE2hAβ compared to APOE3hAβ and APOE4hAβ in both sexes. Moreover, brain APOE levels were higher in male APOE2hAβ rats compared to females. Rat Apoe (ApoehAβ rats) is not detected by the ELISA demonstrating specificity. Therefore, ApoehAβ rats were excluded from the statistical analysis. c WB analysis of human APOE in the same brains analyzed by ELISA in panel b confirms higher levels of APOE in APOE2hAβ brains compared to APOE3hAβ and APOE4hAβ in both sexes. d Quantitative RT-PCR analysis of rat and human APOE mRNA expression in the same brains analyzed by ELISA and WB in panels b and c confirms that ApoehAβ rats express only rat Apoe mRNA, while APOE2hAβ, APOE3hAβ and APOE4hAβ express exclusively human APOE mRNA. Human APOE mRNA expression levels were comparable among APOE2hAβ, APOE3hAβ and APOE4hAβ rats, except for a reduction observed in APOE2hAβ males compared to APOE2hAβ, APOE3hAβ males. The WB analysis for GAPDH confirms equal loading of the samples. Data are presented as mean ± SEM and were analyzed by two-way ANOVA followed by post hoc Tukey’s multiple comparisons test when significant differences were detected. Statistical significance is denoted as ** p<0.01, *** p<0.001, **** p<0.0001
Fig. 3
Fig. 3
Analysis of APP metabolites in brains of ApoehAβ, APOE2hAβ, APOE3hAβ and APOE4hAβ rats. a-i ELISA measurements for Aβ38 (a), Aβ40 (b), Aβ42 (c), Aβ43 (d), Aβ40/Aβ42 ratio (e), Aβ40/Aβ43 ratio (f), Aβ42/Aβ43 ratio (g), sAPPα (h), and sAPPβ (i) were conducted on the same brain homogenates used in Fig. 2b. j WB analysis of APP, βCTF, and αCTF in brain lysates used in the WBs shown Fig. 2c. PSD95 WB was used as a loading control. k Quantification of the APP, βCTF, and αCTF signals detected in panel j. Longer exposures of βCTF and αCTF signals, which were used to quantify βCTF and αCTF, are shown below the main WBs. Data are represented as mean ± SEM and were analyzed by two‐way ANOVA followed by post-hoc Tukey’s multiple comparisons tests when ANOVA showed significant differences. Statistical significance is denoted as * p<0.05, ** p<0.01, *** p<0.001, **** p<0.0001
Fig. 4
Fig. 4
Analysis of Tau and phosphorylated Tau in brains of ApoehAβ, APOE2hAβ, APOE3hAβ and APOE4hAβ rats. a WB analysis of Tau, Tau-pS202, Tau-pT231, Tau pS396-404 in brain lysates were conducted on the same brain homogenates used in Fig. 2b (n=3-6 per sex per genotype). The star indicates the degraded sample, which was excluded from the analysis. b-e Quantification of the Tau (b), Tau-pS202(c), Tau-pT231(d), Tau pS396-404(e) signals detected in panel a. Data are represented as mean ± SEM and were analyzed by one‐way ANOVA followed by multiple comparisons tests. Statistical significance is denoted as * p<0.05, ** p<0.01, *** p<0.001, **** p<0.0001
Fig. 5
Fig. 5
Levels of cytokines in ApoehAβ, APOE2hAβ, APOE3hAβ and APOE4hAβ rats’ brains. ELISA measurements for IFN-γ (a), IL10 (b), IL13 (c), IL-1β (d), IL-4 (e), IL-5 (f), IL-6 (g), Cxcl1 (h), and TNF-α (i) were conducted on the same brain homogenates used in Fig. 3a-i (n=3-6 per sex per genotype). Data are represented as mean ± SEM and were analyzed by two‐way ANOVA followed by post-hoc Tukey’s multiple comparisons tests when ANOVA showed significant differences. Statistical significance is denoted as * p<0.05, ** p<0.01, *** p<0.001, **** p<0.0001
Fig. 6
Fig. 6
Effects of APOE variants on synaptic transmission and plasticity. a IO recording of APOE variants in hippocampal Schafer Colleterals-CA1 circuit. Left panel, I-O curve generated from the slope fEPSP versus stimulus strength. Middle panel, I-O curve generated from FV amplitude versus stimulus strength. Right panel, I-O curve generated from the slope fEPSP versus FV amplitude. Each genotype/sex is compared separately. Data is represented as mean ± SEM. Data were analyzed by two-way ANOVA (Column factor). See the statistical analysis in Table 5. b LTP Recordings in the Hippocampal Schaffer Collateral-CA1 Circuit of 80-Day-Old APOE Variant Rats. LTP recordings are weaker in both male and female APOE2hAβ and APOE4hAβ rats compared to ApoehAβand APOE3hAβ rats. Each genotype/sex is compared separately. Data are represented as mean ± SEM. Data were analyzed by two-way ANOVA. See Table 5 for statistical analysis. c Plot of fEPSP slope change in STP (11-20 m), early LTP (51-60 m) and late LTP (111-120 m) phases of LTP. The average traces of the baseline (dotted line) and STP, early LTP and late LTP (solid line) are shown on bottom. Data are represented as mean ± SEM. Data were analyzed by two-way ANOVA for repeated measures followed by post-hoc Tukey’s multiple comparisons test when ANOVA showed statistically significant differences. Statistical analysis are shown in Table 6
Fig. 7
Fig. 7
Metabolic profiles in 80-day-old rats: blood glucose, lipids, and LDL/HDL ratio after fasting. ApoehAβ, APOE2hAβ, APOE3hAβ and APOE4hAβ rats (n=4 per sex per genotype) were analyzed for blood levels of glucose (a), triglycerides (b), total cholesterol (c), HDL (d), LDL (e) and for LDL/HDL ratio (f). g The serum of APOE2hAβ rats exhibited a turbid appearance reminiscent of human cases of type III HLP. Data are represented as mean ± SEM and were analyzed by two-way ANOVA followed by post hoc Tukey’s multiple comparisons test when ANOVA showed a significant difference. When the measurements were discovered to exceed the range, the nearest integer beyond the range was assigned. Statistical significance is denoted as * p<0.05, ** p<0.01, *** p<0.001, **** p<0.0001
Fig. 8
Fig. 8
Serum lipid profile of ApoehAβ, APOE2hAβ, APOE3hAβ and APOE4hAβ rats. Levels of PG (a), PS (b), PE (c), pPE (d), LPE (e), CAR (f), PI (g), SM (h), PC (i), pPC (j), LPC (k), TAG (l), FA (m), total Cholesterol (n), free Cholesterol (o) and Cholesterol esters (p) and relative ratios of TAG/PC (q) and FA18:1/FA 18:2 (r) in serum of 80 days old ApoehAβ, APOE2hAβ, APOE3hAβ and APOE4hAβ rats are shown (n=4 per sex per genotype). Data are represented as mean ± SEM and were analyzed by two-way ANOVA followed by post hoc Tukey’s multiple comparisons test when ANOVA showed a significant difference. Post hoc Tukey’s Analysis is shown in Tables 1 and 2. * p<0.05, ** p<0.01, *** p<0.001, **** p<0.0001
Fig. 9
Fig. 9
Serum lipid profile of ApoehAβ, APOE3hAβ and APOE4hAβ rats. Levels of PG (a), PS (b), PE (c), pPE (d), LPE (e), CAR (f), PI (g), SM (h), PC (i), pPC (j), LPC (k), TAG (l), FA (m), total Cholesterol (n), free Cholesterol (o) and Cholesterol esters (p) and relative ratios of TAG/PC (q) and FA18:1/FA 18:2 (r) in serum of 80 days old ApoehAβ, APOE3hAβ and APOE4hAβ rats (n=4 per sex per genotype). Data are represented as mean ± SEM and were analyzed by two-way ANOVA followed by post hoc Tukey’s multiple comparisons tests when ANOVA showed a significant difference. * p<0.05, ** p<0.01, *** p<0.001, **** p<0.0001
Fig. 10
Fig. 10
Heatmap analysis of FA, PI, PG, PS, and CAR in serum of individual rats. Heatmap represents the relative levels of various lipids. Each row corresponds to a specific lipid, and each column corresponds to an individual rat. The color of each cell indicates the relative change from the mean of the same row (lipid) across all individuals. The color gradient ranges from dark blue (lowest) to red (highest). Blue colors represent lower relative levels of a particular lipid in an individual, while red colors indicate higher relative levels
Fig. 11
Fig. 11
Heatmap analysis of PE and related lipid species, SM, PC and related lipid species, and TAG in serum of individual rats. Heatmap represents the relative levels of various lipids. Each row corresponds to a specific lipid, and each column corresponds to an individual rat. The color of each cell indicates the relative change from the mean of the same row (lipid) across all individuals. The color gradient ranges from dark blue (lowest) to red (highest). Blue colors represent lower relative levels of a particular lipid in an individual, while red colors indicate higher relative levels
Fig. 12
Fig. 12
Correlation heatmaps of top 20 correlations with p<0.05 for ApoehAβ, APOE2hAβ, APOE3hAβ and APOE4hAβ rats. All correlation coefficients are reported in Additional file 2

References

    1. Yamazaki Y, et al. Apolipoprotein E and Alzheimer disease: pathobiology and targeting strategies. Nat Rev Neurol. 2019;15(9):501–18. - PMC - PubMed
    1. Huebbe P, Rimbach G. Evolution of human apolipoprotein E (APOE) isoforms: gene structure, protein function and interaction with dietary factors. Ageing Res Rev. 2017;37:146–61. - PubMed
    1. Fullerton SM, et al. Apolipoprotein E variation at the sequence haplotype level: implications for the origin and maintenance of a major human polymorphism. Am J Hum Genet. 2000;67(4):881–900. - PMC - PubMed
    1. Kayden HJ, Maschio F, Traber MG. The secretion of apolipoprotein E by human monocytederived macrophages. Arch Biochem Biophys. 1985;239(2):388–95. - PubMed
    1. Gee JR, Keller JN. Astrocytes: regulation of brain homeostasis via apolipoprotein E. Int J Biochem Cell Biol. 2005;37(6):1145–50. - PubMed