. 2024 Sep 27;12(1):113.
doi: 10.1186/s40364-024-00656-z.

Functional heterogeneity of cancer-associated fibroblasts with distinct neoadjuvant immunotherapy plus chemotherapy response in esophageal squamous cell carcinoma

Affiliations

Functional heterogeneity of cancer-associated fibroblasts with distinct neoadjuvant immunotherapy plus chemotherapy response in esophageal squamous cell carcinoma

Jun Jiang et al. Biomark Res. .

Abstract

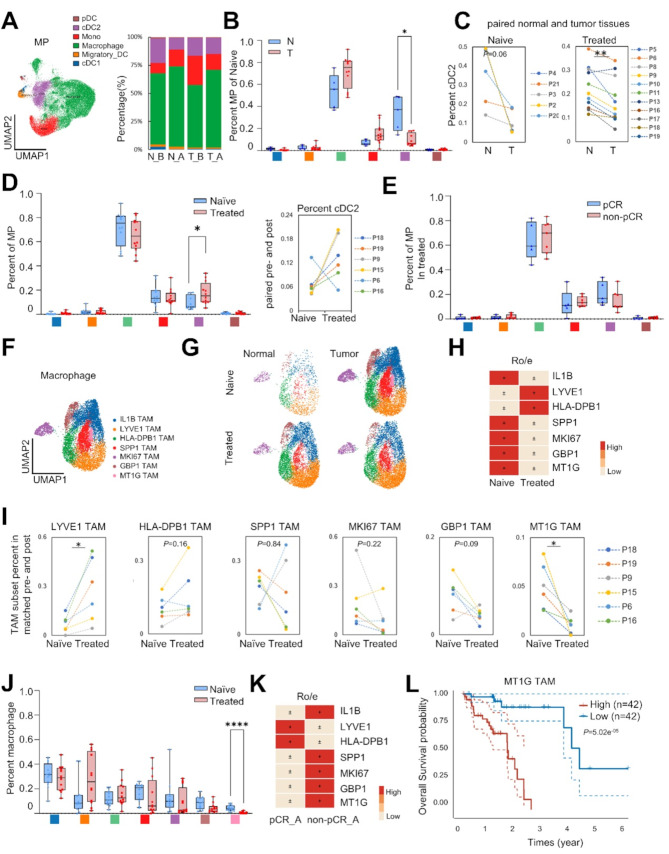
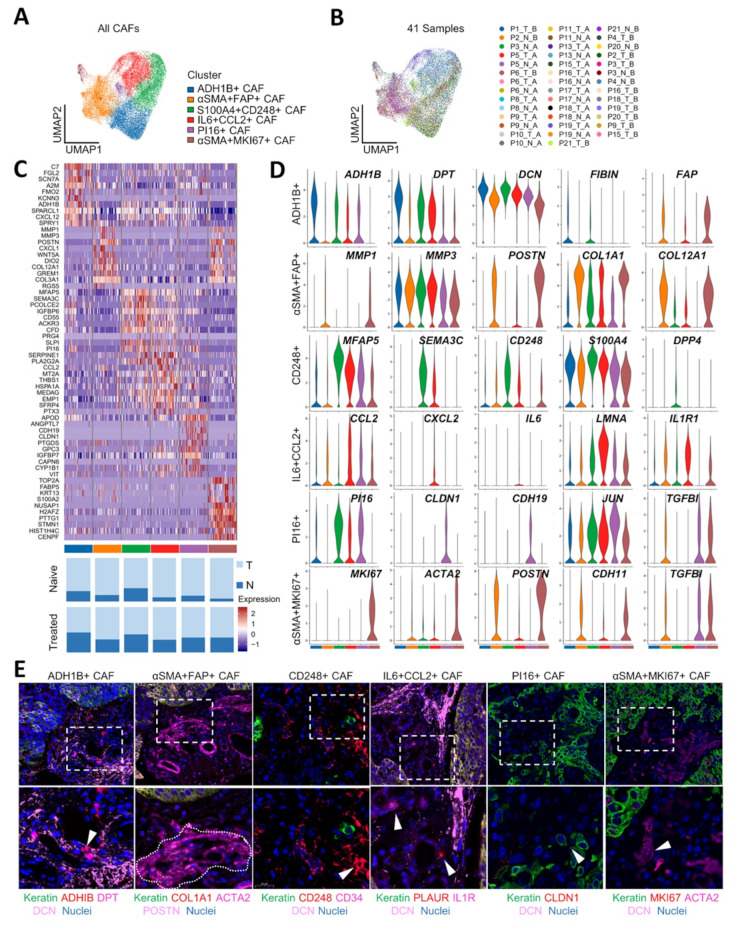
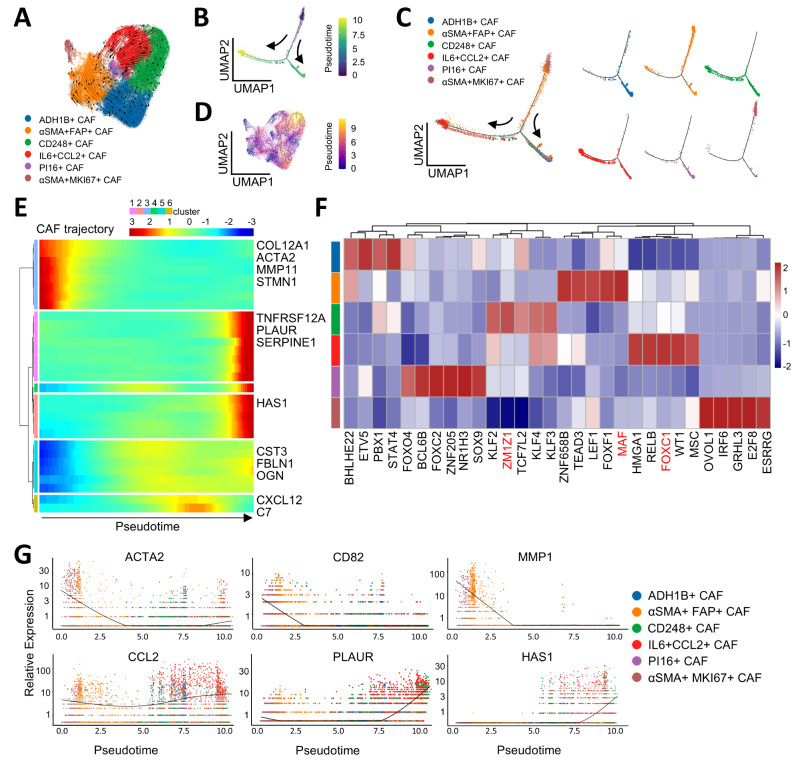
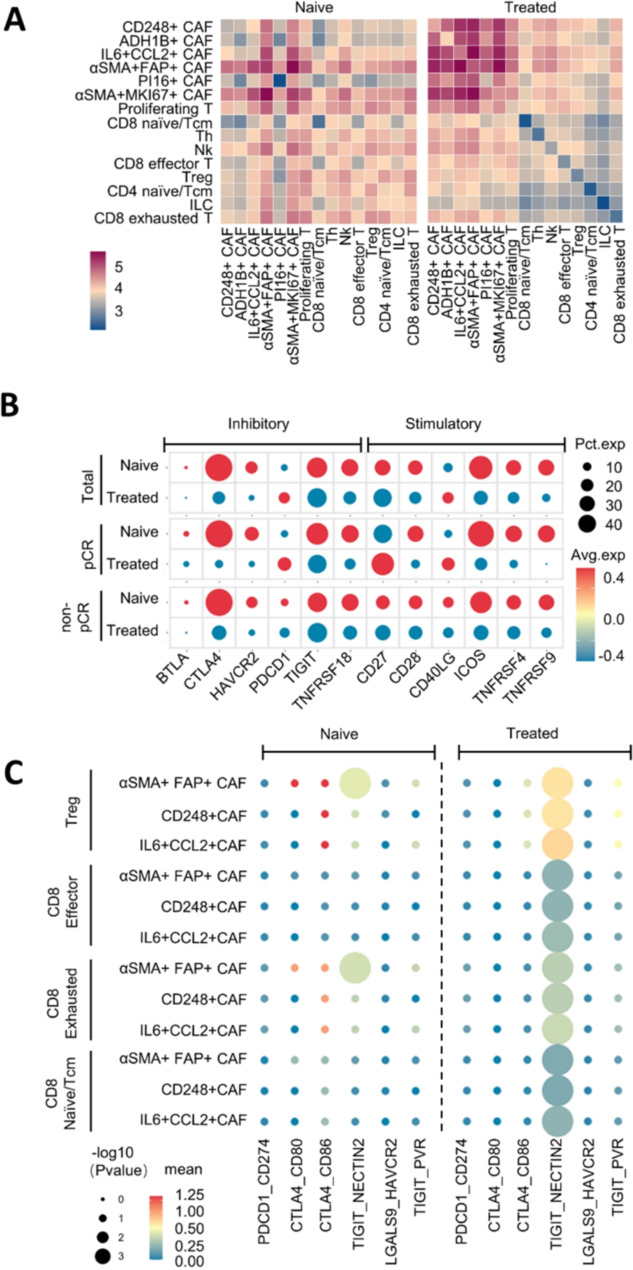
Novel neoadjuvant immunotherapy combined with chemotherapy (neoICT) has improved outcomes for patients with esophageal squamous-cell carcinoma (ESCC), but challenges persist in low response rates and therapy resistance. Little is known about the intra-tumoral heterogeneity in the ESCC tumor microenvironment (TME) that underlies differential responses to neoadjuvant therapy. We applied single-cell RNA sequencing (scRNA-seq) profiling and multiplexed immunofluorescence staining to thoroughly decipher the TME in ESCC specimens from a neoadjuvant anti-PD1 combination therapy clinical trial. The cancer-associated fibroblasts (CAFs) population showed the significant alteration in abundance following neoadjuvant therapy. Specifically, IL6 + CCL2 + immunomodulatory CAFs and a novel CD248 + mechanoresponsive CAFs subset exhibited increasing infiltration. Mechanistically, CD248 + mechanoresponsive CAFs approached and lined the tumor nest to physically block the infiltration of CD8 + T cells and drug delivery, while IL6 + CCL2 + immunomodulatory CAFs induced therapeutic resistance with distinct IL-6 expression. Among patients treated with neoICT, we observed prominent CAF-T cell interactions. In particular, the NECTIN2-TIGIT ligand-receptor pair was enriched in treated samples, and TIGIT was identified as the major inhibitory checkpoint of T cells. Our findings demonstrate distinct alterations in TME constituent responses to neoadjuvant immunotherapy and identify functional phenotypes of CAFs associated with unfavorable therapeutic responses in patients. This provides potential targets to enhance responses to neoadjuvant therapy in ESCC.

Keywords: Cancer-associated fibroblasts; Esophageal squamous-cell carcinoma; Neoadjuvant immunochemotherapy; Tumor microenvironment; scRNA-seq.


Conflict of interest statement

The authors declare no competing interests.

Figures

Fig. 1
Fig. 1
Overview of ESCC ecosystem characterized by scRNA-seq. (A) Workflow depicting sample acquisition, processing, and analysis. TME, tumor microenvironment; CAF, cancer-associated fibroblast; FFPE, formalin-fixed paraffin-embedded. (B) Clinicopathologic characteristics for each patient sample including treatment status, stage, and procedure. EUS, endoscopic ultrasound. (C) UMAP embedding of the expression profile of 41 samples, including 17 treatment-naïve endoscopic biopsies and 24 post-neoadjuvant combination therapy surgical resected specimens. Distinct clusters are annotated and color-coded. UMAP uniform manifold approximation and projection. (D) UMAP embedding of single-nucleus profiles of 232,710 cells. EC endothelial cell, MP, mononuclear phagocyte. Color coded by major cell type. (E) Heatmap of the five most differentially expressed genes within each cluster. (F) Expression levels of selected known marker genes across 232,710 unsorted cells illustrated in UMAP plots from both normal and tumor tissue in treatment-naïve and treated ESCC patients. (G) 11 cell types distributions stratified by treatment status, tissue type and pathological response across 41 samples. Proportions (y axis) of cell subsets (color legend, shared with panel A) across naive (n = 17) (left) versus treated (n = 24) (right). (H) UMAP embeddings (left) and the proportion of each cluster (right) stratified by treatment status and tissue type. N_B, normal tissues in treatment-naïve samples, T_B, tumor tissues in naïve samples, N_A, normal tissues in treated samples, T_A, tumor tissues in treated samples. Color legend, shared with panel A. Source data are provided as a Source Data file
Fig. 2
Fig. 2
The cellular heterogeneity of mononuclear phagocytes compartment within the tumor microenvironment of ESCC pre- and post-neoICT. (A) UMAP plot of sub-clusters of mononuclear phagocytes (left). The proportion of each cluster split by treatment status and tissue type (right). pDC, plasmacytoid DC; cDC, conventional DC; Mono, monocytic cell. (B) Comparison of mononuclear phagocytes clusters of adjacent normal (N) vs. Tumor (T) in naïve samples by Mann-Whitney U test, * P < 0.05. (C) Comparison of cDC2% stratified by tissue type and treatment status by Wilcoxon matched-paired signed rank test, ** P < 0.01. 5 paired naïve patients, 12 paired treated patients with adjacent normal and tumor tissue. (D) Comparison of mononuclear phagocytes cluster proportions in naïve and treated samples (left), P values determined by Mann-Whitney U test. Comparison of cDC2% in 6 paired naïve and treated patients (right) by Wilcoxon matched-paired signed rank test, * P < 0.05. (E) Comparison of mononuclear phagocytes cluster proportions in differential pathological response by Mann-Whitney U test. pCR complete pathological response. (F) UMAP plot of 7 clusters of macrophages. (G) UMAP embedding of 7 macrophage clusters stratified by treatment and tissue type (color legend shared with panel F). (H) The STARTRAC-dist index of each cluster in tumor split by treatment status, in which Ro/e denoted the ratio of observed to expected cell number. T_B, tumor tissues in naïve samples; T_A, tumor tissues in treated samples. (I) Comparison of selected macrophage clusters in 6 paired naïve and treated tumor samples by Wilcoxon matched-paired signed rank test, * P < 0.05. (J) Comparison of macrophage cluster percent in naïve and treated tumor samples by Mann-Whitney U test, **** P < 0.0001. (K) The STARTRAC-dist index of each cluster in treated split by pathological response. Source data are provided as a Source Data file. (L) Kaplan-Meier survival curves of MT1G TAM gene signature in ESCA of TCGA dataset
Fig. 3
Fig. 3
Cancer-associated fibroblast heterogeneity in ESCC. (A) UMAP visualization of 6 clusters of 26,962 fibroblast. (B) UMAP embedding of single-nucleus profiles in 41 nonmalignant and tumor samples. (C) Heatmap showing the expression of top 10 most variable genes across each fibroblast subset (upper panel), color legends as in panel A. The fraction of each fibroblast subset in nonmalignant and tumor samples (lower panel). T, tumor tissue; N, adjacent normal tissue. (D) Violin plots showing the expression of selected genes in each fibroblast subset. Color legends as in panel A. (E) FFPE ESCC sections were stained for fibroblast markers identified in scRNAseq results. Scale bars = 50 μm (upper), 20 μm (lower). Source data are provided as a Source Data file
Fig. 4
Fig. 4
NeoICT modulation of CAF contexture within the tumor microenvironment of ESCC. (A) UMAP embedding (left) and the proportion (right) of 6 CAF clusters stratified by treatment and tissue type. N_B, normal tissues in treatment-naïve samples; T_B, tumor tissues in naïve samples; N_A, normal tissues in treated samples; T_A, tumor tissues in treated samples. (B) CAF clusters distribution in total naïve and treated tumor specimens estimated by the STARTRAC-dist index, cluster color legend shared with panel A. (C) Comparison of 6 CAF clusters population in 6 paired naïve and treated patients. P values determined by Wilcoxon signed-rank test, *P < 0.05; ns, no significance. (D) Representative images and quantification of mfIHC staining of αSMA + FAP + CAF in pre- and post-neoICT. Scale bars = 200 μm, n = 10, ****, P < 0.0001, Mann-Whitney U test. (E) Representative images of Masson’s trichrome and ACTA2 staining of αSMA + FAP + CAF in pre- and post-neoICT. Scale bars = 100 μm. (F) Representative images and quantification of mfIHC staining of CD248 + CAF in pCR and non-pCR. Scale bars = 500 μm, n = 10, ****, P < 0.0001, Mann-Whitney U test. (G) Representative images and quantification of distance between CD248 + CAF and tumor cell. Scale bars = 200 μm. (H) Representative images showing the protective niche formation of CD248 + CAF for tumor cell. Scale bars = 50 μm. (I) Representative images and quantification of mfIHC staining IL6 + CCL2 + CAF in pCR and non-pCR treated group. Scale bars = 500 μm, n = 10, ****, P < 0.0001, Mann-Whitney U test. Source data are provided as a Source Data file
Fig. 5
Fig. 5
Trajectory analysis of CAF. (A) Grid visualization for RNA velocity analysis of CAF subtypes. (B) Pseudotime trajectories (Monocle2) for CAF, showing two trajectories. (C) Pseudotime trajectories for each CAF. (D) Visualization of Monocle3 analysis of CAF subtypes. (E) Gene expression dynamics along the CAF trajectory. Genes cluster into six gene sets, each characterized by specific expression profiles, as depicted by a selection of marker genes characteristic for each cluster. (F) Heatmap showing the relative expression (z-score) of top five transcription factor in each CAF cluster. Color as in (A). (G) A scatter distribution plot showing expression levels of CAF cluster marker genes in pseudotiome order. The color of the dots shows the cluster type of CAF
Fig. 6
Fig. 6
Characterization of CD8 + T cells in pre- and post-neoIRT ESCC. (A) UMAP embeddings (left) and proportion comparison (right) of T clusters stratified by treatment and tissue type. N_B, normal tissues in treatment-naïve samples; T_B, tumor tissues in naïve samples; N_A, normal tissues in treated samples; T_A, tumor tissues in treated samples. Tcm, the central memory; ILC, innate lymphoid cell. (B) T cell-type distributions stratified by treatment, tissue type and pathological response across 41 samples. Proportions (y axis) of cell subsets (color legend, shared with panel A) across naive (n = 17) (left) versus treated (n = 24) (right). (C) Heatmap of STARTRAC-dist index of each T cluster split by treatment status. (D) Comparison of seleted T clusters in 6 paired naïve and treated tumor samples by Wilcoxon matched-paired signed rank test, * P < 0.05. (E) Heatmap of STARTRAC-dist index of each T cluster split by treatment status and pathological response. (F) CD4:CD8, CD4:Treg, CD8 effector: exhausted and CD8 effector: Treg ratios stratified by treatment status. P values determined by Mann-Whitney test. (G) UMAP embeddings overlaid with selected signature module scores and distributions of module scores stratified by chemotherapy treatment. Source data are provided as a Source Data file
Fig. 7
Fig. 7
Characterization of checkpoint molecules and ligand-receptor interactions in naïve and treated group in ESCC. (A) Clustered heatmap showing two-sided Spearman correlation coefficients between all CAF clusters and T clusters in tumor samples. Left: untreated samples, right: treated samples. (B) Differential gene expression of inhibitory and stimulatory checkpoint molecules in CD8 + T cells between treated and untreated samples. (C) Dotplots of CellphoneDB output (see Methods) showing significance (-log10 P value) and strength (mean value) of checkpoint molecule ligand-receptor interactions between CAF and T cells comparing untreated and treated samples. Source data are provided as a Source Data file

References

    1. Sung H, Ferlay J, Siegel RL, Laversanne M, Soerjomataram I, Jemal A, et al. Global Cancer statistics 2020: GLOBOCAN estimates of incidence and Mortality Worldwide for 36 cancers in 185 countries. Cancer J Clin. 2021;71(3):209–49. 10.3322/caac.21660. - PubMed
    1. Pennathur A, Gibson MK, Jobe BA, Luketich JD. Oesophageal carcinoma. Lancet (London England). 2013;381(9864):400–12. 10.1016/s0140-6736(12)60643-6. - PubMed
    1. Arnold M, Ferlay J, van Berge Henegouwen MI, Soerjomataram I. Global burden of oesophageal and gastric cancer by histology and subsite in 2018. Gut. 2020;69(9):1564–71. 10.1136/gutjnl-2020-321600. - PubMed
    1. Doki Y, Ajani JA, Kato K, Xu J, Wyrwicz L, Motoyama S, et al. Nivolumab Combination Therapy in Advanced Esophageal squamous-cell carcinoma. N Engl J Med. 2022;386(5):449–62. 10.1056/NEJMoa2111380. - PubMed
    1. Kato K, Cho BC, Takahashi M, Okada M, Lin CY, Chin K, et al. Nivolumab versus chemotherapy in patients with advanced oesophageal squamous cell carcinoma refractory or intolerant to previous chemotherapy (ATTRACTION-3): a multicentre, randomised, open-label, phase 3 trial. Lancet Oncol. 2019;20(11):1506–17. 10.1016/s1470-2045(19)30626-6. - PubMed

LinkOut - more resources