. 2024 Sep 3;13(9):1073.
doi: 10.3390/antiox13091073.

Challenging Sarcopenia: Exploring AdipoRon in Aging Skeletal Muscle as a Healthspan-Extending Shield

Affiliations

Challenging Sarcopenia: Exploring AdipoRon in Aging Skeletal Muscle as a Healthspan-Extending Shield

Camille M Selvais et al. Antioxidants (Basel). .

Abstract

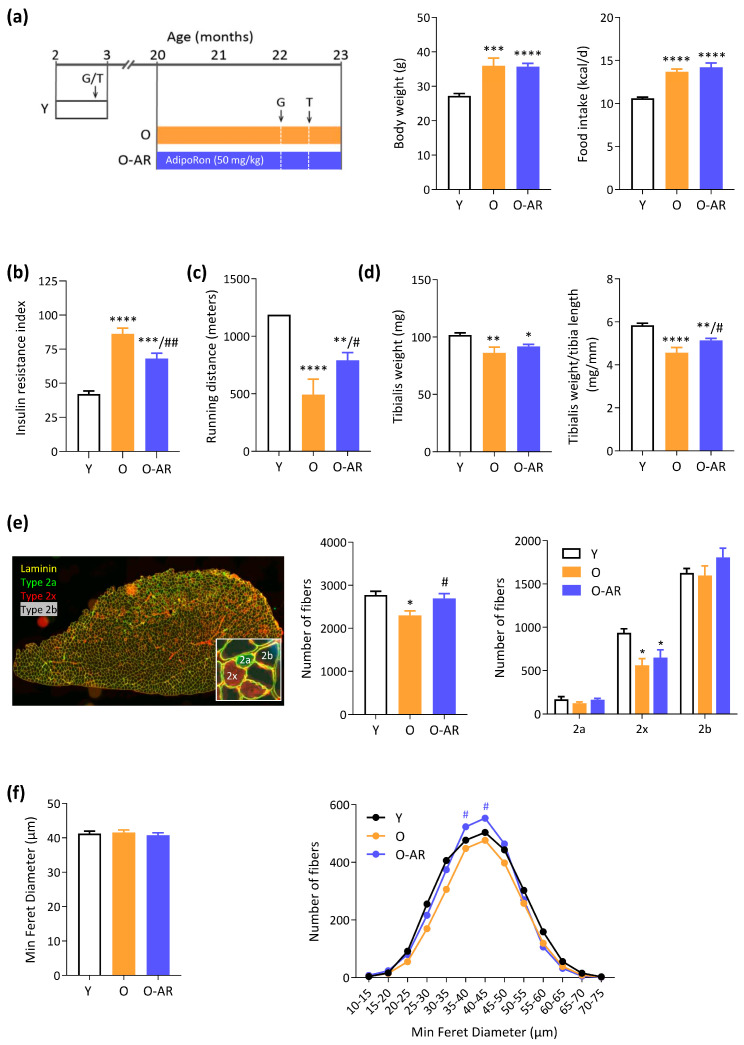
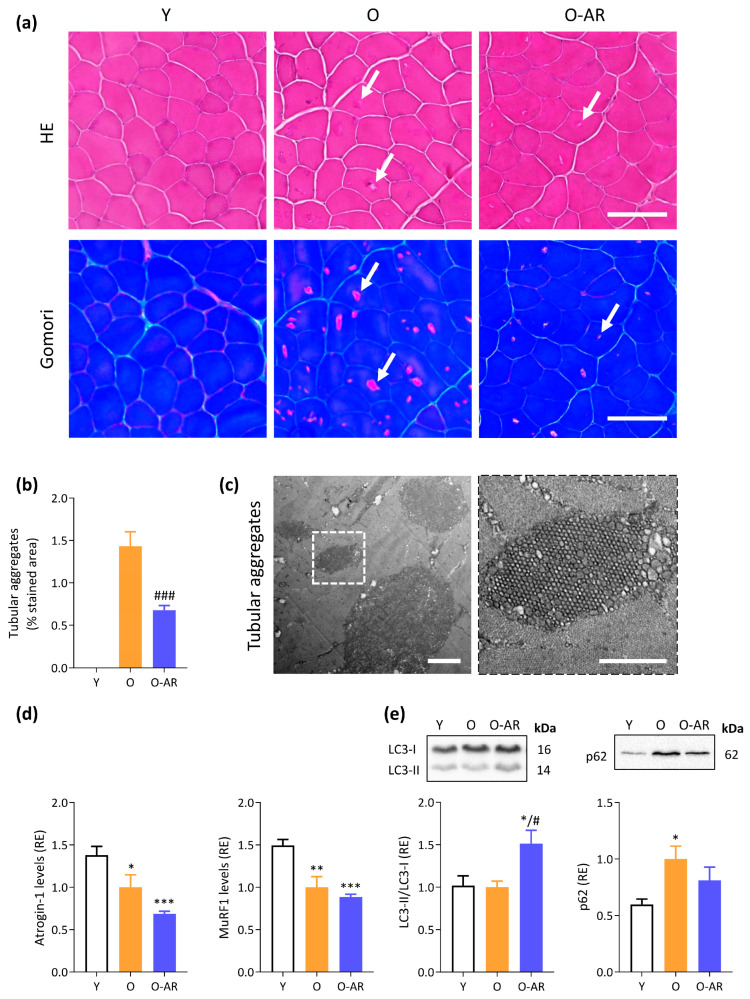
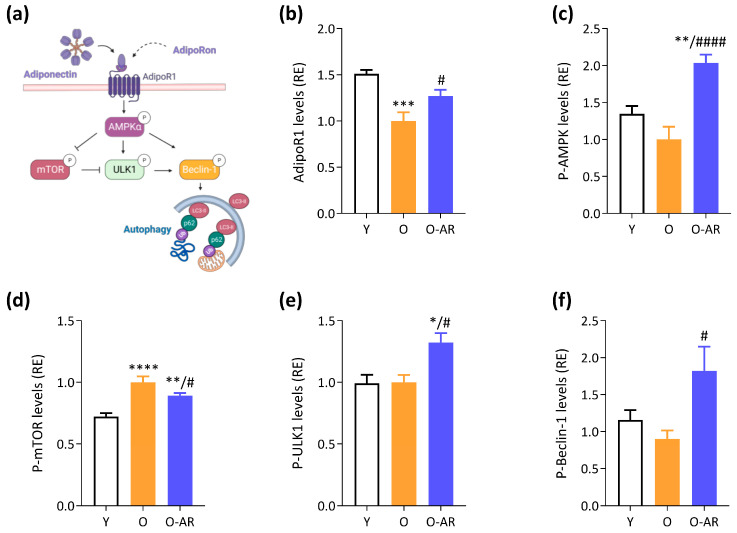
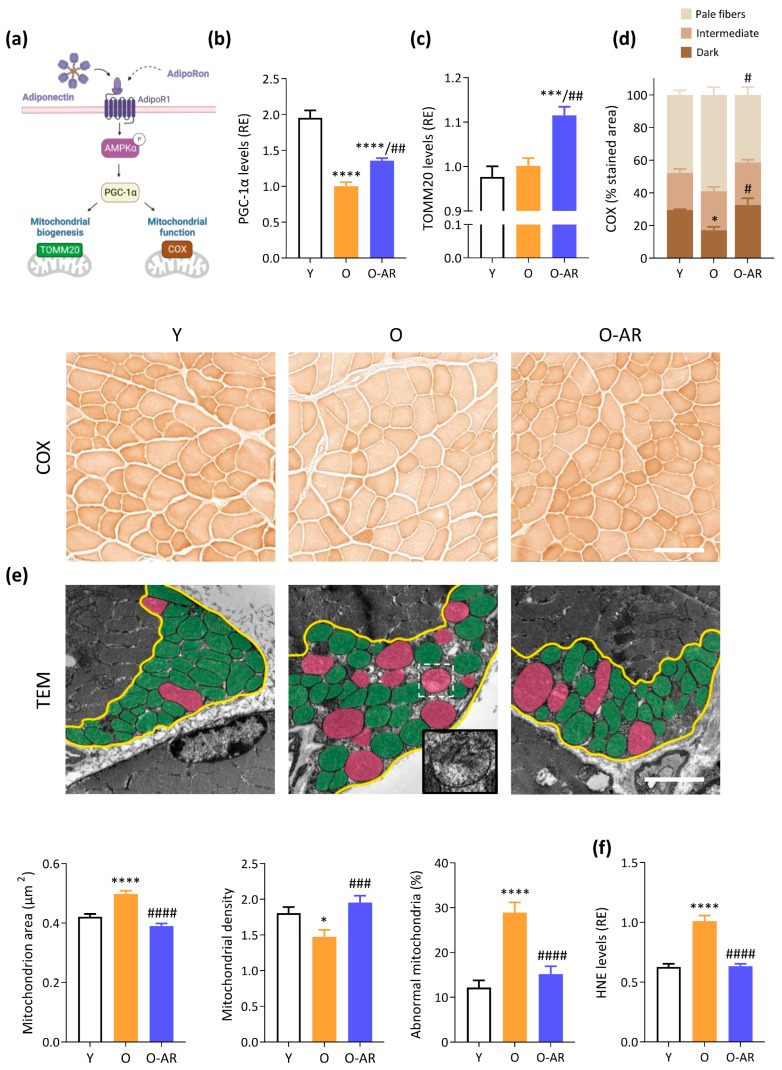
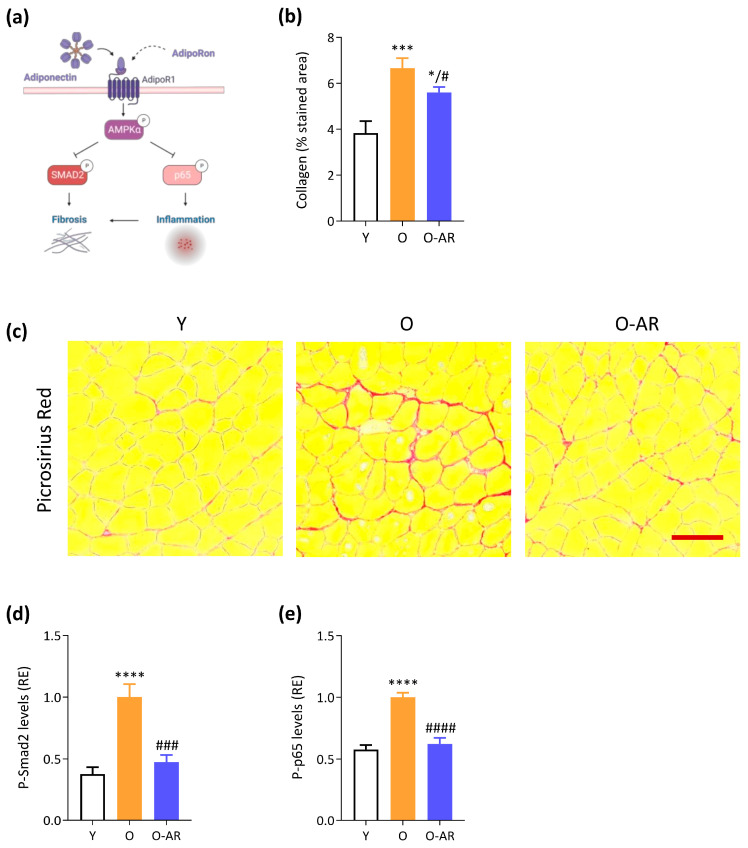
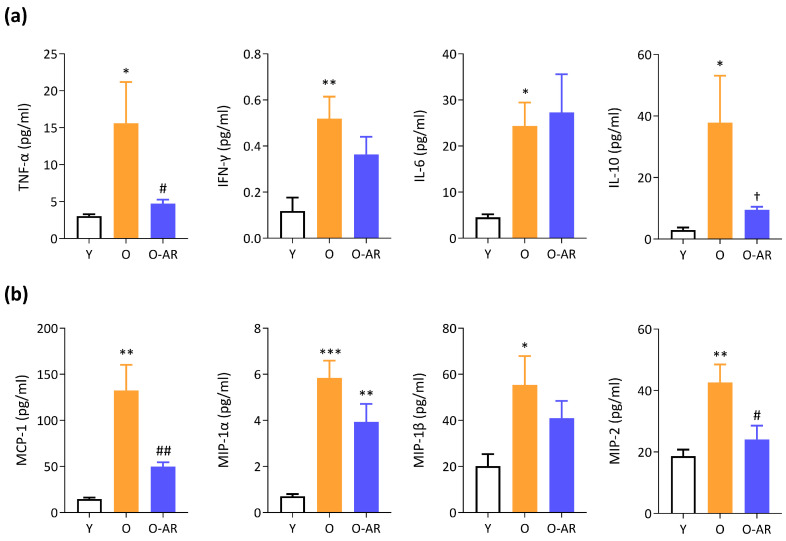
Sarcopenia, characterized by loss of muscle mass, quality, and function, poses significant risks in aging. We previously demonstrated that long-term treatment with AdipoRon (AR), an adiponectin receptor agonist, alleviated myosteatosis and muscle degeneration in middle-aged obese mice. This study aimed to determine if a shorter AR treatment could effectively offset sarcopenia in older mice. Two groups of old mice (20-23 months) were studied, one untreated (O) and one orally-treated with AR (O-AR) at 50 mg/kg/day for three months, compared with control 3-month-old young mice (Y) or 10-month-old young-adult mice (C-10). Results showed that AR remarkably inversed the loss of muscle mass by restoring the sarcopenia index and fiber count, which were greatly diminished with age. Additionally, AR successfully saved muscle quality of O mice by halving the accumulation of tubular aggregates and aberrant mitochondria, through AMPK pathway activation and enhanced autophagy. AR also bolstered muscle function by rescuing mitochondrial activity and improving exercise endurance. Finally, AR markedly curbed muscle fibrosis and mitigated local/systemic inflammation. Thus, a late three-month AR treatment successfully opposed sarcopenia and counteracted various hallmarks of aging, suggesting AR as a promising anti-aging therapy for skeletal muscles, potentially extending healthspan.

Keywords: AMPK; abnormal mitochondria; adiponectin; adiponectin agonist; autophagy; sarcopenia; tubular aggregates.


Conflict of interest statement

The authors declare no conflicts of interest.

Figures

Figure 1
Figure 1
AdipoRon reduces insulin resistance, improves endurance, and attenuates sarcopenia in O mice. (a) Experimental protocol. Three groups of mice were studied. Two groups were studied from 20 months to 23 months of age and are referred to as old (O) mice. One of the two groups was orally treated with AdipoRon (AR) (50 mg/kg/day; O-AR), while the other one was left untreated (O). An additional group of young (3-months-old) mice was also used for comparison. At the indicated times, fasting glycemia was measured (G) and mice were submitted to treadmill exhaustion test (T). Body weight at the end of the protocol and average food consumption over the whole study. (b) Insulin resistance index calculated as Insulin (ng/mL) × Glycemia (mg/dL). (c) Running distance covered (m) in an uphill treadmill exhaustion test. (d) Tibialis anterior weight and the sarcopenia index, calculated as TA muscle weight normalized to tibia length. (e) Fiber typing was carried out by immunofluorescence staining of different MyHCs on a transversal cross-section of TA muscle. Type 1 fibers were labeled in blue (none), type 2a in green, and 2x in red while 2b were nonlabeled (black). A laminin antibody was used to delineate the basal membrane (yellow). Total number of fibers and number of each fiber type. (f) Global fiber size based on the Minimum Feret Diameter and fiber size distribution. All these data were quantified on whole cross-sections of TA. Data are means ± SEM for 6 Y, 6 O, and 6–9 O-AR. Statistical analysis was performed using one-way ANOVA followed by Tukey’s test to compare the three groups of mice. * p < 0.05, ** p < 0.01, *** p < 0.001, **** p < 0.0001 vs. Y mice. # p < 0.05, ## p < 0.01 vs. O mice.
Figure 2
Figure 2
AdipoRon reduces age-related accumulation of tubular aggregates (TAgs). (a) TAgs (indicated by arrows) appear as pale or slightly basophilic inclusions with hematoxylin–eosin (HE) and bright pink ones with Gomori Trichrome on serial transversal cross-sections of TA from the three groups of mice (Y, O, and O-AR). Scale bars = 100 µm. (b) Quantification of TAg abundance after Gomori Trichrome was expressed as a % of stained area (i.e., bright pink inclusions areas normalized to the cross-sectional area of the muscle). (c) Characteristic honeycomb appearance of TAgs by transmission electron microscopy. Scale bar = 2 µm, Inset: higher magnification of a honeycomb TAg (scale bar = 1 µm). (d) Protein levels of Atrogin-1 and MURF1 were measured by ELISA. (e) LC3-II/LC3-I ratio and p62 were analyzed by Western blotting. p62 levels were normalized to Ponceau S staining (shown in Figure S4c,d). Results are presented as relative expression compared to O values (d,e). Data are means ± SEM for 6 Y, 6 O, and 9 O-AR. Statistical analysis was performed using unpaired two-tailed t-test to compare O and O-AR (b) or one-way ANOVA followed by Tukey’s test to compare the 3 groups of mice (d,e). * p < 0.05, ** p < 0.01, *** p < 0.001 vs. Y mice. # p < 0.05, ### p < 0.001 vs. O mice.
Figure 3
Figure 3
AdipoRon activates the AMPK pathway and promotes autophagy. (a) Proposed model for the effects of AdipoRon. Briefly, AdipoRon binds to AdipoR1 and activates the AMPK. AMPK plays a pivotal role in initiating autophagy by activating ULK1 and Beclin1, two critical regulators of the autophagic process. AMPK also exerts its regulatory influence by inhibiting mTOR, thereby alleviating mTOR-mediated inhibition of ULK1. LC3-II and p62 are two important proteins in the autophagy process. Pointed arrows indicate activation, while blunt arrows indicate inhibition. (b) AdipoR1 protein levels were measured by ELISA. Phosphorylated and active forms of (c) AMPKα (P-AMPK), (d) mTOR (P-mTOR), (e) ULK1 (P-ULK1), and (f) Beclin-1 (P-Beclin-1) were quantified by ELISA. Absorbance data were presented as relative expression compared with O values. Data are means ± SEM for 6 Y, 6 O, and 9 O-AR. Statistical analysis was performed using one-way ANOVA followed by Tukey’s test to compare the 3 groups of mice. * p < 0.05, ** p < 0.01, *** p < 0.001, **** p < 0.0001 vs. Y mice. # p < 0.05, #### p < 0.0001 vs. O mice.
Figure 4
Figure 4
AdipoRon enhances mitochondrial biogenesis and function. (a) Activation of the AMPK-PGC-1α signaling pathway by ApN stimulate mitochondrial biogenesis and function. TOMM20 is a marker of mitochondrial content, while COX activity reflects mitochondrial activity. Pointed arrows indicate activation or induction. (b) PGC-1α and (c) TOMM20 protein levels quantified by ELISA. (d) Quantification of COX activity in the TA from the three groups of mice (Y, O and O-AR) based on histochemistry staining, for which representative transversal cross-sectional images are shown after. Three staining intensities were defined as pale, intermediate, or dark, with the darkest color being associated with the highest activity. Activity was expressed as % of stained area (i.e., colored areas normalized to the cross-sectional area of the muscle). Scale bar = 100 µm. (e) Transmission electron micrographs (TEM) of mitochondria in the subsarcolemmal region of G (transversal cross-sections) in the 3 groups of mice (Y, O, and O-AR). The yellow line delimits the subsarcolemmal area. Abnormal mitochondria are false-colored in pink, while normal mitochondria are colored in green. Representative images of each group are shown. Scale bar = 2 µm. The mitochondrion area and the number of mitochondria per µm2 in the subsarcolemmal region were calculated based on TEM images. The percentage of abnormal mitochondria out of the total number of mitochondria was also calculated. In total, 1117, 1604, and 1435 subsarcolemmal mitochondria were sampled for Y, O, and O-AR group, respectively. (f) HNE protein levels were quantified by ELISA. (b,c,f) Absorbance data were presented as relative expression compared with O values. Data are means ± SEM for 6 Y, 6 O, and 9 O-AR (bd,f). Statistical analysis was performed using one-way ANOVA followed by Tukey’s test to compare the 3 groups of mice. * p < 0.05, *** p < 0.001, **** p < 0.0001 vs. Y mice. # p < 0.05, ## p < 0.01, ### p < 0.001, #### p < 0.0001 vs. O mice.
Figure 5
Figure 5
AdipoRon limits age-related fibrosis and inflammation. (a) Activation of the AMPK signaling pathway by ApN represses SMAD2 activity, an effector protein of the TGF-β pathway, and NF-κB activity (p65 subunit). Pointed arrows indicate activation, while blunt arrows indicate inhibition. (b) Quantification of picrosirius red expressed as a % of the collagen stained area, for which representative transversal cross-sectional images are shown in (c), scale bar = 100 µm. The active, phosphorylated forms of (d) SMAD2 (P-SMAD2) and (e) p65-subunit of NF-κB (P-p65) were measured by ELISA. Absorbance data were presented as relative expression compared with O values. Data are means ± SEM for 6 Y, 6 O, and 9 O-AR. Statistical analysis was performed using one-way ANOVA followed by Tukey’s test to compare the 3 groups of mice. * p < 0.05, *** p < 0.001, **** p < 0.0001 vs. Y mice. # p < 0.05, ### p < 0.001, #### p < 0.0001 vs. O mice.
Figure 6
Figure 6
AdipoRon partially protects against age-related systemic inflammation. (a,b) A multiplex assay was performed to measure the concentrations of different cytokines (a) and chemokines (b) in the plasma of the three groups of mice. These can serve as markers of inflammaging/senescence associated secretory phenotype (SASP). Data are means ± SEM for 6 Y, 6 O, and 9 O-AR. Statistical analysis was performed using one-way ANOVA followed by Tukey’s test to compare the 3 groups of mice. * p < 0.05, ** p < 0.01, *** p < 0.001 vs. Y mice. † p = 0.07, # p < 0.05, ## p < 0.01 vs. O mice.

References

    1. Cruz-Jentoft A.J., Sayer A.A. Sarcopenia. Lancet. 2019;393:2636–2646. doi: 10.1016/S0140-6736(19)31138-9. - DOI - PubMed
    1. Abou-Samra M., Selvais C.M., Dubuisson N., Brichard S.M. Adiponectin and Its Mimics on Skeletal Muscle: Insulin Sensitizers, Fat Burners, Exercise Mimickers, Muscling Pills … or Everything Together? Int. J. Mol. Sci. 2020;21:2620. doi: 10.3390/ijms21072620. - DOI - PMC - PubMed
    1. Abou-Samra M., Selvais C.M., Dubuisson N., Brichard S.M. Involvement of adiponectin in the pathogenesis of dystrophinopathy. Skelet Muscle. 2015;5:25. doi: 10.1186/s13395-015-0051-9. - DOI - PMC - PubMed
    1. Otabe S., Yuan X., Fukutani T., Wada N., Hashinaga T., Nakayama H., Hirota N., Kojima M., Yamada K. Overexpression of human adiponectin in transgenic mice results in suppression of fat accumulation and prevention of premature death by high-calorie diet. Am. J. Physiology. Endocrinol. Metab. 2007;293:E210–E218. doi: 10.1152/ajpendo.00645.2006. - DOI - PubMed
    1. Li N., Zhao S., Zhang Z., Zhu Y., Gliniak C.M., Vishvanath L., A An Y., Wang M.-Y., Deng Y., Zhu Q., et al. Adiponectin preserves metabolic fitness during aging. eLife. 2021;10:e65108. doi: 10.7554/eLife.65108. - DOI - PMC - PubMed

LinkOut - more resources