. 2024 Sep 3;13(9):1074.
doi: 10.3390/antiox13091074.

Unraveling the Protective Role of Oleocanthal and Its Oxidation Product, Oleocanthalic Acid, against Neuroinflammation

Affiliations

Unraveling the Protective Role of Oleocanthal and Its Oxidation Product, Oleocanthalic Acid, against Neuroinflammation

Maria Cristina Barbalace et al. Antioxidants (Basel). .

Abstract

Neuroinflammation is a critical aspect of various neurodegenerative diseases, such as Alzheimer's and Parkinson's diseases. This study investigates the anti-neuroinflammatory properties of oleocanthal and its oxidation product, oleocanthalic acid, using the BV-2 cell line activated with lipopolysaccharide. Our findings revealed that oleocanthal significantly inhibited the production of pro-inflammatory cytokines and reduced the expression of inflammatory genes, counteracted oxidative stress induced by lipopolysaccharide, and increased cell phagocytic activity. Conversely, oleocanthalic acid was not able to counteract lipopolysaccharide-induced activation. The docking analysis revealed a plausible interaction of oleocanthal, with both CD14 and MD-2 leading to a potential interference with TLR4 signaling. Since our data show that oleocanthal only partially reduces the lipopolysaccharide-induced activation of NF-kB, its action as a TLR4 antagonist alone cannot explain its remarkable effect against neuroinflammation. Proteomic analysis revealed that oleocanthal counteracts the LPS modulation of 31 proteins, including significant targets such as gelsolin, clathrin, ACOD1, and four different isoforms of 14-3-3 protein, indicating new potential molecular targets of the compound. In conclusion, oleocanthal, but not oleocanthalic acid, mitigates neuroinflammation through multiple mechanisms, highlighting a pleiotropic action that is particularly important in the context of neurodegeneration.

Keywords: 14-3-3 protein family; ACOD1; BV-2 microglial cells; TLR4; clathrin; gelsolin; lipopolysaccharide; neuroinflammation; oleocanthal; oleocanthalic acid.


Conflict of interest statement

The authors declare no conflicts of interest.

Figures

Figure 1
Figure 1
Viability of BV-2 cells treated with different concentrations of OL and OA. BV-2 cells were exposed to increasing concentrations of OL (A) and OA (B) (1–10–50–100 µM) for 24 h, and cell viability was evaluated by MTT assay. Data are represented as % of CTRL. Each bar represents means ± SEM of three independent experiments (six units per group). Data were analyzed using one-way ANOVA followed by Dunnett’s test. * p < 0.05 vs. CTRL.
Figure 2
Figure 2
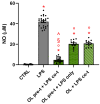
NO levels in BV-2 cells exposed to different concentrations of OL and OA. BV-2 cells were pre-treated for 2 h with increasing concentrations of OL and OA (0.1–1–5–10 µM) and then co-treated with 100 ng/mL LPS for 24 h. NO release was quantified by the Griess reagent. Data are represented as µM of NO released in the culture medium. Each bar represents means ± SEM of at least three independent experiments (two units per group). Data were analyzed by one-way ANOVA followed by Tukey’s test. * p < 0.05 vs. CTRL; ° p < 0.05 vs. LPS.
Figure 3
Figure 3
Cytoprotective effect of OL in LPS-activated BV-2 cells. BV-2 cells were pre-treated for 2 h with 10 µM of OL and OA and then co-exposed to 100 ng/mL of LPS for 24 h. Cell viability was evaluated by MTT assay (A), as reported in Materials and Methods. Data are represented as % of CTRL. As reported in Materials and Methods, representative cell morphology images were taken using the microscope Eclipse Ti-E (B). Each bar represents means ± SEM of five independent experiments (six units per group). Data were analyzed by one-way ANOVA followed by Tukey’s test. * p < 0.05 vs. CTRL; ° p < 0.05 vs. LPS.
Figure 4
Figure 4
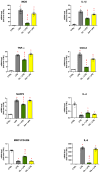
Gene expression of pro- and anti-inflammatory mediators in LPS-treated BV-2 cells. BV-2 cells were pre-treated for 2 h with 10 µM of OL and OA and then co-exposed to 100 ng/mL of LPS for 24 h. mRNA levels were quantified by RT-PCR as reported in Materials and Methods. Data are represented as fold-over control cells. Each bar represents means ± SEM of three independent experiments (at least two units per group). Data were analyzed by one-way ANOVA followed by Tukey’s test. * p < 0.05 vs. CTRL; ° p < 0.05 vs. LPS; and § p < 0.05 vs. OA + LPS.
Figure 5
Figure 5
iNOS, NLRP3, and COX-2 protein expression in LPS-treated BV-2 cells. BV-2 cells were pre-treated for 2 h with 10 µM of OL and OA and then co-exposed to 100 ng/mL of LPS for 24 h. Protein expression was analyzed by Western immunoblotting as reported in Materials and Methods. Representative images and densitometric values are shown. The relative bands were normalized to the intensity of the corresponding β-actin band. Each bar represents means ± SEM of four independent experiments (one unit per group). Data were analyzed by one-way ANOVA followed by Tukey’s test. * p < 0.05 vs. CTRL; ° p < 0.05 vs. LPS.
Figure 6
Figure 6
Modulation of the phagocytic capacity by oleocanthal in LPS-activated BV-2 cells. Cells were pre-treated for 2 h with 10 µM of OL and OA and then co-exposed to 100 ng/mL of LPS for 24 h. FITC-dextran fluorescence intensity was determined by flow cytometry, as reported in Materials and Methods. Each bar represents means ± SEM of three independent experiments (one unit per group). Data were analyzed by one-way ANOVA followed by Tukey’s test. * p < 0.05 vs. CTRL and ° p < 0.05 vs. LPS.
Figure 7
Figure 7
Effect of oleocanthal and oleocanthalic acid on ROS and GSH levels. BV-2 cells were pre-treated for 2 h with 10 µM of OL and OA and then exposed to 100 ng/mL of LPS for 24 h. Intracellular ROS levels were measured using the peroxide-sensitive probe, while DCFH-DA and GSH levels were measured using the fluorescent probe MCB, as reported in Materials and Methods. Each bar represents the mean ± SEM of four independent experiments (10 units per group). Panel (A) shows the intracellular ROS levels; Panel (B) shows GSH levels. Data were analyzed by one-way ANOVA followed by Tukey’s test. * p < 0.05 with respect to CTRL; ° p < 0.05 with respect to LPS; and § p < 0.05 vs. OA + LPS.
Figure 8
Figure 8
Modulation of NF-κB transcription factor. BV-2 cells were pre-treated for 2 h with 10 µM of OL and OA and then exposed to 100 ng/mL of LPS for 24 h. Samples have been processed for protein expression analysis as reported in Materials and Methods. Each bar represents the mean ± SEM of three independent experiments (one unit per group). Panel (A) shows the protein expression of p-NF-κB and NF-κB; Panel (B) shows the cytosolic and nuclear expression of NF-κB. Data were analyzed by one-way ANOVA followed by Tukey’s test. * p < 0.05 with respect to CTRL and ° p < 0.05 with respect to LPS.
Figure 9
Figure 9
TLR4 and CD14 surface expression of BV-2 cells. BV-2 cells were pre-treated for 2 h with 10 µM of OL and OA and then exposed to 100 ng/mL of LPS for 24 h. Surface expression of TLR4 and CD14 was determined by flow cytometry, as reported in Materials and Methods. Each bar represents the mean ± SEM of three independent experiments (one unit per group). Panel A shows the surface expression of TLR4; Panel B shows the surface expression of CD14. Data were analyzed by one-way ANOVA followed by Tukey’s test. * p < 0.05 with respect to CTRL and ° p < 0.05 with respect to LPS.
Figure 10
Figure 10
ERK 1/2, p38 MAPKs, and protein kinase Akt modulation by OL and OA on LPS-activated BV-2 cells. BV-2 cells were pre-treated for 2 h with 10 µM of OL and OA and then co-exposed to 100 ng/mL of LPS for 1 h or 24 h. Immunoblotting was performed using the total and the phosphorylated forms of anti-ERK1/2, anti-p38, and anti-Akt. Each bar represents means ± SEM of at least four independent experiments (one unit per group). Panel (A) shows the phosphorylation of ERK 1/2, p38 MAPKs, and protein kinase Akt after 1 h of LPS stimulation; Panel (B) shows the phosphorylation of ERK 1/2, p38 MAPKs, and protein kinase Akt after 24 h of LPS stimulation. Data were analyzed by one-way ANOVA followed by Tukey’s test. * p < 0.05 with respect to CTRL and ° p < 0.05 with respect to LPS.
Figure 11
Figure 11
NO release after different timing sets of OL treatment on LPS-stimulated BV-2 cells. BV-2 cells were pre-treated for 2 h with 10 µM of OL, and then 100 ng/mL of LPS were added for 24 h (OL pre-t. + LPS co-t.); BV-2 cells were pre-treated for 2 h with 10 µM of OL, and 100 ng/mL of LPS were added for 24 h after changing the medium (OL pre-t. + LPS only); BV-2 cells were simultaneously exposed to 10 µM of OL and 100 ng/mL of LPS for 26 h (OL + LPS co-t.); NO release was quantified by the Griess reagent. Data are represented as µM of NO released in the culture medium. Each bar represents means ± SEM of three independent experiments (at least four units per group). Data were analyzed by one-way ANOVA followed by Tukey’s test. * p < 0.05 vs. CTRL; ° p < 0.05 vs. LPS; § p < 0.05 vs. OL + LPS co-t; and ^ p < 0.05 vs. OL pre-t + LPS only.
Figure 12
Figure 12
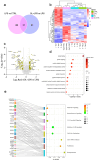
Graphical representation of proteomic results. (a) Overlap analysis of differentially expressed proteins in mouse BV-2 cells treated with LPS in the presence or absence of OL. (b) Heatmap of proteins identified in OL + LPS vs. LPS comparison (n = 3). Data analyzed by RStudio and the row clustering distance and clustering method were “euclidean” and “complete”, respectively. (c) Volcano plot of quantified proteins obtained for OL + LPS vs. LPS comparison. Colored points represent differentially expressed proteins with p-value < 0.05 and fold ≥1.5. Dotted lines indicate the threshold of significance and fold values. The gene names of identified proteins are shown in the scatter plot. (d) Enrichment bubble plot of GO biological processes. Size of circle for each biological process represents counts of enriched proteins. (e) Sankey diagram and bubble plot of canonical pathways in OL + LPS vs. LPS comparison. The enriched canonical pathways are listed based on the IPA analysis. The size of circle for each pathway represents the ratio, whereas the color is the significance. The ratio is calculated from the number of molecules in a particular pathway divided by total number of molecules that make up that pathway and that are in the reference set. In x axis of bubble plot negative, z score values of canonical pathways are achieved in OL + LPS treatment.
Figure 13
Figure 13
Molecular docking results of OL and OA (green and purple respectively) in mCD14 (PDB ID 1WWL). Residues detected through mutagenesis studies to be responsible for LPS binding and LPS signaling are shown in tan and gray spheres, respectively. Residues involved in the binding of OL and OA are highlighted.
Figure 14
Figure 14
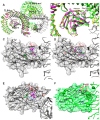
TLR4-MD2 complex structures in different conformations, relative to activated state (green and yellow) and inactive state (black and magenta). (A) Superposition of mTLR4-MD2-lipidA (green, PDB ID: 5IJD), mTLR4-MD2-neoseptin-3 (yellow, PDB ID: 5IJC), ligand-free mTLR4-MD2 (black, PDB ID: 5IJB), and TLR4-TV3 hybrid-MD2-Eritoran (magenta, PDB ID: 2Z65) complexes. (B) Detailed view of the MD2 core inside the complex highlighted the conformation of Phe126 in the activated state (inner pose, green, and yellow) and inactive state (outer pose, black, and magenta). (C) Front view of the best docking poses of oleocanthalic acid (purple) and oleocanthal (green) in the inactive form of mMD2 (PDB ID: 5IJB). (D) Alternative docking pose of oleocanthalic acid (purple) and oleocanthal (cyan) in the inactive form of mMD2 (black, PDB ID: 5IJB). Hydrogen bonds are cyan-colored. (E) Top view of the best docking poses of oleocanthalic acid (purple) and oleocanthal (green) in the inactive form of mMD2 (PDB ID: 5IJB). (F) Top view of the activated form (via lipidA interaction) of mMD2 (PDB ID: 5IJC). Residues with high conformational variability during the activation are highlighted.

References

    1. Pasteuning-Vuhman S., de Jongh R., Timmers A., Pasterkamp R.J. Towards Advanced iPSC-Based Drug Development for Neurodegenerative Disease. Trends Mol. Med. 2021;27:263–279. doi: 10.1016/j.molmed.2020.09.013. - DOI - PubMed
    1. Fan Y., Goh E.L.K., Chan J.K.Y. Neural Cells for Neurodegenerative Diseases in Clinical Trials. Stem Cells Transl. Med. 2023;12:510–526. doi: 10.1093/stcltm/szad041. - DOI - PMC - PubMed
    1. Angeloni C., Malaguti M., Prata C., Freschi M., Barbalace M.C., Hrelia S. Mechanisms Underlying Neurodegenerative Disorders and Potential Neuroprotective Activity of Agrifood By-Products. Antioxidants. 2022;12:94. doi: 10.3390/antiox12010094. - DOI - PMC - PubMed
    1. Schain M., Kreisl W.C. Neuroinflammation in Neurodegenerative Disorders-a Review. Curr. Neurol. Neurosci. Rep. 2017;17:25. doi: 10.1007/s11910-017-0733-2. - DOI - PubMed
    1. Mayne K., White J.A., McMurran C.E., Rivera F.J., de la Fuente A.G. Aging and Neurodegenerative Disease: Is the Adaptive Immune System a Friend or Foe? Front. Aging Neurosci. 2020;12:572090. doi: 10.3389/fnagi.2020.572090. - DOI - PMC - PubMed

LinkOut - more resources