. 2024 Sep 3;14(9):1111.
doi: 10.3390/biom14091111.

The Antitumor Potential of Sicilian Grape Pomace Extract: A Balance between ROS-Mediated Autophagy and Apoptosis

Affiliations

The Antitumor Potential of Sicilian Grape Pomace Extract: A Balance between ROS-Mediated Autophagy and Apoptosis

Federica Affranchi et al. Biomolecules. .

Abstract

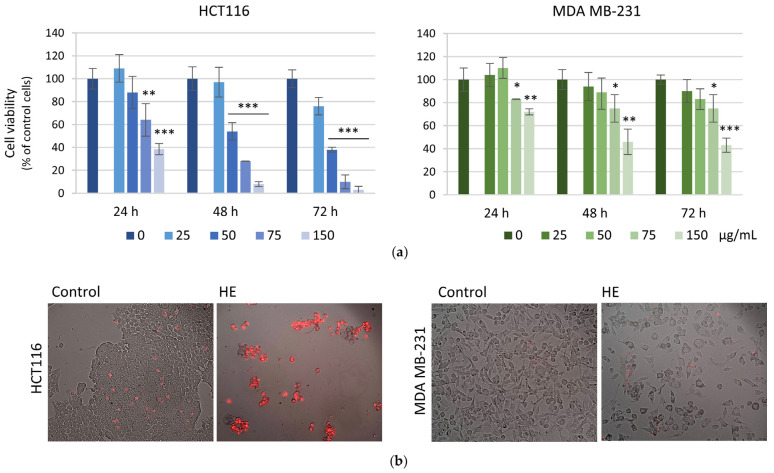
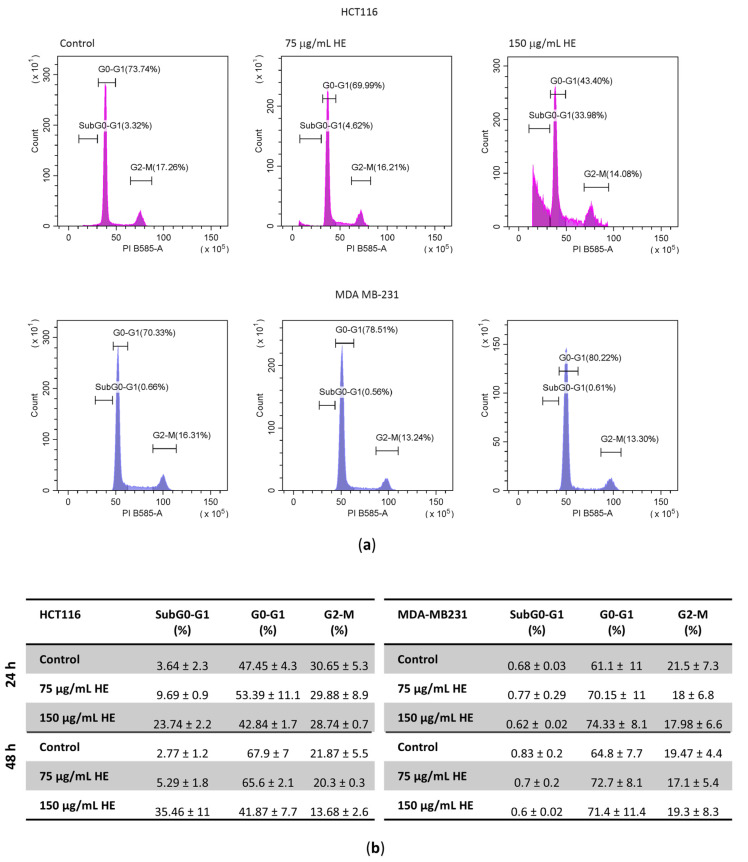
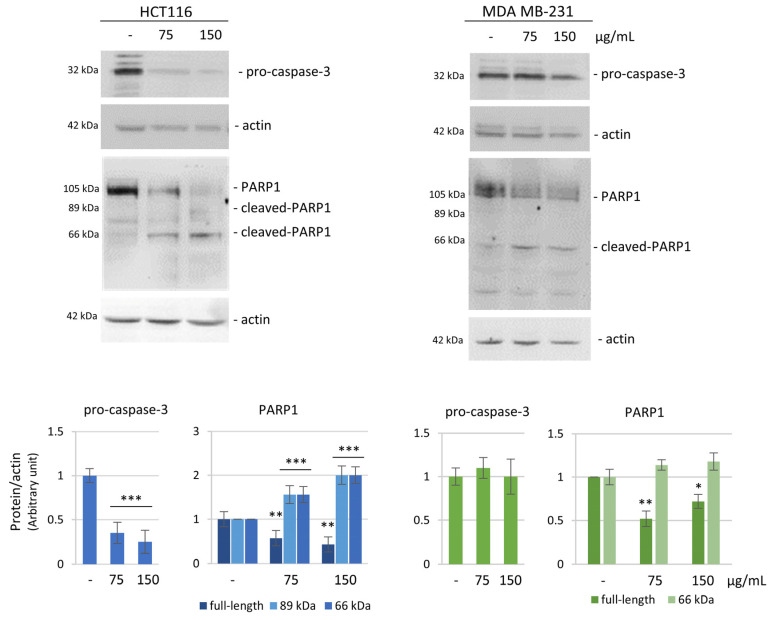
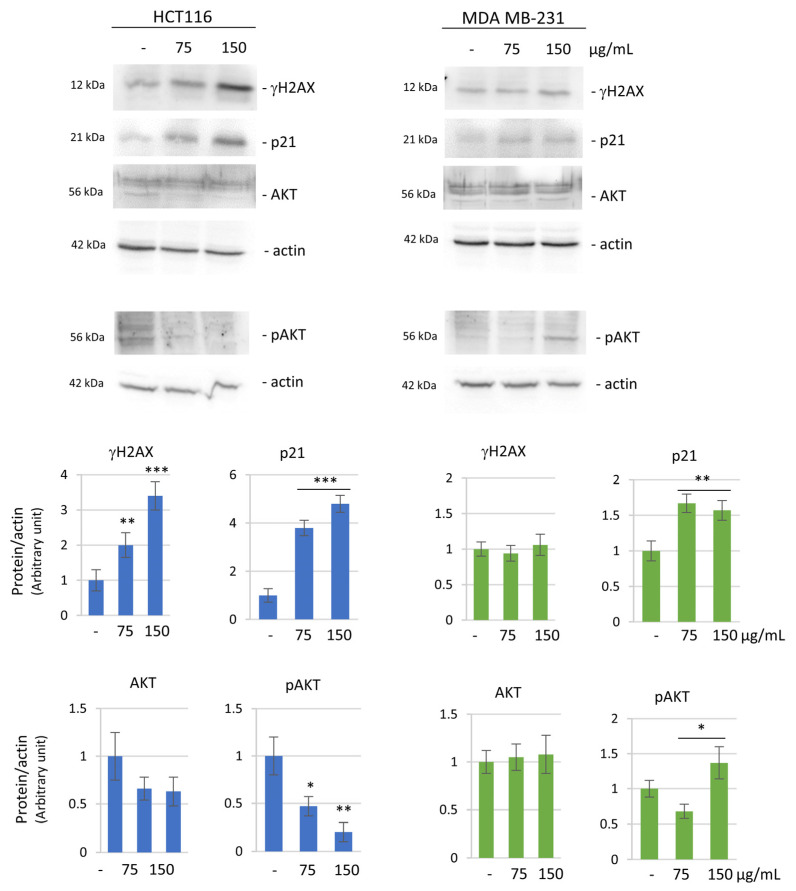
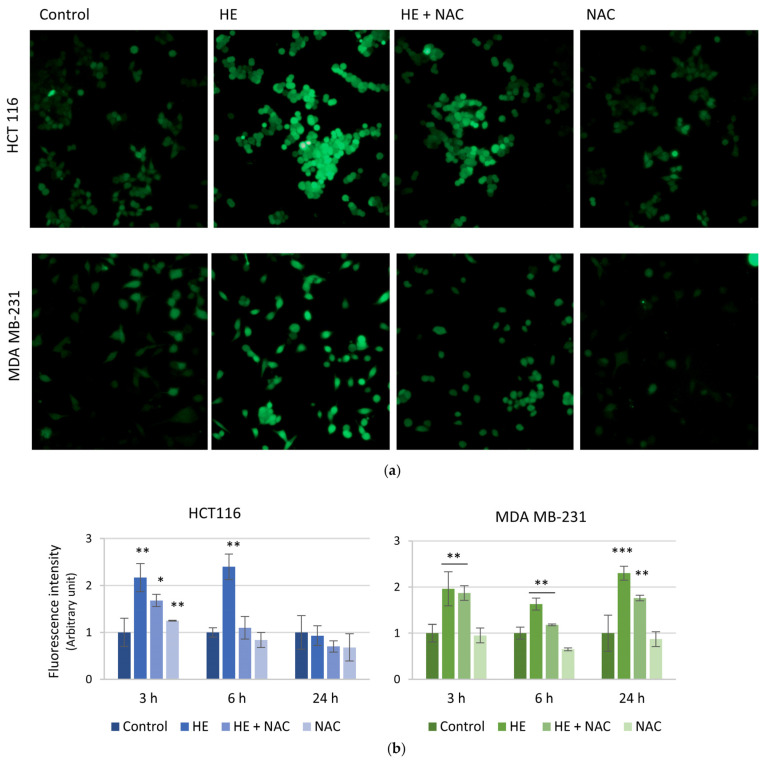
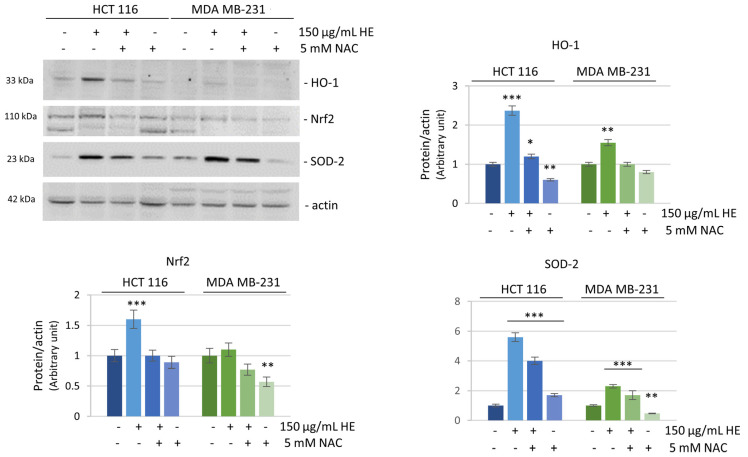
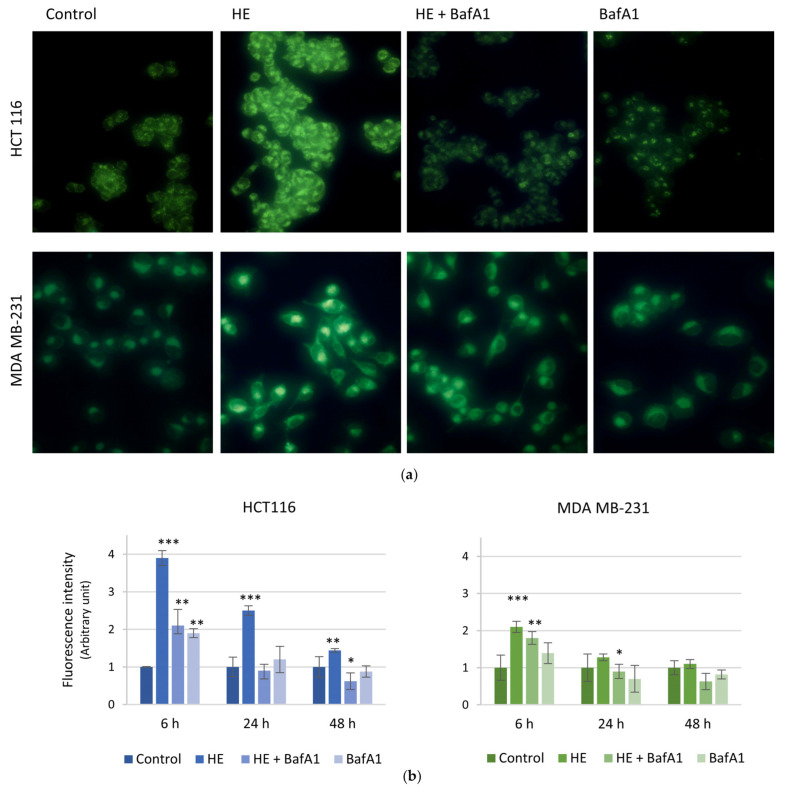
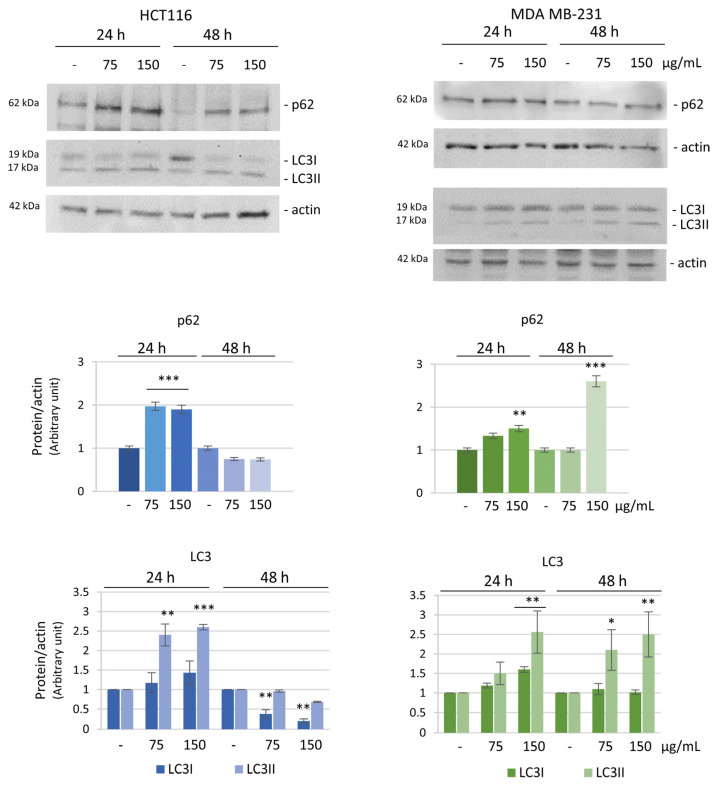
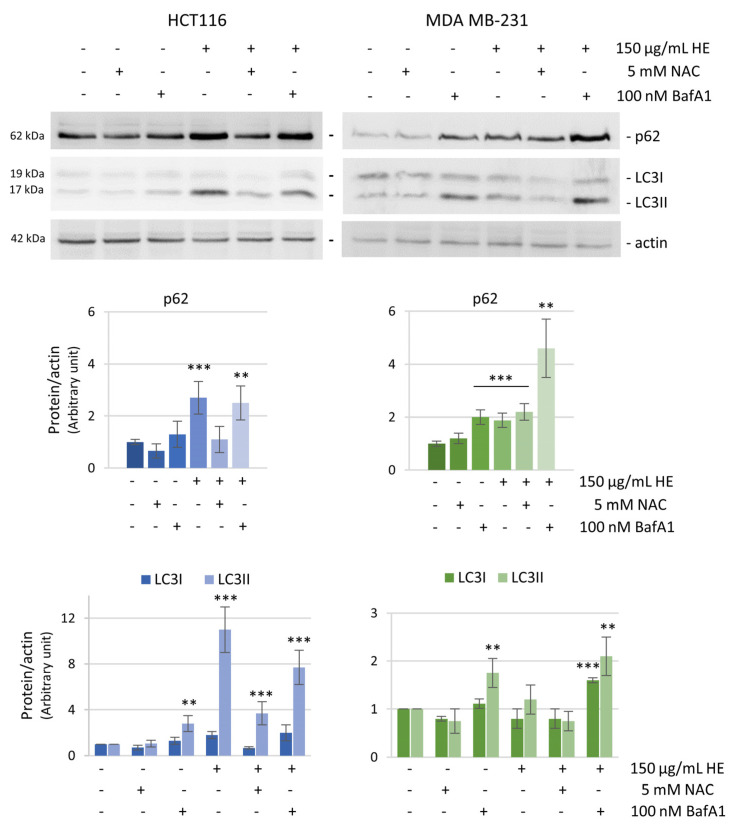
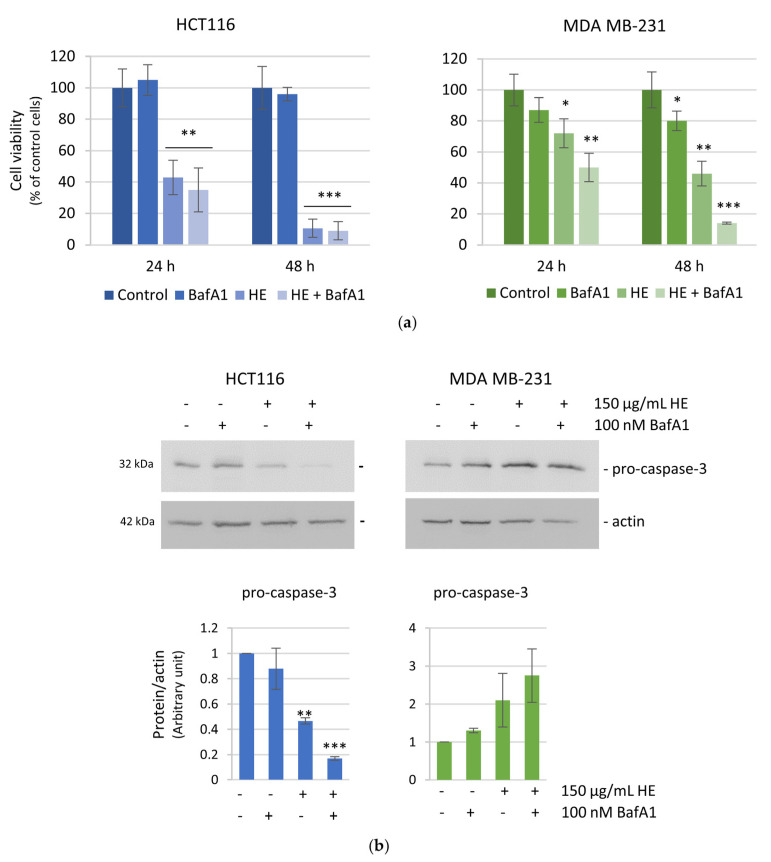
From the perspective of circular economy, it is extremely useful to recycle waste products for human health applications. Among the health-beneficial properties of bioactive phyto-compounds, grape pomace represents a precious source of bioactive molecules with potential antitumor properties. Here, we describe the effects of a Sicilian grape pomace hydroalcoholic extract (HE) in colon and breast cancer cells. The characterization of HE composition revealed the predominance of anthoxanthins and phenolic acids. HE treatment was more effective in reducing the viability of colon cancer cells, while breast cancer cells appeared more resistant. Indeed, while colon cancer cells underwent apoptosis, as shown by DNA fragmentation, caspase-3 activation, and PARP1 degradation, breast cancer cells seemed to not undergo apoptosis. To elucidate the underlying mechanisms, reactive oxygen species (ROS) were evaluated. Interestingly, ROS increased in both cell lines but, while in colon cancer, cells' ROS rapidly increased and progressively diminished over time, in breast cancer, cells' ROS increase was persistent up to 24 h. This effect was correlated with the induction of pro-survival autophagy, demonstrated by autophagosomes formation, autophagic markers increase, and protection by the antioxidant NAC. The autophagy inhibitor bafilomycin A1 significantly increased the HE effects in breast cancer cells but not in colon cancer cells. Overall, our data provide evidence that HE efficacy in tumor cells depends on a balance between ROS-mediated autophagy and apoptosis. Therefore, inhibiting pro-survival autophagy may be a tool to target those cells that appear more resistant to the effect of HE.

Keywords: antioxidants; autophagy/apoptosis balance; grape pomace; polyphenols; redox status.


Conflict of interest statement

The authors declare no conflicts of interest.

Figures

Figure 1
Figure 1
Time and dose-dependent effects of HE on HCT116 and MDA MB-231 cells. (a) Cell viability was assessed by MTT assay after 24, 48 and 72 h of HE treatment. HE was used at concentration of 25–150 µg GAE/mL. Results are representative of three independent experiments and expressed as mean ± SD. * p < 0.05, ** p < 0.01, *** p < 0.001 vs. untreated control. (b) Representative merged images of bright field and propidium iodide-stained cells after 72 h treatment with 75 µg GAE/mL HE. Cells were visualized under fluorescent microscope at 200× magnification and the pictures acquired by OptiKa Proview software.
Figure 2
Figure 2
Effects of HE on HCT116 and MDA MB-231 cell cycle distribution. (a) Flow cytometric analysis of cell cycle distribution after 48 h of 75 and 150 µg GAE /mL HE treatment. (b) Summary table of the percentage of cells in the different phases of cell cycle after 24 and 48 h of treatment with 75 and 150 µg/mL GAE HE. Data are expressed as the mean ± SD.
Figure 3
Figure 3
HE effect on the expression of apoptotic markers. Western blotting analysis of pro-caspase-3 and PARP1 after 48 h of 75 and 150 µg GAE/mL HE treatment in HCT116 cells (left panel) and MDA MB-231 cells (right panel). Actin blot was used as a loading control to normalize the protein levels. Densitometric analysis, conducted by Quantity One software (version 4.6.6 basic), are reported in the histograms below. Results are representative of three independent experiments and values are expressed as mean ± SD. * p < 0.05, ** p < 0.01, *** p < 0.001 vs. untreated control.
Figure 4
Figure 4
HE effect on the expression of pro-survival markers. Western blotting analysis of γH2AX, p21, AKT and phosphorylated AKT (pAKT) in basal conditions and after 48 h of 75 and 150 µg GAE/mL HE in HCT116 cell (left panel) and MDA MB-231 cell (right panel). Actin blot was used as a loading control to normalize the protein levels. Densitometric analysis, conducted by Quantity One software, are reported in the histograms below. Results are representative of two independent experiments with similar results and values are expressed as mean ± SD. * p < 0.05, ** p < 0.01, *** p < 0.001 vs. untreated control.
Figure 5
Figure 5
HE effects on reactive oxygen species (ROS) production. HCT116 and MDA MB-231 cells were treated with 150 µg/mL GAE of HE for 3, 6 and 24 h alone or in combination with 5 mM NAC. Magnification 200× (a) Fluorescence images are representative of the effects observed after 6 h of treatment. (b) Time-dependent analysis of fluorescence intensity was carried out through ImageJ software (version IJ 1.46r). Results are representative of three independent experiments and fluorescence intensity values are expressed as mean ± SD. * p < 0.05, ** p < 0.01, *** p < 0.001 vs. untreated control.
Figure 6
Figure 6
Evaluation of the expression of antioxidant enzymes. Western blotting analysis of some antioxidant proteins (HO-1, Nrf2 and SOD-2) after 150 µg GAE/mL HE treatment for 24 h in HCT116 and MDA MB-231 cells. Protein levels were normalized by actin. Densitometric analysis, conducted by Quantity One software, are reported in the histograms. Results are representative of three independent experiments and values are expressed as mean ± SD. * p < 0.05, ** p < 0.01, *** p < 0.001 vs. untreated control.
Figure 7
Figure 7
Autophagosome staining after HE treatment in HCT116 and MDA MB-231 cells. HCT116 and MDA MB-231 cells were treated with 150 µg GAE/mL HE alone or in combination with 100 nM bafilomycinA1. After 6, 24 and 48 h the cells were incubated with 50 µM MDC for 10 min and visualized by fluorescence microscope. Magnification 200×. (a) Representative images acquired after 6 h of treatment. (b) The histogram reports the time-dependent analysis of fluorescence intensity carried out through ImageJ software. Results are representative of two independent experiments with similar results and fluorescence intensity values are expressed as mean ± SD. * p < 0.05, ** p < 0.01, *** p < 0.001 vs. untreated control.
Figure 8
Figure 8
Evaluation of autophagic pathway markers. Western blotting analysis of the autophagic markers p62 and LC3 after 75 or 150 µg GAE/mL HE treatment for 24 or 48 h in HCT116 and MDA MB-231 cells. Protein levels were normalized by actin. Densitometric analysis was conducted by using Quantity One software and are reported in the histograms. Results are representative of three independent experiments and values are expressed as mean ± SD. * p < 0.05, ** p < 0.01, *** p < 0.001 vs. untreated control.
Figure 9
Figure 9
Relationship between ROS and autophagy in HCT116 and MDA MB-231 cells. Western blotting analysis of p62 and LC3 after 24 h of treatment with 5 mM NAC, 100 nM bafilomycin A1 (BafA1) employed alone or in combination with 150 µg GAE/mL HE. Actin blot was used as a loading control to normalize the protein levels. Densitometric analysis, conducted by Quantity One software, are shown by the histograms below. Results are representative of two independent experiments with similar results and values are expressed as mean ± SD. ** p < 0.01, *** p < 0.001 vs. untreated control.
Figure 10
Figure 10
The effect of the autophagy inhibitor bafilomycin A1 (BafA1) on cell viability and apoptotic markers. (a) MTT assay was used to assess cell viability after 24 and 48 h of 150 µg GAE/mL HE alone or in combination with 100 nM bafilomycin A1. Results are representative of three independent experiments and are expressed as mean ± SD. * p < 0.05, ** p < 0.01, *** p < 0.001 vs. untreated control. (b) Western blotting analysis of pro-caspase-3 after 24 h treatment with 150 µg/mL GAE of HE alone or in combination with 100 nM bafilomycin A1 in HCT116 and MDA MB-231 cells. Protein levels were normalized by actin. Densitometric analysis was conducted by Quantity One software and are reported in the histograms. Results are representative of two independent experiments with similar results and are expressed as mean ± SD. * p < 0.05, ** p < 0.01, *** p < 0.001 vs. untreated control.

Similar articles

Cited by

References

    1. Ackroyd B., Akcan N.S., Chhabra P., Krishnamurthy K., Madhavan V., Chandrasekar S., Compton W.D., Farris T.N. Phytochemicals and Their Usefulness in the Maintenance of Health. Plants. 2024;13:523. doi: 10.3390/plants13040523. - DOI - PMC - PubMed
    1. Davinelli S., Scapagnini G. The Pharma-Nutritional Role of Antioxidant Phytochemicals in Health and Disease. Antioxidants. 2022;11:1081. doi: 10.3390/antiox11061081. - DOI - PMC - PubMed
    1. Dias M.C., Pinto D.C.G.A., Silva A.M.S. Plant Flavonoids: Chemical Characteristics and Biological Activity. Molecules. 2021;26:5377. doi: 10.3390/molecules26175377. - DOI - PMC - PubMed
    1. Najmi A., Javed S.A., Al Bratty M., Alhazmi H.A. Modern Approaches in the Discovery and Development of Plant-Based Natural Products and Their Analogues as Potential Therapeutic Agents. Molecules. 2022;27:349. doi: 10.3390/molecules27020349. - DOI - PMC - PubMed
    1. Balsano C., Alisi A. Antioxidant Effects of Natural Bioactive Compounds. Curr. Pharm. Des. 2009;15:3063–3073. doi: 10.2174/138161209789058084. - DOI - PubMed

MeSH terms

Substances

LinkOut - more resources