. 2024 Sep 22;14(9):1195.
doi: 10.3390/biom14091195.

Lactate Suppresses Growth of Esophageal Adenocarcinoma Patient-Derived Organoids through Alterations in Tumor NADH/NAD+ Redox State

Affiliations

Lactate Suppresses Growth of Esophageal Adenocarcinoma Patient-Derived Organoids through Alterations in Tumor NADH/NAD+ Redox State

Steven H Su et al. Biomolecules. .

Abstract

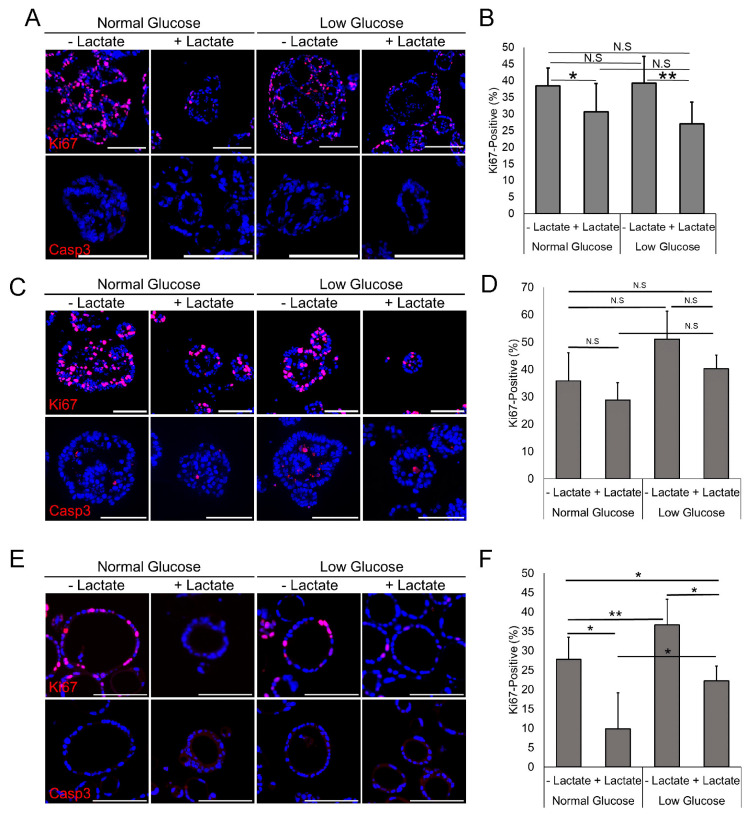
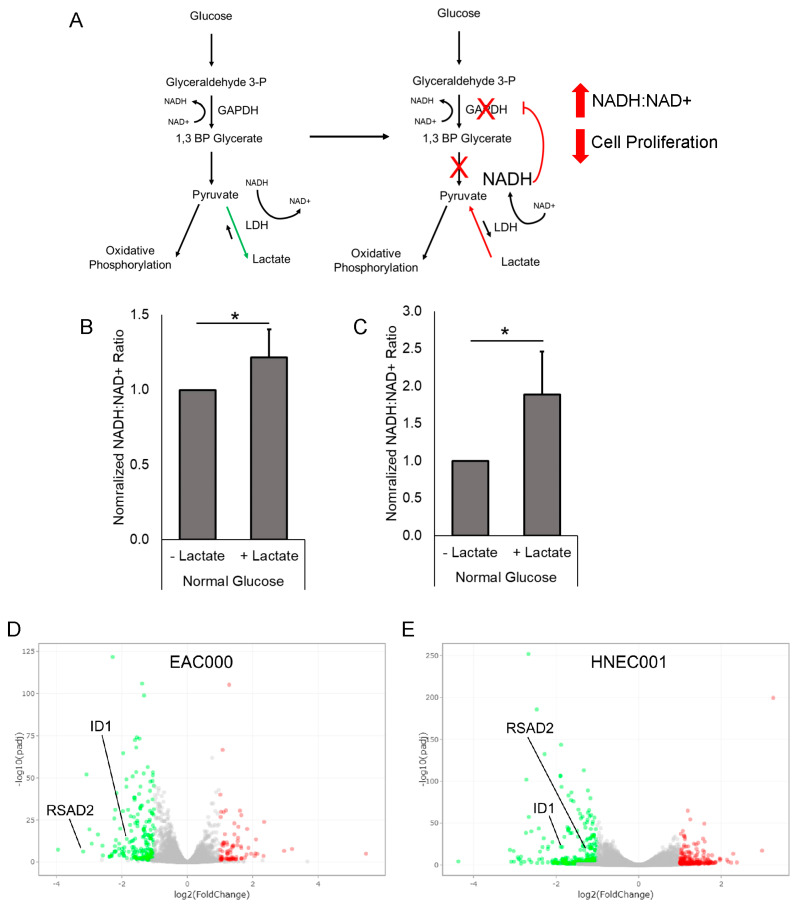
Barrett's esophagus (BE) is a common precancerous lesion that can progress to esophageal adenocarcinoma (EAC). There are significant alterations in the esophageal microbiome in the progression from healthy esophagus to BE to EAC, including an increased abundance of a variety of lactate-producing bacteria and an increase of lactate in the tumor microenvironment, as predicted by metabolic modeling. The role of bacterial lactate in EAC is unknown. Here, we utilize patient-derived organoid (PDO) models of EAC and demonstrate that lactate inhibits the growth and proliferation of EAC PDOs through alterations in the tumor NADH/NAD+ redox state. Further RNA sequencing of EAC PDOs identifies ID1 and RSAD2 as potential regulatory molecules crucial in mediating lactate's ability to suppress glycolysis and proliferation. Gene ontology analysis also identifies the activation of inflammatory and immunological pathways in addition to alterations in the metabolic pathways in EAC PDOs exposed to lactate, suggesting a multi-faceted role for lactate in the pathogenesis of EAC.

Keywords: esophageal adenocarcinoma; lactate; tumor microenvironment.


Conflict of interest statement

The authors declare no conflict of interest.

Figures

Figure 1
Figure 1
Lactate treatment decreases mean organoid area of EAC PDOs but has no effect on organoid formation rate (OFR). (A) Schematic of generation of patient-derived organoids. Biopsies were dissociated into single-cell suspensions and grown in Matrigel into esophageal organoids, after which they could be expanded and re-seeded as necessary. (B) Experimental schematic indicating EAC organoid growth conditions. (C) Organoid formation rate for EAC000 organoids grown in listed conditions. (D) Mean organoid area for EAC000 organoids grown in listed conditions. (E) Images of EAC000 organoids grown in listed conditions. (F) Organoid formation rate for HNEC001 organoids grown in listed conditions. (G) Mean organoid area for HNEC001 organoids grown in listed conditions. (H) Images of HNEC001 organoids grown in listed conditions. (I) Organoid formation rate for EAC011 organoids grown in listed conditions. (J) Mean organoid area for EAC011 organoids grown in listed conditions. (K) Images of EAC011 organoids grown in listed conditions. Error bars in (C,D,F,G,I,J) indicate standard deviations. Scale bars in (E,H,K) are 100 μm. n = 5 or 6 technical replicates for all measurements in (C,D,F,G,I,J). N.S indicates non-significant. * indicates p < 0.05 by Student’s t-test. ** indicates p < 0.01 by Student’s t-test. *** indicates p < 0.001 by Student’s t-test.
Figure 2
Figure 2
Lactate treatment decreases cellular proliferation in EAC PDOs. (A) Immunofluorescent staining of Ki67 and Cleaved Caspase 3 (Casp3) in EAC000 PDOs grown under various conditions. (B) Quantification of Ki67 positivity in EAC000 grown under various conditions. (C) Immunofluorescent staining of Ki67 and Cleaved Caspase 3 (Casp3) in HNEC001 PDOs grown under various conditions. (D) Quantification of Ki67 positivity in HNEC001 PDOs grown under various conditions. (E) Immunofluorescent staining of Ki67 and Cleaved Caspase 3 (Casp3) in EAC011 PDOs grown under various conditions (F) Quantification of Ki67 positivity in EAC011 PDOs grown under various conditions Scale bars in (A,C,E) are 100 μm. Error bars in (B,D,F) are standard deviations. * indicates p < 0.05 via Student’s t-test. ** indicates p < 0.01 via Student’s t-test. N.S indicates not significant. N = 3 to 8 medium-powered fields quantified for each condition in (B,D,F), with each field containing approximately 100–1000 nuclei.
Figure 3
Figure 3
Inhibition of lactate dehydrogenase reverses lactate-driven growth inhibition. (A) Quantification of the size of EAC000 PDOs grown in the presence or absence of lactate and GSK2837808A, a lactate dehydrogenase inhibitor (LHDi), after 14 days. (B) Representative images of EAC000 PDOs grown in the labeled conditions. (C) Quantification of the size of HNEC001 PDOs grown in the presence or absence of lactate and GSK2837808A, a lactate dehydrogenase inhibitor (LHDi). (D) Representative images of HNEC001 PDOs grown in the labeled conditions. Error bars in (A,C) are standard deviations. * indicates p < 0.05 via Student’s t-test. ** indicates p < 0.01 via Student’s t-test. N.S indicates non-significant. Scale bars in (B,D) are 100 µm.
Figure 4
Figure 4
Lactate treatment of PDOs results in changes in glycolytic pathways. (A) Schematic of NADH/NAD+ alterations following lactate treatment. (B) Quantification of the NADH:NAD+ ratio in EAC000 PDOs grown in the listed conditions. (C) Quantification of the NADH:NAD+ ratio in HNEC001 PDOs grown in the listed conditions. (D) Volcano plot of differentially expressed genes in EAC000 PDOs treated with lactate compared to non-treated control. (E) Volcano plot of differentially expressed genes in HNEC001 PDOs treated with lactate compared to non-treated control. Significantly upregulated genes are shown as red dots, and downregulated genes are shown as green dots. Error bars in (B,C) are standard deviations. * indicates p < 0.05 via Mann–Whitney U test.
Figure 5
Figure 5
Gene ontology analysis reveals enrichment of genes associated with cellular metabolism and immune responses. (A) Gene ontology analysis for lactate-treated EAC000 PDOs compared to control. (B) Gene ontology analysis for lactate-treated HNEC001 PDOs compared to control. Pathways highlighted in green are shared between the two PDO lines. Immunological and inflammatory pathways are highlighted in red. Metabolic pathways are highlighted in green.

References

    1. Hur C., Miller M., Kong C.Y., Dowling E.C., Nattinger K.J., Dunn M., Feuer E.J. Trends in esophageal adenocarcinoma incidence and mortality. Cancer. 2013;119:1149–1158. doi: 10.1002/cncr.27834. - DOI - PMC - PubMed
    1. van Soest E.M., Dieleman J.P., Siersema P.D., Sturkenboom M.C.J.M., Kuipers E.J. Increasing incidence of Barrett’s oesophagus in the general population. Gut. 2005;54:1062–1066. doi: 10.1136/gut.2004.063685. - DOI - PMC - PubMed
    1. Coleman H.G., Bhat S., Murray L.J., McManus D., Gavin A.T., Johnston B.T. Increasing incidence of Barrett’s oesophagus: A population-based study. Eur. J. Epidemiol. 2011;26:739–745. doi: 10.1007/s10654-011-9596-z. - DOI - PubMed
    1. Beydoun A.S., Stabenau K.A., Altman K.W., Johnston N. Cancer Risk in Barrett’s Esophagus: A Clinical Review. Int. J. Mol. Sci. 2023;24:6018. doi: 10.3390/ijms24076018. - DOI - PMC - PubMed
    1. Sepich-Poore G.D., Zitvogel L., Straussman R., Hasty J., Wargo J.A., Knight R. The microbiome and human cancer. Science. 2021;371:eabc4552. doi: 10.1126/science.abc4552. - DOI - PMC - PubMed

Supplementary concepts

LinkOut - more resources