. 2024 Sep 16;16(18):3172.
doi: 10.3390/cancers16183172.

The Role of TGF-β1 and Mutant SMAD4 on Epithelial-Mesenchymal Transition Features in Head and Neck Squamous Cell Carcinoma Cell Lines

Affiliations

The Role of TGF-β1 and Mutant SMAD4 on Epithelial-Mesenchymal Transition Features in Head and Neck Squamous Cell Carcinoma Cell Lines

Michael Bette et al. Cancers (Basel). .

Abstract

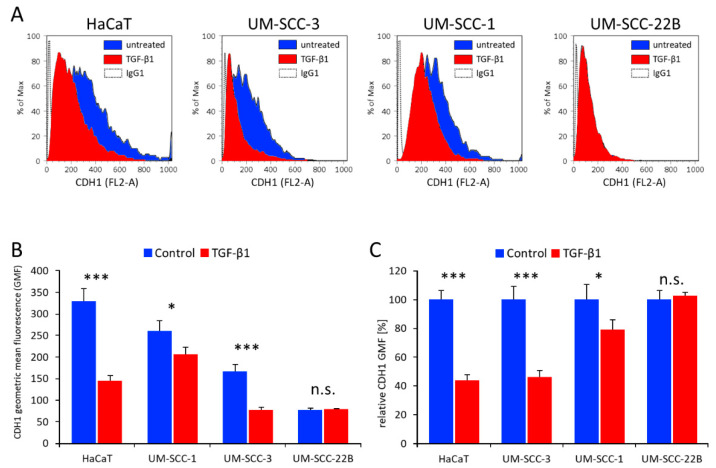
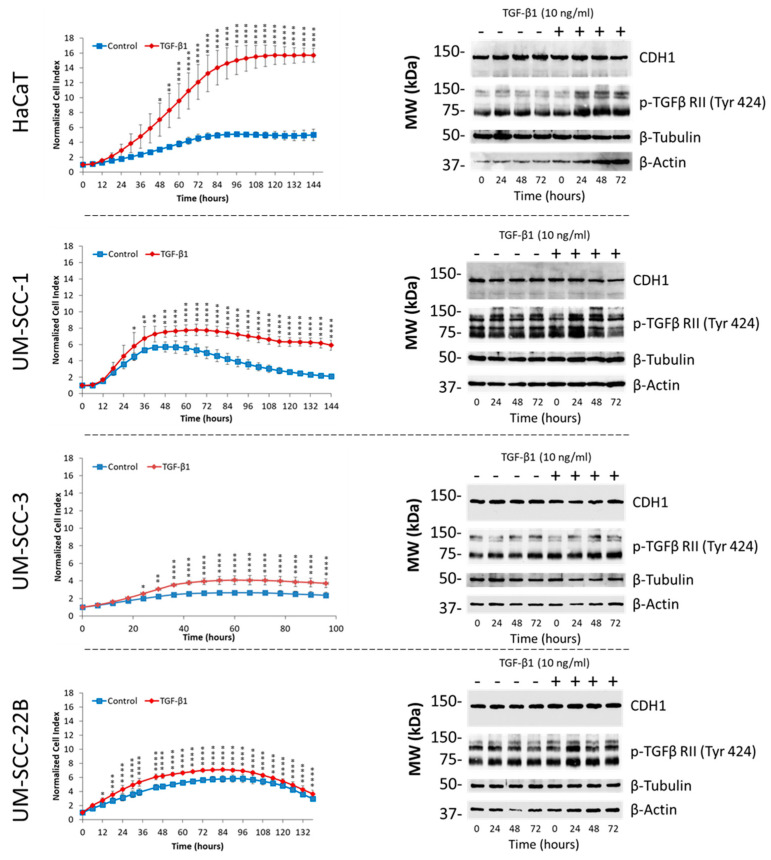
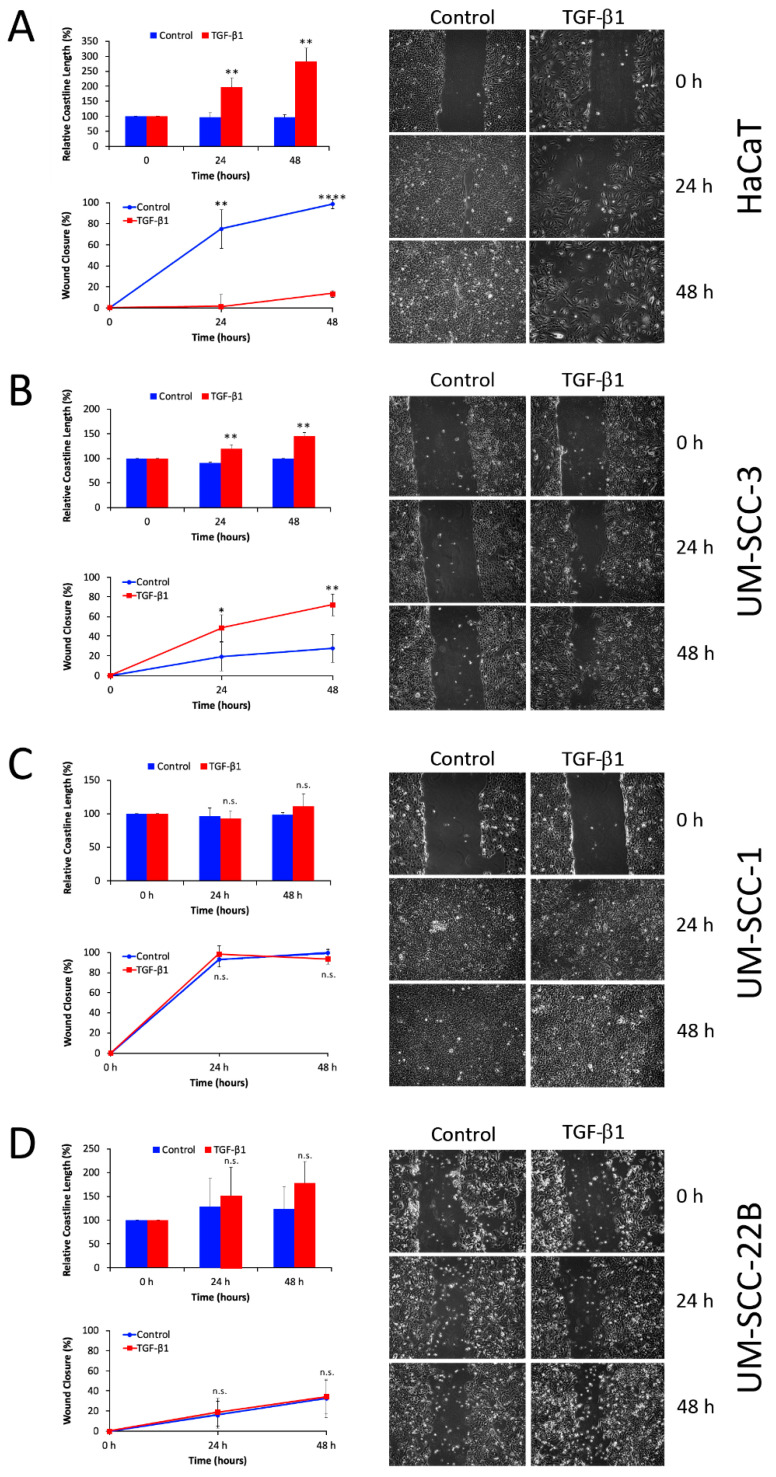
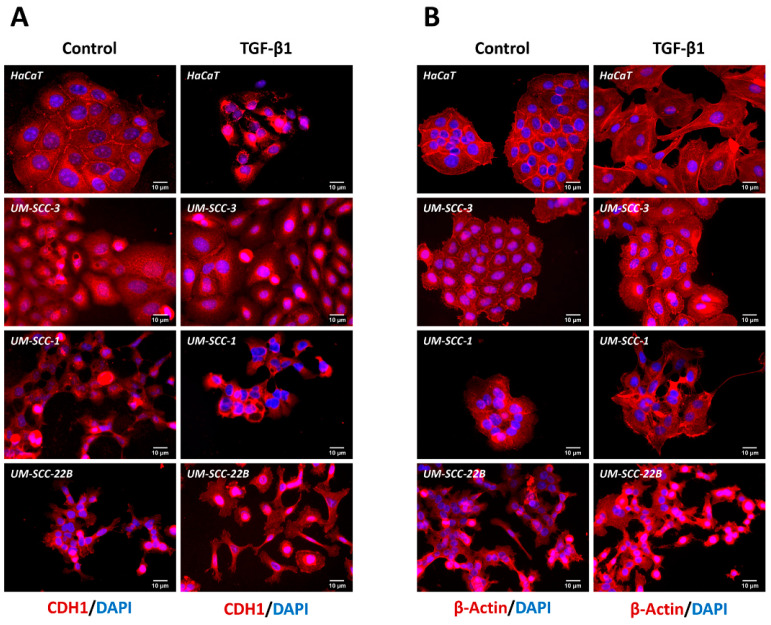
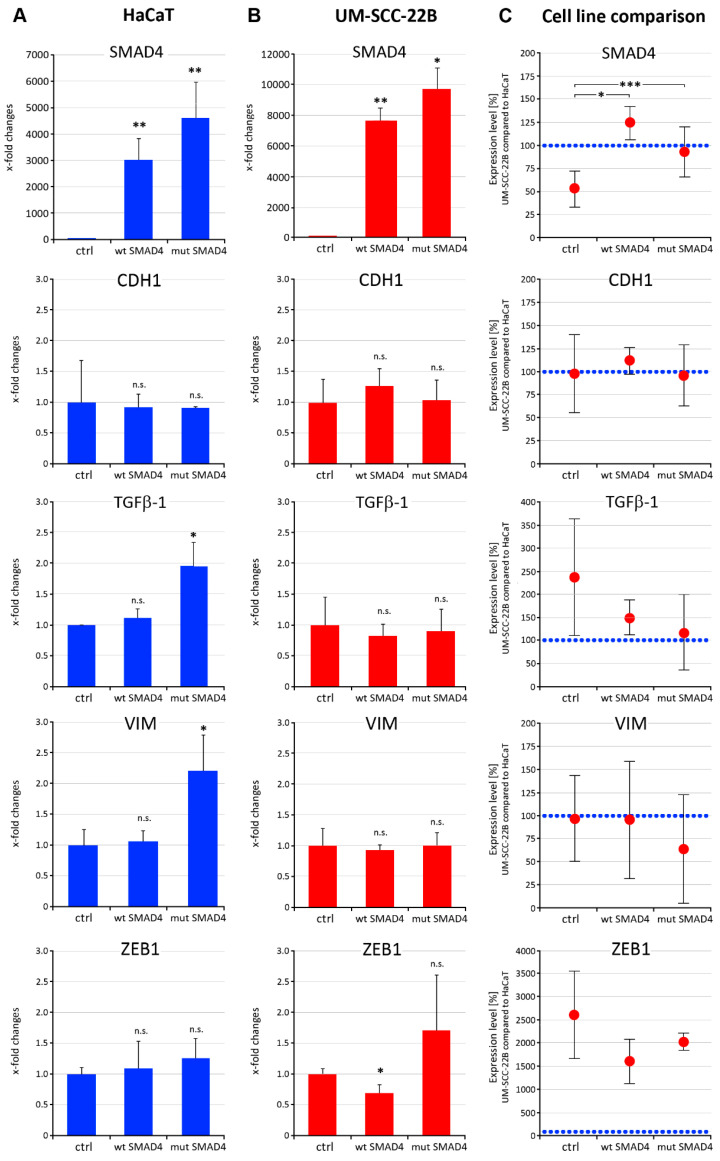
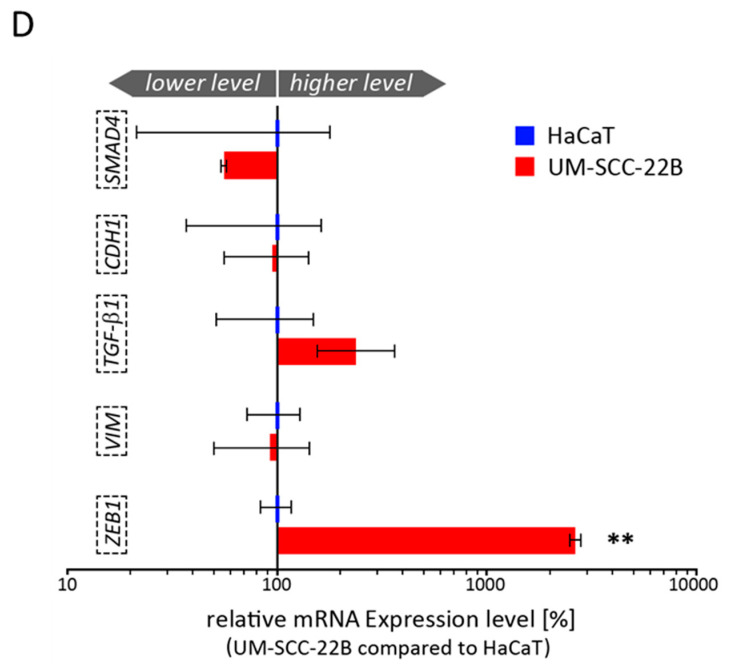
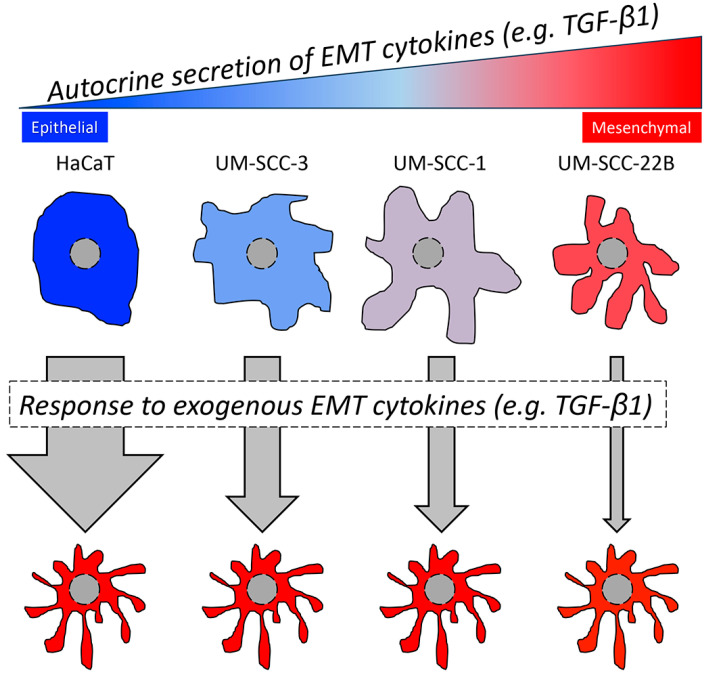
The aim of the present study was to investigate possible differences in the sensitivity of HNSCC cells to known EMT regulators. Three HNSCC cell lines (UM-SCC-1, -3, -22B) and the HaCaT control keratinocyte cell line were exposed to transforming growth factor beta 1 (TGF-β1), a known EMT master regulator, and the cellular response was evaluated by real-time cell analysis (RTCA), Western blot, quantitative PCR, flow cytometry, immunocytochemistry, and the wound closure (scratch) assay. Targeted sequencing on 50 cancer-related genes was performed using the Cancer Hotspot Panel v2. Mutant, and wild type SMAD4 cDNA was used to generate recombinant SMAD4 constructs for expression in mammalian cell lines. The most extensive response to TGF-β1, such as cell growth and migration, β-actin expression, or E-cadherin (CDH1) downregulation, was seen in cells with a more epithelial phenotype. Lower response correlated with higher basal p-TGFβ RII (Tyr424) levels, pointing to a possible autocrine pre-activation of these cell lines. Targeted sequencing revealed a homozygous SMAD4 mutation in the UM-SCC-22B cell line. Furthermore, PCR cloning of SMAD4 cDNA from the same cell line revealed an additional SMAD4 transcript with a 14 bp insertion mutation, which gives rise to a truncated SMAD4 protein. Overexpression of this mutant SMAD4 protein in the highly epithelial control cell line HaCaT resulted in upregulation of TGF-β1 and vimentin. Consistent with previous reports, the invasive and metastatic potential of HNSCC tumor cells appears associated with the level of autocrine secretion of EMT regulators such as TGF-β1, and it could be influenced by exogenous EMT cytokines such as those derived from immune cells of the tumor microenvironment. Furthermore, mutant SMAD4 appears to be a significant contributor to the mesenchymal transformation of HNSCC cells.

Keywords: SMAD4; TGF-β1; epithelial–mesenchymal transition; head and neck squamous cell carcinoma.


Conflict of interest statement

The authors declare no conflicts of interest.

Figures

Figure 1
Figure 1
The effect of TGF-β1 on CDH1 surface expression in HNSCC and HaCaT cell lines. (A) Shown are representative flow cytometry histograms evaluating CDH1 surface expression (FL2-A channel for PE fluorescence) in cell lines treated with or without TGF-β1. (B) Comparison of absolute CDH1 geometric mean fluorescence (GMF) levels before and after TGF-β1 treatment. (C) Same data as in (B) depicting relative CDH1-GMF levels. Data represent the mean ± SD (n = 3), with p < 0.05 considered statistically significant. Statistical differences were indicated as *: p < 0.05, ***: p < 0.001, n.s.: not significant (see also Supplementary Figure S2).
Figure 2
Figure 2
Differential responsiveness of HNSCC and HaCaT cell lines to exogenous TGF-β1. Real-time cell analysis (RTCA) demonstrates major differences in TGF-β1 mediated cell growth (normalized cell index) induction in the tested cell lines (left). Data represent the mean ± SD (n = 3), with p < 0.05 considered statistically significant. Statistical differences were indicated as *: p < 0.05, **: p < 0.01, ***: p < 0.001 and ****: p < 0.0001. Shown on the right is the protein expression of CDH1 (E-cadherin), pTGFβ RII (Tyr424), β-tubulin, and β-actin. Uncropped Western blots are shown in Figure S3.
Figure 3
Figure 3
Effect of TGF-β1 on cell motility. Wound closure and relative coastline length were evaluated 24 and 48 hr after TGF-β1 treatment in HaCaT (A), UM-SCC-3 (B), UM-SCC-1 (C), and UM-SCC-22B (D) cell lines. Data represent the mean ± SD (n = 3), with p < 0.05 considered statistically significant. Statistical differences were indicated as *: p < 0.05, **: p < 0.01, ****: p < 0.0001, n.s.: not significant.
Figure 4
Figure 4
The effect of TGF-β1 on the cellular localization of CDH1 and β-actin. Confocal microscopy depicting CDH1 (A) and β-actin (B) expression (both red) in HaCaT, UM-SCC-3, UM-SCC-1, and UM-SCC-22B cell lines in the presence or absence of TGF-β1. DAPI (blue) was used for nuclear counterstaining. (No specific signal is seen in cells treated with anti-mouse IgG, see Supplementary Figure S4).
Figure 5
Figure 5
Influence of SMAD4wt and SMAD4mut overexpression on EMT-related genes. SMAD4wt and SMAD4mut expressing plasmids were transfected in HaCaT (A) and UM-SCC-22B (B) cell lines. Gene expression changes were compared against control values (A,B). (C) Gene expression ratios of UM-SCC-22B compared with HaCaT were evaluated in control cells and after transfection with SMAD4-expressing plasmids. (D) Comparison of basal mRNA expression levels of SMAD4, CDH1, TGF-β1, VIM, and ZEB1 between HaCaT and UM-SCC-22B cells (data correspond to the controls (ctrl) as shown in AC). Data represent the mean ± SD (n = 3–4), with p < 0.05 considered statistically significant. Statistical differences were indicated as *: p < 0.05, **: p < 0.01, ***: p < 0.001, n.s.: not significant.
Figure 5
Figure 5
Influence of SMAD4wt and SMAD4mut overexpression on EMT-related genes. SMAD4wt and SMAD4mut expressing plasmids were transfected in HaCaT (A) and UM-SCC-22B (B) cell lines. Gene expression changes were compared against control values (A,B). (C) Gene expression ratios of UM-SCC-22B compared with HaCaT were evaluated in control cells and after transfection with SMAD4-expressing plasmids. (D) Comparison of basal mRNA expression levels of SMAD4, CDH1, TGF-β1, VIM, and ZEB1 between HaCaT and UM-SCC-22B cells (data correspond to the controls (ctrl) as shown in AC). Data represent the mean ± SD (n = 3–4), with p < 0.05 considered statistically significant. Statistical differences were indicated as *: p < 0.05, **: p < 0.01, ***: p < 0.001, n.s.: not significant.
Figure 6
Figure 6
The epithelial or mesenchymal phenotype of HNSCC and HaCaT cells depends on the supply of autocrine and exogenous EMT cytokines.

Similar articles

References

    1. Bray F., Ferlay J., Soerjomataram I., Siegel R.L., Torre L.A., Jemal A. Global cancer statistics 2018: GLOBOCAN estimates of incidence and mortality worldwide for 36 cancers in 185 countries. CA Cancer J. Clin. 2018;68:394–424. doi: 10.3322/caac.21492. - DOI - PubMed
    1. Mandic R., Ludwig T., Oberleithner H., Werner J.A. Evaluation of head and neck squamous cell carcinoma invasiveness by the electrical resistance breakdown assay. Clin. Exp. Metastasis. 2005;21:699–704. doi: 10.1007/s10585-004-6918-5. - DOI - PubMed
    1. Makarova G., Bette M., Schmidt A., Jacob R., Cai C., Rodepeter F., Betz T., Sitterberg J., Bakowsky U., Moll R., et al. Epidermal growth factor-induced modulation of cytokeratin expression levels influences the morphological phenotype of head and neck squamous cell carcinoma cells. Cell Tissue Res. 2012;351:59–72. doi: 10.1007/s00441-012-1500-y. - DOI - PubMed
    1. Pastushenko I., Blanpain C. EMT Transition States during Tumor Progression and Metastasis. Trends Cell Biol. 2019;29:212–226. doi: 10.1016/j.tcb.2018.12.001. - DOI - PubMed
    1. Heldin C.-H., Vanlandewijck M., Moustakas A. Regulation of EMT by TGFβ in cancer. FEBS Lett. 2012;586:1959–1970. doi: 10.1016/j.febslet.2012.02.037. - DOI - PubMed

LinkOut - more resources