. 2024 Sep 18;14(18):2709.
doi: 10.3390/ani14182709.

A Comparison of the Cecal Microbiota between the Infection and Recovery Periods in Chickens with Different Susceptibilities to Eimeria tenella

Affiliations

A Comparison of the Cecal Microbiota between the Infection and Recovery Periods in Chickens with Different Susceptibilities to Eimeria tenella

Jianqiang Tang et al. Animals (Basel). .

Abstract

To investigate the effect of Eimeria tenella (E. tenella) infection on the cecal microbiota, resistant and susceptible families were screened out based on the coccidiosis resistance evaluation indexes after E. tenella infection. Subsequently, a comparative analysis of cecal microorganisms among control, resistant, and susceptible groups as well as between different periods following the E. tenella challenge was conducted using metagenomic sequencing technology. The results showed that the abundance of opportunistic pathogens, such as Pantoea, Sporomusa, and Pasteurella in the susceptible group and Helicobacter and Sutterella in the resistant group, was significantly higher on day 27 post-inoculation (PI) (the recovery period) than on day 5 PI (the infection period). Additionally, the abundance of Alistipes, Butyricicoccus, and Eubacterium in the susceptible group and Coprococcus, Roseburia, Butyricicoccus, and Lactobacillus in the resistant group showed a significant upward trend during the infection period compared with that in the recovery period. On day 5 PI, the abundance of Faecalibacterium and Lactobacillus was decreased in both the resistant and susceptible groups when compared with that in the control group and was greater in the resistant group than in the susceptible group, while Alistipes in the susceptible group had a relatively higher abundance than that in other groups. A total of 49 biomarker taxa were identified using the linear discriminant analysis (LDA) effect size (LEfSe) method. Of these, the relative abundance of Lactobacillus aviarius, Lactobacillus salivarius, Roseburia, and Ruminococcus gauvreauii was increased in the resistant group, while Bacteroides_sp__AGMB03916, Fusobacterium_mortiferum, Alistipes_sp__An31A, and Alistipes_sp__Marseille_P5061 were enriched in the susceptible group. On day 27 PI, LDA scores identified 43 biomarkers, among which the relative abundance of Elusimicrobium_sp__An273 and Desulfovibrio_sp__An276 was increased in the resistant group, while that of Bacteroides_sp__43_108, Chlamydiia, Chlamydiales, and Sutterella_sp__AM11 39 was augmented in the susceptible group. Our results indicated that E. tenella infection affects the structure of the cecal microbiota during both the challenge and recovery periods. These findings will enhance the understanding of the effects of changes in the cecal microbiota on chickens after coccidia infection and provide a reference for further research on the mechanisms underlying how the intestinal microbiota influence the growth and health of chickens.

Keywords: E. tenella; cecal microbiota; metagenome sequencing; resistance selection.


Conflict of interest statement

The authors declare no conflicts of interest.

Figures

Figure 1
Figure 1
Images of cecal tissues of chickens on day 5 after E. tenella infection: (A) control group; (B) resistant group in family D; (C) susceptible group in family C.
Figure 2
Figure 2
Composition comparison of cecal microbiota at the species level among the JC, JR, and JS groups during the infection and recovery periods: (A) the infection period; (B) the recovery period. PCoA plots of beta diversity are based on the Bray–Curtis distances followed by the PERMANOVA statistical test. JC, control group; JR, resistant group; JS, susceptible group; R_JC, control group in the recovery period; R_JR, resistant group in the recovery period; R_JS, susceptible group in the recovery period; PCoA, principal coordinate analysis.
Figure 3
Figure 3
Comparison of the relative abundance of the top 15 most abundant cecal microorganisms at the phylum level in the different experimental periods: (A) JC vs. R_JC group; (B) JR vs. R_JR group; (C) JS vs. R_JS group. JC, control group; JR, resistant group; JS, susceptible group; R_JC, control group in the recovery period; R_JR, resistant group in the recovery period; R_JS, susceptible group in the recovery period.
Figure 4
Figure 4
Comparative analysis of the differential abundance of cecal microbiota between the infection period and the recovery period in each group. Hierarchical clustering plots of the top 30 microorganisms with significant differences in abundance at the genus level: (A) JC vs. R_JC group; (B) JR vs. R_JR group; (C) JS vs. R_JS group. The bar represents the maximum and minimum values of a set of data. Statistical analysis was performed using the Wilcoxon rank−sum test (p < 0.05). JC, control group; JR, resistant group JS, susceptible group; R_JC, control group in the recovery period; R_JR, resistant group in the recovery period; R_JS, susceptible group in the recovery period.
Figure 5
Figure 5
Comparative analysis of cecal microbiota at the genus level between different resistant groups during infection and recovery period. Comparison of the relative abundance of the top 15 cecal microorganisms among the JC, JR, and JS groups during the infection (A) and recovery period (B). Differential abundance analysis of cecal microbiota between different resistant groups during infection (C) and recovery period (D). Hierarchical clustering plots of the top 30 microbiota with significant differences at the genus level. The bar represents the maximum and minimum values of a set of data. Statistical analysis was performed using the Kruskal–Wallis H test (p < 0.05). JC, control group; JR, resistant group JS, susceptible group; R_JC, control group in the recovery period; R_JR, resistant group in the recovery period; R_JS, susceptible group in the recovery period.
Figure 6
Figure 6
Linear discriminant analysis effect size (LEfSe)-based analysis of the cecal microbiota in the different groups. LDA scores > 2.0 and p < 0.05 were considered to be significant differences. Different colors indicate different groups, with red bars, green bars, and blue bars representing species that were relatively abundant in the JC, JR, and JS groups, respectively. The LDA scores for differentially abundant cecal microbiota in the different groups during the infection period (A) and the recovery period (B). JC, control group; JR, resistant group; JS, susceptible group; LDA, linear discriminant analysis.
Figure 7
Figure 7
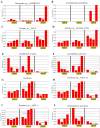
Histogram of the relative abundance of differential cecal microorganisms during the infection period; LDA scores > 2.0 and p < 0.05 were considered to be significant differences: (A) Bacteroides_sp__AGMB03916; (B) Fusobacterium_mortiferum; (C) Alistipes_sp__An31A; (D) Alistipes_sp__Marseille_P5061; (E) Lactobacillus aviarius; (F) Lactobacillus salivarius; (G) Roseburia; (H) Roseburia_sp__AM16_25; (I) Roseburia_sp__AM51_8; (J) Ruminococcus gauvreauii. JC, control group; JR, resistant group; JS, susceptible group. The solid lines represent the mean values of relative abundance, and the dotted lines represent the median values, and each column represents the relative abundance of each sample in each group.
Figure 8
Figure 8
Histogram of the relative abundance of differential cecal microorganisms during the recovery period; LDA scores > 2.0 and p < 0.05 were considered to be significant differences: (A) Chlamydiia; (B) Chlamydiales; (C) Sutterella_sp__AM11_39; (D) Elusimicrobium_sp__An273; (E) Desulfovibrio_sp__An276; (F) Butyricimonas. R_JC, control group in the recovery period; R_JR, resistant group in the recovery period; R_JS, susceptible group in the recovery period. The solid lines represent the mean values of relative abundance, and the dotted lines represent the median values, and each column represents the relative abundance of each sample in each group.
Figure 9
Figure 9
Co-occurrence network diagram of the cecal microbiota in the different groups during E. tenella infection and after recovery. Red edges represent positive correlations, and blue edges represent negative correlations. The colors of the circles represent different phyla of the cecal microbiota. The sizes of the nodes represent species abundance. Co-occurrence network diagram of the cecal microbiota in the JR group (A), the R_JR group (B), the JS group (C), and the R_JS group (D). JR, resistant group; R_JR, resistant group in the recovery period; JS, susceptible group; R_JS, susceptible group in the recovery period.

References

    1. Shirley M.W., Smith A.L., Tomley F.M. The biology of avian Eimeria with an emphasis on their control by vaccination. Adv. Parasitol. 2005;60:285–330. - PubMed
    1. Choi J., Ko H., Tompkins Y.H., Teng P.Y., Lourenco J.M., Callaway T.R., Kim W.K. Effects of Eimeria tenella infection on key parameters for feed efficiency in broiler chickens. Animals. 2021;11:3428. doi: 10.3390/ani11123428. - DOI - PMC - PubMed
    1. Leung H., Yitbarek A., Snyder R., Patterson R., Barta J.R., Karrow N., Kiarie E. Responses of broiler chickens to Eimeria challenge when fed a nucleotide-rich yeast extract. Poult. Sci. 2019;98:1622–1633. doi: 10.3382/ps/pey533. - DOI - PMC - PubMed
    1. Li X., Jiang X.J., Qi D.X., Wang X., Wang C., Fei C., Zhou W., Li J., Zhang K. Effects of ethanamizuril, sulfachlorpyridazine or their combination on cecum microbial community and metabolomics in chickens infected with Eimeria tenella. Microb. Pathog. 2022;173:105823. doi: 10.1016/j.micpath.2022.105823. - DOI - PubMed
    1. Hessenberger S., Schatzmayr G., Teichmann K. In vitro inhibition of Eimeria tenella sporozoite invasion into host cells by probiotics. Vet. Parasitol. 2016;229:93–98. doi: 10.1016/j.vetpar.2016.10.001. - DOI - PubMed

LinkOut - more resources