. 2024 Sep 19;14(9):935.
doi: 10.3390/brainsci14090935.

Abnormal Dynamic Reconfiguration of Multilayer Temporal Networks in Patients with Bipolar Disorder

Affiliations

Abnormal Dynamic Reconfiguration of Multilayer Temporal Networks in Patients with Bipolar Disorder

Luyao Lai et al. Brain Sci. .

Abstract

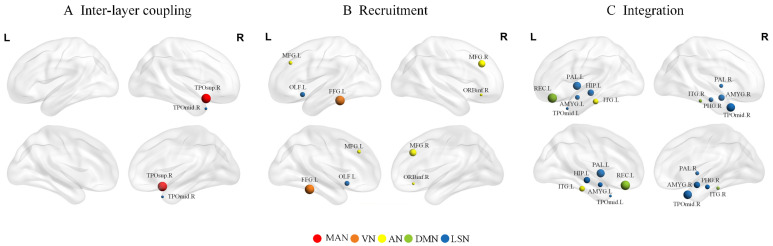
Multilayer networks have been used to identify abnormal dynamic reconfiguration in bipolar disorder (BD). However, these studies ignore the differences in information interactions between adjacent layers when constructing multilayer networks, and the analysis of dynamic reconfiguration is not comprehensive enough; Methods: Resting-state functional magnetic resonance imaging data were collected from 46 BD patients and 54 normal controls. A multilayer temporal network was constructed for each subject, and inter-layer coupling of different nodes was considered using network similarity. The promiscuity, recruitment, and integration coefficients were calculated to quantify the different dynamic reconfigurations between the two groups; Results: The global inter-layer coupling, recruitment, and integration coefficients were significantly lower in BD patients. These results were further observed in the attention network and the limbic/paralimbic and subcortical network, reflecting reduced temporal stability, intra- and inter-subnetwork communication abilities in BD patients. The whole-brain promiscuity was increased in BD patients. The same results were observed in the somatosensory/motor and auditory network, reflecting more functional interactions; Conclusions: This study discovered abnormal dynamic interactions of BD from the perspective of dynamic reconfiguration, which can help to understand the pathological mechanisms of BD.

Keywords: bipolar disorder; dynamic reconfiguration; inter-layer coupling; multilayer temporal network; phase coherence.


Conflict of interest statement

The authors declare no potential conflicts of interest in the research.

Figures

Figure 1
Figure 1
Flowchart of the methodology of this study. (A) Data preprocessing. Time series were extracted from the functional magnetic resonance imaging signal using AAL-90 atlas. (B) Multilayer temporal network construction. Hilbert transform was applied to the time series for each region. The functional connectivity of each time layer was estimated using phase coherence. The similarity is calculated to obtain the inter-layer coupling of the corresponding nodes of the neighboring time layers. (C) Multilayer community detection. Perform multilayer community detection for the constructed multilayer temporal network. Different colors indicate that the nodes are divided into different communities. (D) Dynamic reconfiguration metrics. Calculate the dynamic reconfiguration metrics recruitment coefficient, integration coefficient, and promiscuity (the node circled by dashed lines are involved in three modules) based on the results after dividing the communities.
Figure 2
Figure 2
Group differences at the whole-brain level. (A) Inter-layer coupling strength. (B) Promiscuity. (C) Recruitment. (D) Integration. Asterisks indicate the p-values of significant group differences: * denotes p < 0.05 and ** denotes p < 0.01.
Figure 3
Figure 3
Group differences at the resting-state functional networks (RSNs) level. (A) Inter-layer coupling strength. (B) Promiscuity. (C) Recruitment. (D) Integration. Asterisks represent the difference between groups: * denotes p < 0.05 and ** denotes p < 0.01.
Figure 4
Figure 4
Group differences in integration for each pair of RSNs. Asterisks indicate the p-values of significant group differences: * denotes p < 0.05. (A) Group differences in integration for AN-LSN; (B) Group differences in integration for DMN-LSN.
Figure 5
Figure 5
Brain maps of regions with significant differences in (A) inter-layer coupling, (B) recruitment and (C) integration. The size of the nodes is weighted by the t-value representing the difference between BD and NC, and the color represents the subnetwork to which the node belongs.
Figure 6
Figure 6
Spearman’s correlations between integration and Hamilton Depression Scale (HAMD) and Young Mania Rating Scale (YMRS) scores. (A) The correlation between whole-brain integration coefficient and HAMD score. (B) The correlation between whole-brain integration coefficient and YMRS score. (C) The correlation between integration in the right middle temporal gyrus of the temporal pole (TPOmid.R) region and HAMD score. (D) The correlation between integration in the TPOmid.R region and YMRS score. The dots in the figure represent each subject and the straight lines show the correlation between the integration coefficients and the scale scores.

Similar articles

References

    1. Barysheva M., Jahanshad N., Foland-Ross L., Altshuler L.L., Thompson P.M. White matter microstructural abnormalities in bipolar disorder: A whole brain diffusion tensor imaging study. NeuroImage Clin. 2013;2:558–568. doi: 10.1016/j.nicl.2013.03.016. - DOI - PMC - PubMed
    1. Vieta E., Berk M., Schulze T.G., Carvalho A.F., Suppes T., Calabrese J.R., Gao K., Miskowiak K.W., Grande I. Bipolar disorders. Nat. Rev. Dis. Primers. 2018;4:18008. doi: 10.1038/nrdp.2018.8. - DOI - PubMed
    1. McIntyre R.S., Berk M., Brietzke E., Goldstein B.I., López-Jaramillo C., Kessing L.V., Malhi G.S., Nierenberg A.A., Rosenblat J.D., Majeed A., et al. Bipolar disorders. Lancet. 2020;396:1841–1856. doi: 10.1016/S0140-6736(20)31544-0. - DOI - PubMed
    1. Fan F., Wang Z., Fan H., Shi J., Guo H., Yang F., Tan S., Tan Y. Functional disconnection between subsystems of the default mode network in bipolar disorder. J. Affect. Disord. 2023;325:22–28. doi: 10.1016/j.jad.2023.01.026. - DOI - PubMed
    1. Kamintsky L., Cairns K.A., Veksler R., Bowen C., Beyea S.D., Friedman A., Calkin C. Blood-brain barrier imaging as a potential biomarker for bipolar disorder progression. NeuroImage Clin. 2020;26:102049. doi: 10.1016/j.nicl.2019.102049. - DOI - PMC - PubMed

LinkOut - more resources