Comparative Study
. 2024 Sep 10;25(18):9781.
doi: 10.3390/ijms25189781.

Comparison of Mitochondrial and Antineoplastic Effects of Amiodarone and Desethylamiodarone in MDA-MB-231 Cancer Line

Affiliations
Comparative Study

Comparison of Mitochondrial and Antineoplastic Effects of Amiodarone and Desethylamiodarone in MDA-MB-231 Cancer Line

Fadi H J Ramadan et al. Int J Mol Sci. .

Abstract

Previously, we have demonstrated that amiodarone (AM), a widely used antiarrhythmic drug, and its major metabolite desethylamiodarone (DEA) both affect several mitochondrial processes in isolated heart and liver mitochondria. Also, we have established DEA's antitumor properties in various cancer cell lines and in a rodent metastasis model. In the present study, we compared AM's and DEA's mitochondrial and antineoplastic effects in a human triple-negative breast cancer (TNBC) cell line. Both compounds reduced viability in monolayer and sphere cultures and the invasive growth of the MDA-MB-231 TNBC line by inducing apoptosis. They lowered mitochondrial trans-membrane potential, increased Ca2+ influx, induced mitochondrial permeability transition, and promoted mitochondrial fragmentation. In accordance with their mitochondrial effects, both substances massively decreased overall, and even to a greater extent, mitochondrial ATP production decreased, as determined using a Seahorse live cell respirometer. In all these effects, DEA was more effective than AM, indicating that DEA may have higher potential in the therapy of TNBC than its parent compound.

Keywords: apoptosis; cancer cell energy metabolism; drug repositioning; mitochondrial drug; mitochondrial dysfunction.


Conflict of interest statement

The authors declare no conflicts of interest. The funders had no role in the design of the study; the collection, analyses, or interpretation of data; the writing of the manuscript, or the decision to publish the results.

Figures

Figure 6
Figure 6
Effects of DEA and AM on energy metabolism of MDA-MB-231 cells. The cells were treated with 0 to 12.5 µM DEA or 0 to 35 µM AM for 6 h before recording OCR and ECAR for 75 min. The FoF1 ATPase inhibitor oligomycin, the uncoupler FCCP, and the respiratory inhibitors rotenone and antimycin A were added at 15, 35, and 55 min of the recording. The experimental protocol and the scheme for calculating the various respiratory parameters are shown in panel (A). Data are presented as representative original recordings (B,J) and as automatically calculated parameters (CI); mean ± SD of three independent experiments running in two replicates. OCR and ECAR data were normalized to mg protein content. OCR-ECAR ratios (K) and ATP production rates (L) were calculated from the raw data of panels (B,J) according to [40]. The upper- and lower-case letters above the bars denote groups significantly (p < 0.05) different from the others. In panels (K,L), blue and red bars denote oxidative phosphorylation and glycolysis, respectively.
Figure 1
Figure 1
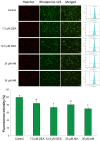
Effects of DEA and AM on ΔΨm of MDA-MB-231 cells. The cells were treated with 0, 7.5, or 12.5 µM DEA or with 25 or 35 µM AM for 6 h before loading them with R-123 dye and taking fluorescent microscopy images, as well as flow cytometry readings. The nuclei were counterstained with Hoechst 33342 (Hoechst). The results are presented as representative microscopy images of the same field in the red and green channels, as well as flow cytometry histograms of cells. The scale bar represents 25 µm. The horizontal and vertical axes of the histograms represent the fluorescence intensity of R-123 on a logarithmic scale of 101–106 arbitrary units and event number on a linear scale of 0–400, respectively. The bar diagram shows the mean fluorescent intensity normalized to the fluorescent intensity of control, mean ± standard error of the mean (SEM) of three independent experiments. The letters above the bars denote groups significantly (p < 0.05) different from the others.
Figure 2
Figure 2
Effects of DEA and AM on mitochondrial network dynamics in MDA-MB-231 cells. The cells were treated with 0, 7.5, or 12.5 µM DEA or with 25 or 35 µM AM for 6 h before loading them with MitoTracker red dye and taking fluorescence microscopy images. Mitochondrial fragmentation was determined as described earlier [29]. The data are presented as representative images and as the percentage of fragmented mitochondria, mean ± SEM of three independent experiments. The scale bar represents 30 µm. The letters above the bars denote groups significantly (p < 0.05) different from the others.
Figure 3
Figure 3
Effects of DEA and AM on proteins regulating the mitochondrial fusion-fission process. MDA-MB-231 cells were treated with 0, 7.5, or 12.5 µM DEA or with 25 or 35 µM AM for 6 h, then homogenates of the cells were subjected to immunoblot analysis. The data are presented as representative blots and as pixel densities of protein bands, mean ± SEM of three independent experiments. The lower-case letters above the bars denote groups significantly (p < 0.05) different from the others of the same set. OPA1 L and S denote the long (active) and short (cleaved, inactive) forms of the protein.
Figure 4
Figure 4
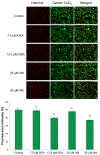
Effects of DEA and AM on mPT in MDA-MB-231 cells. The cells were treated with 0, 7.5, or 12.5 µM DEA or with 25 or 35 µM AM for 6 h before loading them with calcein + CoCl2 and taking fluorescent microscopy images. The nuclei were counterstained with Hoechst. The data are presented as representative merged images of the same field in the red and green channels, and as corrected total cell fluorescence (CTCF) normalized to the fluorescence intensity of the control, mean ± SEM of three independent experiments. The scale bar represents 25 µm. The lower-case letters above the bars denote groups significantly (p < 0.05) different from the others.
Figure 5
Figure 5
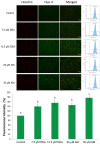
Effects of DEA and AM on [Ca2+]i in MDA-MB-231 cells. The cells were treated with 0, 7.5, or 12.5 µM DEA or with 25 or 35 µM AM for 3 h before loading them with Fluo-4AM dye and taking fluorescent microscopy images, as well as flow cytometry readings. The nuclei were counterstained with Hoechst. The results are presented as representative microscopy images of the same field in the red and green channels, as well as flow cytometry histograms of cells. The scale bar represents 25 µm. The horizontal and vertical axes of the histograms represent the fluorescence intensity of Fluo-4AM on a logarithmic scale of 101–106 arbitrary units and event number on a linear scale of 0–300, respectively. The bar diagram shows the fluorescence intensity normalized to the fluorescence intensity of the control, mean ± SEM of three independent experiments. The letters above the bars denote groups significantly (p < 0.05) different from the others.
Figure 7
Figure 7
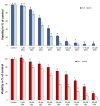
Effects of DEA and AM on the viability of MDA-MB-231 cells. We treated the MDA-MB-231 cells with 0–20 µM DEA or 0–50 µM for 24 h (dark bars) or 48 h (light bars) before measuring their viability using the SRB assay. We presented viability as the percentage of the untreated control, means ± SEM of five independent experiments. The upper and lower-case letters above the bars denote groups significantly (p < 0.05) different from the others.
Figure 8
Figure 8
Effects of DEA and AM on the viability of MDA-MB-231 spheroids. We treated the spheroid cultures with 0, 7.5, or 12.5 µM DEA or with 25 or 35 µM AM for 72 h before adding calcein and ethidium homodimer (ETHD) to the medium. Images were captured in the green and red channels of a fluorescence microscope. The results are presented as representative images and bar diagrams of three independent experiments. For the latter, CTCFs were normalized to the total protein content of permeabilized spheroids and were expressed as the percentage of the untreated cultures mean ± SEM. The scale bar represents 200 µm. The upper- and lower-case letters above the bars denote groups significantly (p < 0.05) different from the others of the same set.
Figure 9
Figure 9
Effect of DEA and AM on apoptosis in MDA-MB-231 cells. We treated the MDA-MB-231 cells with 0, 7.5, or 12.5 µM DEA or with 25 or 35 µM AM for 6 h before determining the type of cell death using flow cytometry followed by double-staining with FITC-Annexin V and 7-AAD. The results are presented as representative scatter plots and bar diagrams of three independent experiments. The x (Annexin V) and y (viability) axes of the scatter plots indicate FITC-Annexin V and 7-AAD fluorescence intensities, respectively. In the bar diagrams, live (green bars), early (middle bars), and late (striped bars) apoptotic cells are expressed as the percentage of the total cell number mean ± SEM. The different characters above the bars denote groups significantly (p < 0.05) different from the others of the same set.
Figure 10
Figure 10
Effects of DEA and AM on apoptosis markers in MDA-MB-231 cells. We treated the MDA-MB-231 cells with 0, 7.5, or 12.5 µM DEA or with 25 or 35 µM AM for 24 h before homogenization (A) or isolation of nuclear (N), mitochondrial (M) and cytosolic (C) extracts by subcellular fractionation (B). We assessed the levels of p53 phosphorylation, caspase 3- and PARP1-cleavage (A), and the release of OMI, AIF, and cytochrome C from the mitochondria (B) by immunoblotting. Actin (whole cell and cytosol), cytochrome oxidase (COX IV; mitochondrium), and histone H1 (HH1; nucleus) were used as loading controls. The results are presented as representative blots and pixel densities of the bands, mean ± SEM of three independent experiments. The upper- and lower-case letters above the bars denote groups significantly (p < 0.05) different from the others of the same set.
Figure 11
Figure 11
Effects of DEA on wound healing in MDA-MB-231 cell line. A wound was inflicted onto semi-confluent cultures of MDA-MB-231 cells and the cultures were exposed to 0, 7.5, or 12.5 µM DEA or 25 or 35 µM AM for 12 h. The data are presented as representative images of the wounds taken at 0, 6, and 24 h, and the wound area is expressed as the percentage of untreated plates at the 0 h time-point, mean ± SEM of two independent experiments running in duplicates. The letters above the bars denote groups significantly (p < 0.05) different from the others of the same set.

References

    1. Mujovic N., Dobrev D., Marinkovic M., Russo V., Potpara T.S. The role of amiodarone in contemporary management of complex cardiac arrhythmias. Pharmacol. Res. 2020;151:104521. doi: 10.1016/j.phrs.2019.104521. - DOI - PubMed
    1. Nattel S., Talajic M., Quantz M., DeRoode M. Frequency-dependent effects of amiodarone on atrioventricular nodal function and slow-channel action potentials: Evidence for calcium channel-blocking activity. Circulation. 1987;76:442–449. doi: 10.1161/01.CIR.76.2.442. - DOI - PubMed
    1. Nokin P., Clinet M., Schoenfeld P. Cardiac beta-adrenoceptor modulation by amiodarone. Biochem. Pharmacol. 1983;32:2473–2477. doi: 10.1016/0006-2952(83)90004-7. - DOI - PubMed
    1. Varro A., Virag L., Papp J.G. Comparison of the chronic and acute effects of amiodarone on the calcium and potassium currents in rabbit isolated cardiac myocytes. Br. J. Pharmacol. 1996;117:1181–1186. doi: 10.1111/j.1476-5381.1996.tb16713.x. - DOI - PMC - PubMed
    1. Colunga Biancatelli R.M., Congedo V., Calvosa L., Ciacciarelli M., Polidoro A., Iuliano L. Adverse reactions of Amiodarone. J. Geriatr. Cardiol. 2019;16:552–566. doi: 10.11909/j.issn.1671-5411.2019.07.004. - DOI - PMC - PubMed

Publication types

MeSH terms

LinkOut - more resources