. 2024 Sep 11;25(18):9815.
doi: 10.3390/ijms25189815.

Analysis of the Rice Raffinose Synthase (OsRS) Gene Family and Haplotype Diversity

Affiliations

Analysis of the Rice Raffinose Synthase (OsRS) Gene Family and Haplotype Diversity

Jinguo Zhang et al. Int J Mol Sci. .

Abstract

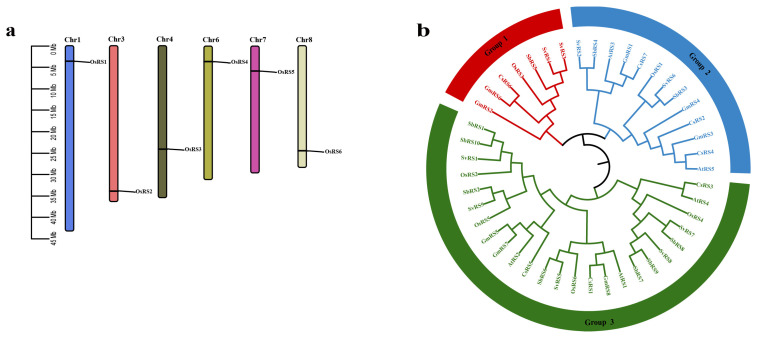
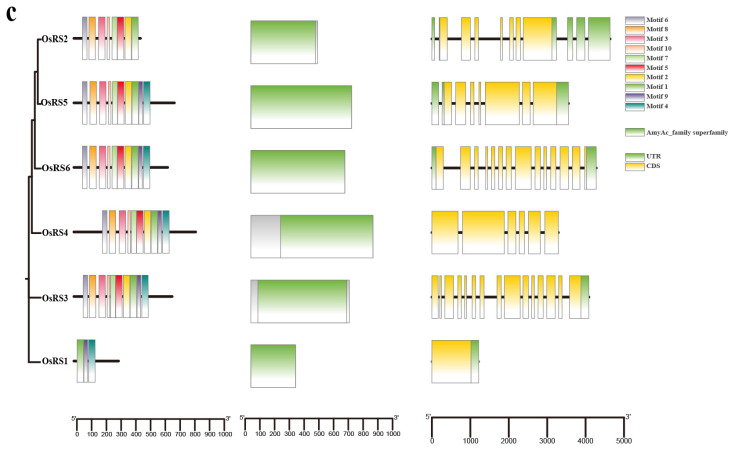
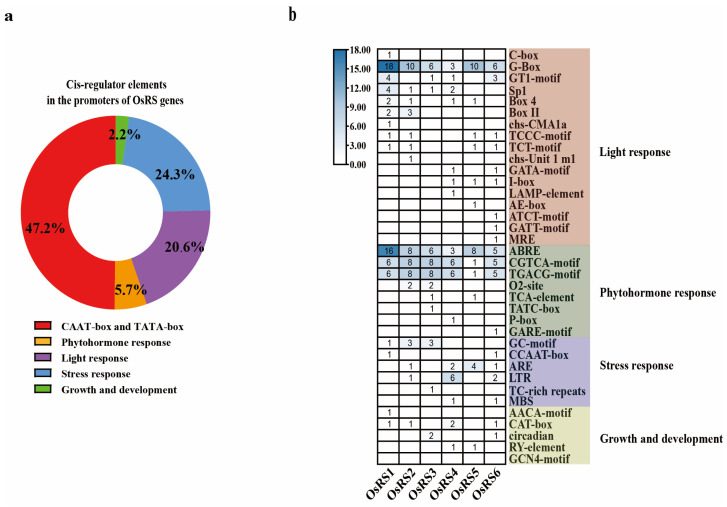
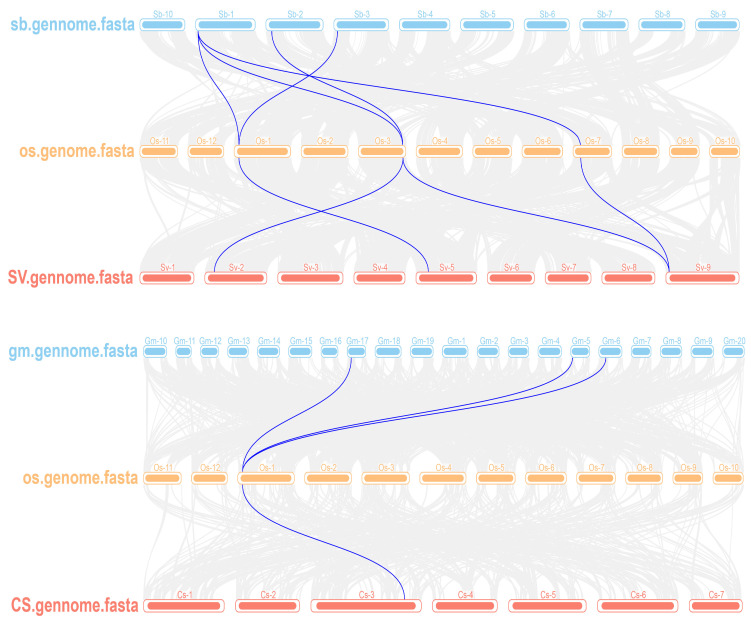
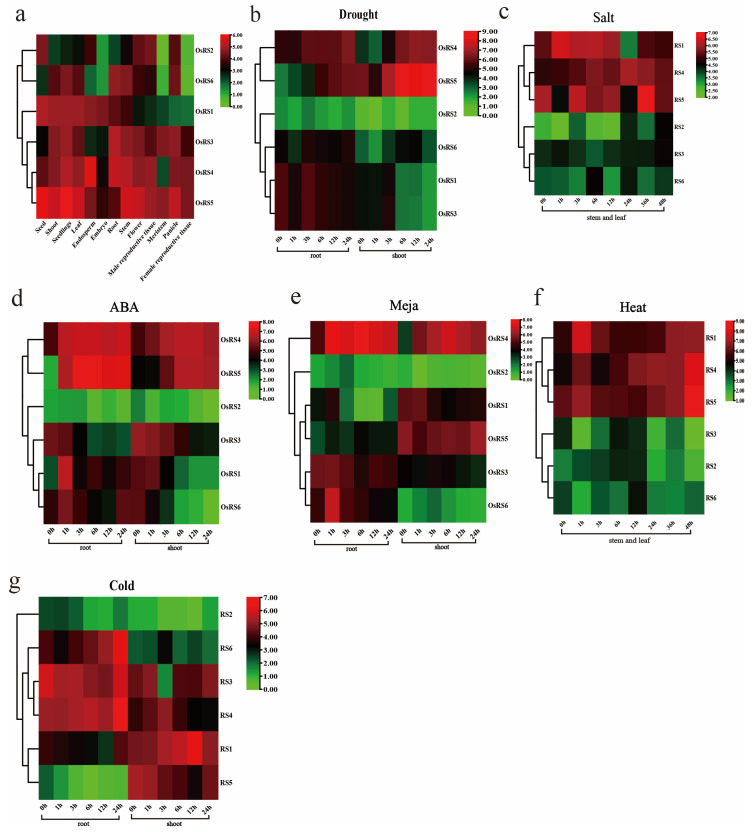
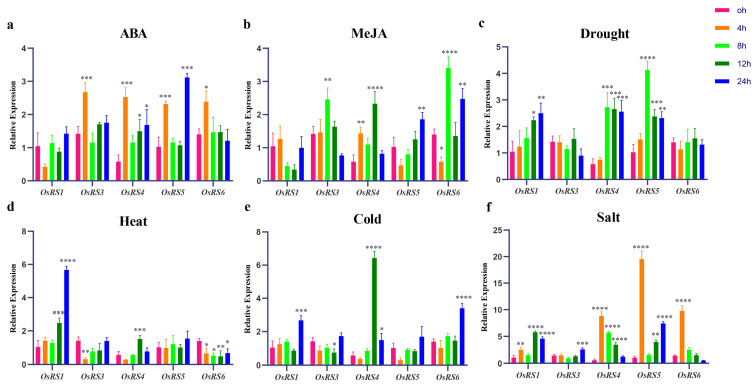
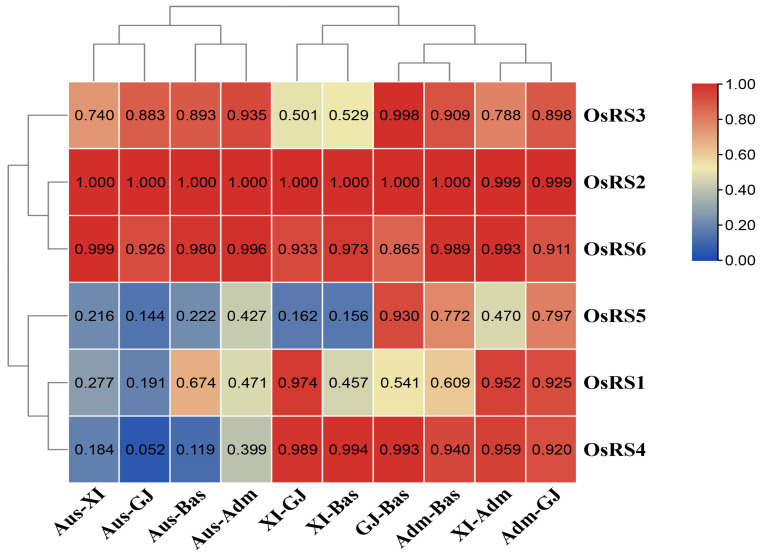
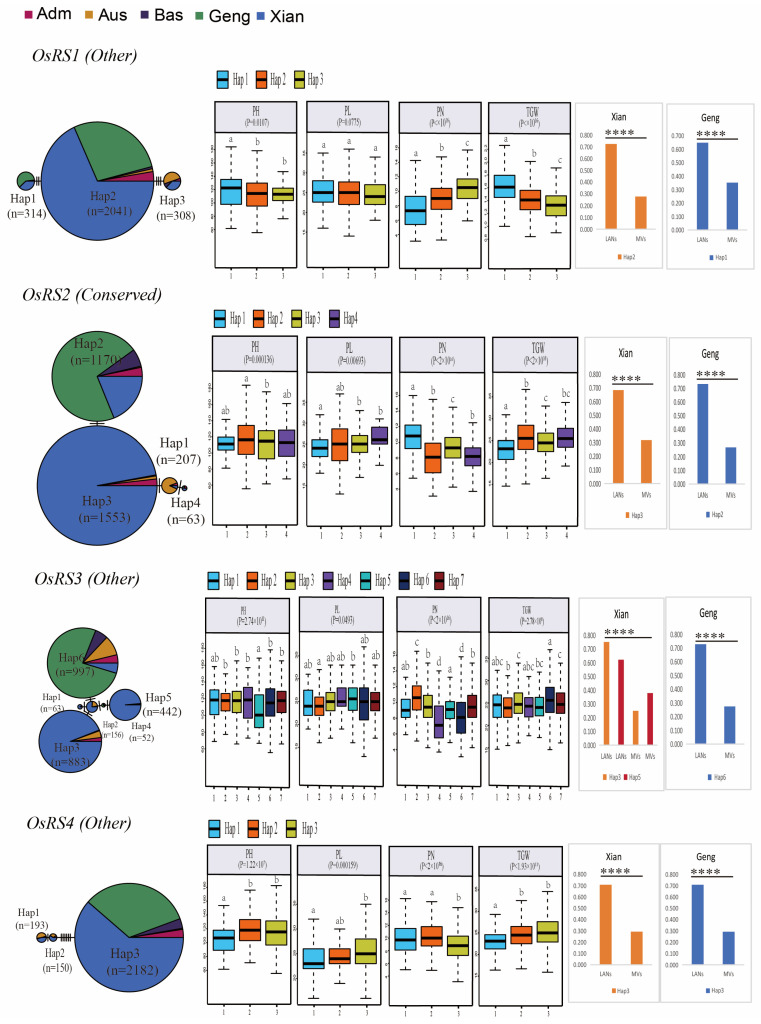
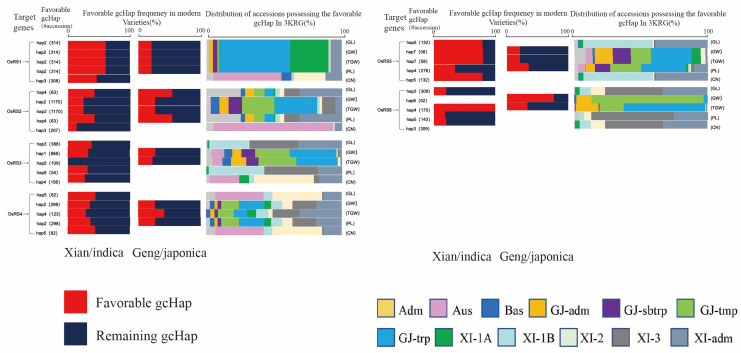
Based on the genome information of rice (Nipponbare), this study screened and identified six raffinose synthase (RS) genes and analyzed their physical and chemical properties, phylogenetic relationship, conserved domains, promoter cis-acting elements, and the function and genetic diversity of the gene-CDS-haplotype (gcHap). The results showed that these genes play key roles in abiotic stress response, such as OsRS5, whose expression in leaves changed significantly under high salt, drought, ABA, and MeJA treatments. In addition, the OsRS genes showed significant genetic variations in different rice populations. The main gcHaps of most OsRS loci had significant effects on key agronomic traits, and the frequency of these alleles varied significantly among different rice populations and subspecies. These findings provide direction for studying the RS gene family in other crops.

Keywords: abiotic stress; agronomic traits; genetic diversity; gene–CDS–haplotype; raffinose synthase; rice.


Conflict of interest statement

The authors declare no conflicts of interest.

Figures

Figure 1
Figure 1
Characteristics of OsRS genes. (a) Chromosomal localization of OsRS genes. (b) Phylogenetic trees of OsRS genes from Nipponbare (Os), Glycine max (Gm), Arabidopsis thaliana (At), Setaria viridis (Sv), Sorghum bicolor (Sb) and Cucumis sativus (Cs). (c) Phylogenetic tree, motif prediction, domain, and exon-intron distribution of OsRS genes from left to right.
Figure 1
Figure 1
Characteristics of OsRS genes. (a) Chromosomal localization of OsRS genes. (b) Phylogenetic trees of OsRS genes from Nipponbare (Os), Glycine max (Gm), Arabidopsis thaliana (At), Setaria viridis (Sv), Sorghum bicolor (Sb) and Cucumis sativus (Cs). (c) Phylogenetic tree, motif prediction, domain, and exon-intron distribution of OsRS genes from left to right.
Figure 2
Figure 2
Analysis of cis-acting elements of the OsRS gene. (a) Distribution and proportion of cis-acting elements in the promoter region of the OsRS gene; different colors represent different proportions. (b) Heatmap analysis of cis-acting elements in the promoter region of OsRS genes. In the heatmap, the numerical values represent the quantity of different cis-acting elements, with darker colors indicating higher quantities.
Figure 3
Figure 3
Collinear relationship between OsRS genes and genes from other species. The collinear regions of the genome of rice (Nipponbare) and other species are represented by grey lines and collinear gene pairs by blue lines. Oryza sativa L. (Nipponbare) is represented by Os; Glycine max is represented by Gm; Sorghum bicolor is represented by Sb; Setaria viridis is denoted by Sv; and Cucumis sativus is represented by Cs.
Figure 4
Figure 4
Homologous relationship and chromosomal localization of OsRS genes. The line indicates a homologous relationship.
Figure 5
Figure 5
Analysis of OsRS gene expression. Color markers indicate changes in gene expression. Red indicates high expression, and green indicates low expression. (a) Expression of OsRS genes in the leaf, root, seedling, stem, flower, embryo, shoot, meristem, male reproductive tissue, female reproductive tissue, panicle, and seed. (b) Expression levels of OsRS genes in the root and shoot after drought stress. (c) Expression levels of OsRS genes in the stem and leaf of rice after high salt stress. (d) Expression levels of OsRS genes in the root and shoot after ABA hormone treatment. (e) Expression levels of OsRS genes in the root and shoot after MeJA treatment. (f) Expression levels of OsRS genes in the stem and leaf after heat treatment. (g) Expression levels of OsRS genes in the root and shoot after cold stress.
Figure 6
Figure 6
Analysis of expression levels of five genes of the OsRS family under different treatments: (a) 100 μmol/L ABA treatment; (b) 100 μmol/L MeJA treatment; (c) 20% PEG6000 simulated drought stress. (d) 200 mmol/L NaCl simulated salt stress; (e) 42 °C heat treatment; (f) 6 °C cold treatment. Statistical analysis of the data was performed using WPS2023 software, and IBM SPSS Statistics 25 statistics analysis software was used to perform analysis of variance; the significance level was defined as **** p < 0.0001, *** p < 0.001, ** p < 0.01, * p < 0.05.
Figure 7
Figure 7
Genetic diversity index (INei) of OsRS genes in pairwise comparison of different populations calculated from gcHap data.
Figure 8
Figure 8
Haplotype networks of four cloned OsRS genes and four associated agronomic traits in 3KRG. The letters indicate differences between haplotypes assessed by two-factor ANOVA, where different letters on the boxplot indicate statistically significant differences at p < 0.05 based on Duncan’s multirange test. The bar chart on the right shows the difference in frequency of major gcHaps between local varieties (LANs) and modern varieties (MVs) of Xian and Geng. A chi-square test was used to determine significant differences in the proportion of a gcHap between different populations **** p < 0.0001.
Figure 9
Figure 9
Favorable gcHap frequencies of six OsRS genes affecting TGW, GL, GW, PL, and CN in Xian/indica (XI), Geng/japonica rice (GJ), and different rice subpopulations.”#accession”indicates the number of accessions that possess the favorable gcHap.Five subpopulations of XI (XI—1A, XI—1B, XI—2, XI—3, and XI—adm) and four subpopulations of GJ (temperate GJ: GJ—tmp, subtropical GJ: GJ—sbtrp, tropical GJ: GJ—trp, and GJ—adm).

References

    1. Li S.H., Li T.P., Kim W.D., Kitaoka M., Yoshida S., Nakajima M., Kobayashi H. Characterization of raffinose synthase from rice (Oryza sativa L. var. Nipponbare) Biotechnol. Lett. 2007;29:635–640. doi: 10.1007/s10529-006-9268-3. - DOI - PubMed
    1. Egert A., Keller F., Peters S. Abiotic stress—induced accumulation of raffinose in Arabidopsis leaves is mediated by a single raffinose synthase (RS5, At5g40390) Bmc Plant Biol. 2013;13:218. doi: 10.1186/1471-2229-13-218. - DOI - PMC - PubMed
    1. Jing Q.K., Chen A.R., Lv Z.Y., Dong Z.H., Wang L.X., Meng X.K., Feng Y., Wan Y., Su C.Y., Cui Y.J., et al. Systematic Analysis of Galactinol Synthase and Raffinose Synthase Gene Families in Potato and Their Expression Patterns in Development and Abiotic Stress Responses. Genes. 2023;14:1344. doi: 10.3390/genes14071344. - DOI - PMC - PubMed
    1. Guo J.G., Yang Y., Wang T.T., Wang Y.Z., Zhang X., Min D.H., Zhang X.H. Analysis of Raffinose Synthase Gene Family in Bread Wheat and Identification of Drought Resistance and Salt Tolerance Function of TaRS15-3B. Int. J. Mol. Sci. 2023;24:11185. doi: 10.3390/ijms241311185. - DOI - PMC - PubMed
    1. Wang T., Wang Y.Q., Zhao J.M., Kong J.M., Zhang L.Z., Qi S.Y., Chen J.J., Chen Z.D., Zeng W., Sun W.J. Identification, Characterization and Expression Profiling of the RS Gene Family during the Withering Process of White Tea in the Tea Plant (Camellia sinensis) Reveal the Transcriptional Regulation of CsRS8. Int. J. Mol. Sci. 2023;24:202. doi: 10.3390/ijms24010202. - DOI - PMC - PubMed

LinkOut - more resources