. 2024 Sep 11;25(18):9828.
doi: 10.3390/ijms25189828.

Zeaxanthin and Lutein Ameliorate Alzheimer's Disease-like Pathology: Modulation of Insulin Resistance, Neuroinflammation, and Acetylcholinesterase Activity in an Amyloid-β Rat Model

Affiliations

Zeaxanthin and Lutein Ameliorate Alzheimer's Disease-like Pathology: Modulation of Insulin Resistance, Neuroinflammation, and Acetylcholinesterase Activity in an Amyloid-β Rat Model

Da-Sol Kim et al. Int J Mol Sci. .

Abstract

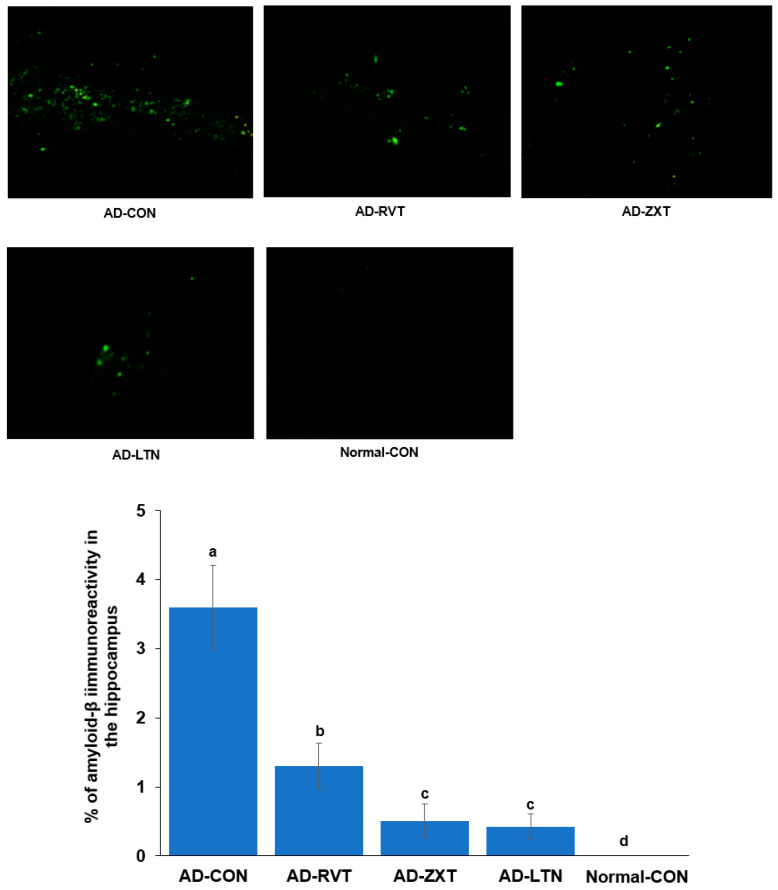
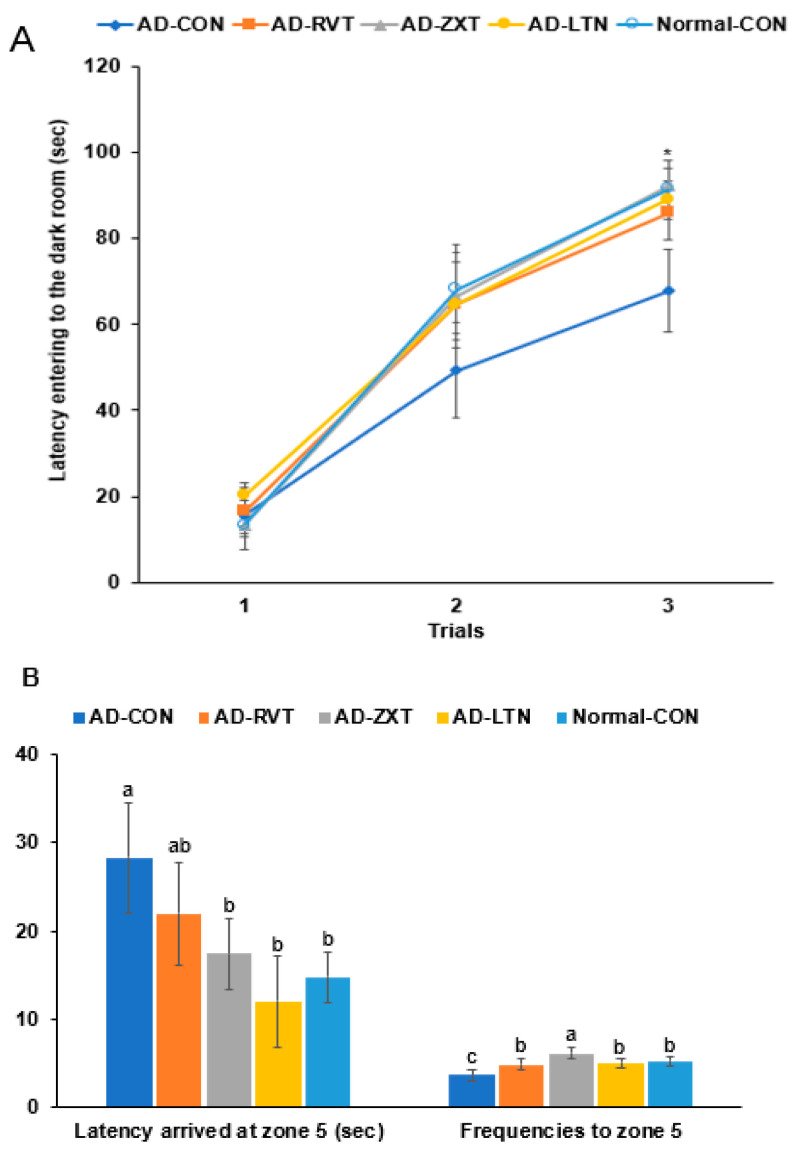
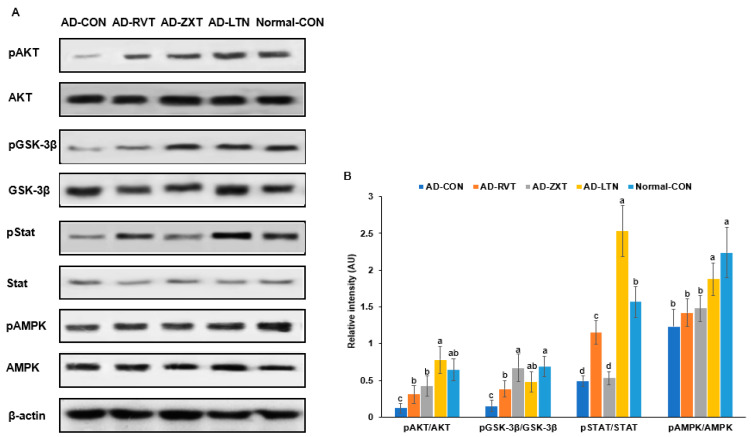
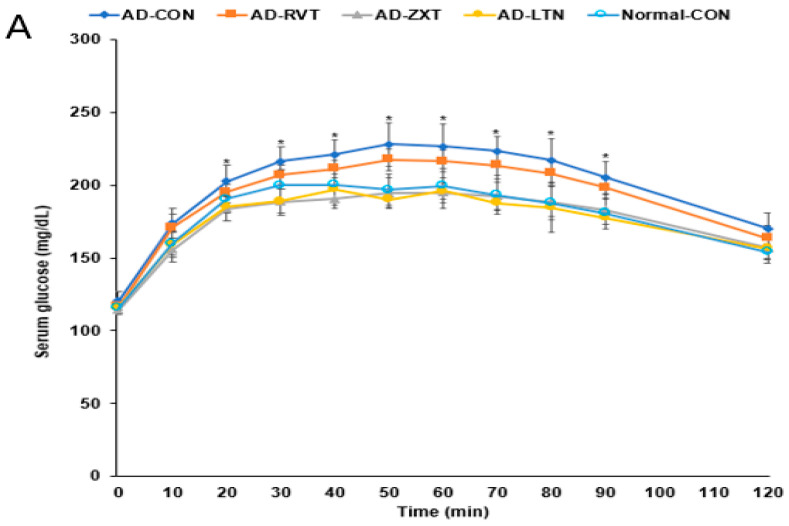
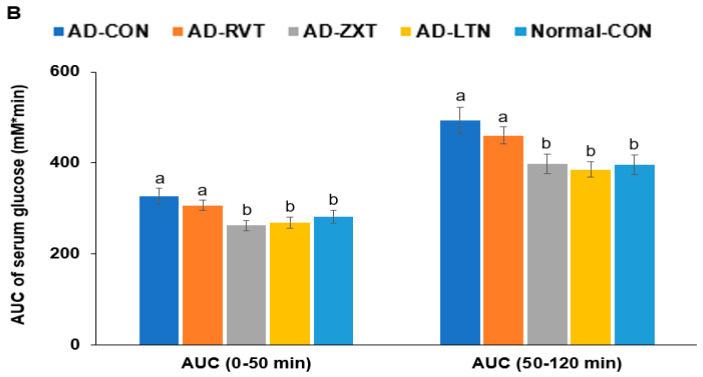
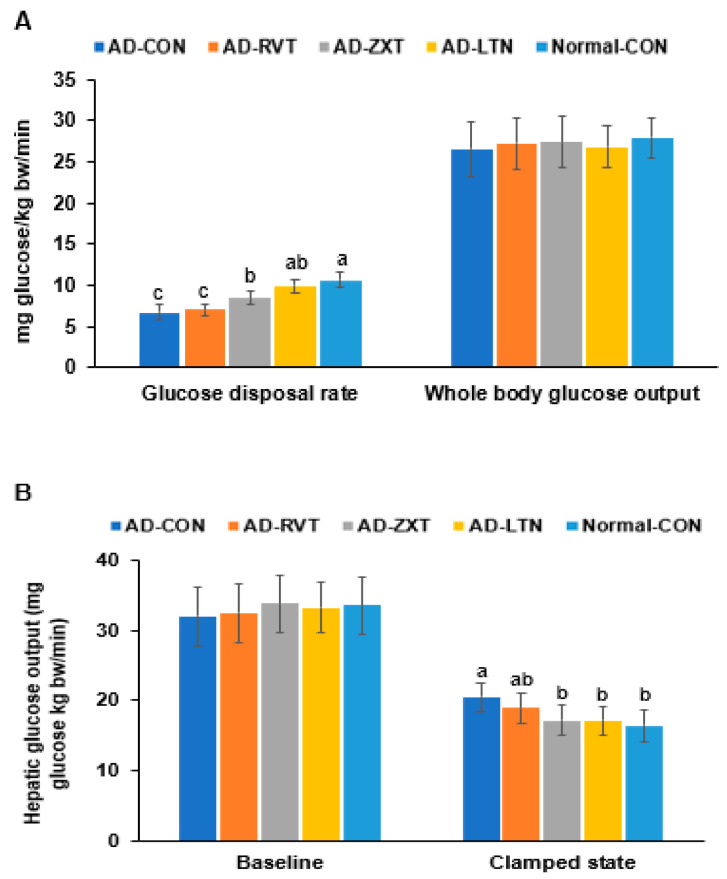
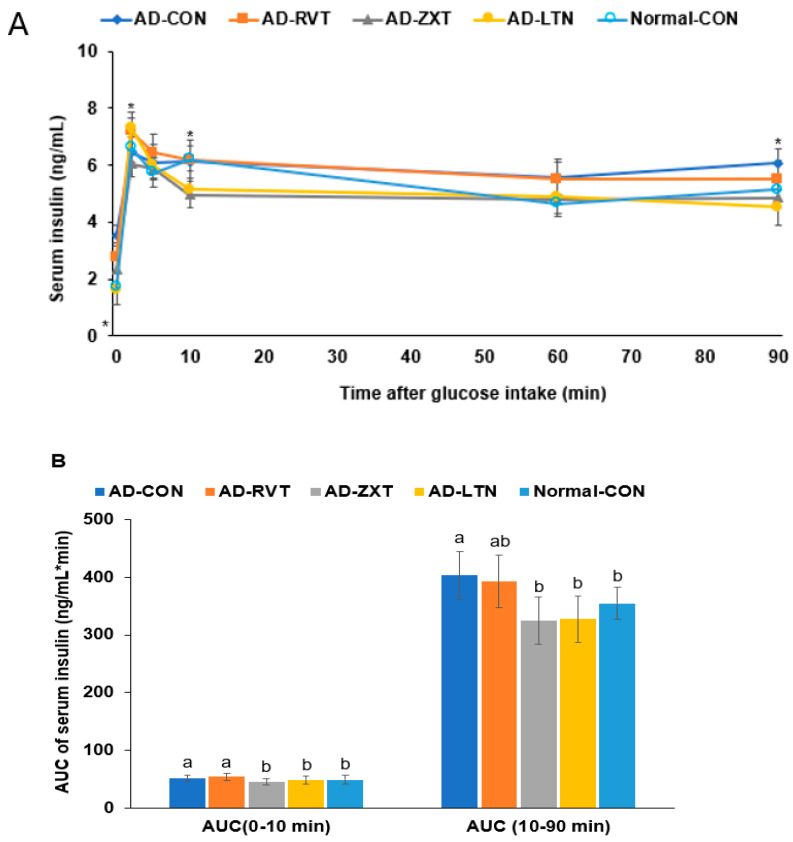
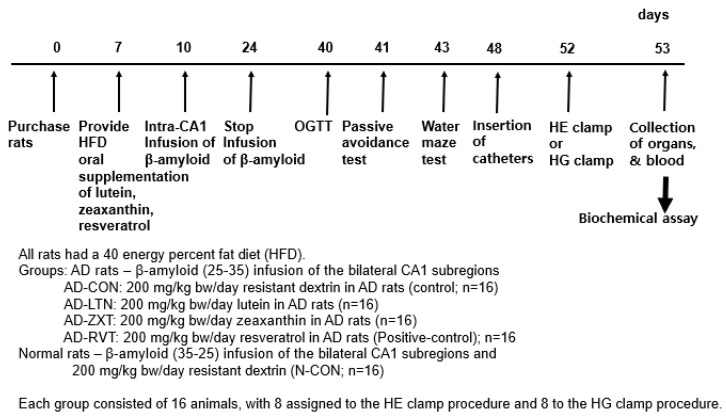
Alzheimer's disease (AD) is characterized by impaired insulin/insulin-like growth factor-1 signaling in the hippocampus. Zeaxanthin and lutein, known for their antioxidant and anti-inflammatory properties, have been reported to protect against brain damage and cognitive decline. However, their mechanisms related to insulin signaling in AD remain unclear. This study investigated the efficacy and mechanisms of zeaxanthin, lutein, and resveratrol in modulating an AD-like pathology in an amyloid-β rat model. Rats were administered hippocampal infusions of 3.6 nmol/day amyloid-β (Aβ)(25-35) for 14 days to induce AD-like memory deficits (AD-CON). Normal control rats received Aβ(35-25) (Normal-CON). All rats had a high-fat diet. Daily, AD rats consumed 200 mg/kg body weight of zeaxanthin (AD-ZXT), lutein (AD-LTN), and resveratrol (AD-RVT; positive-control) or resistant dextrin as a placebo (AD-CON) for eight weeks. The AD-CON rats exhibited a higher Aβ deposition, attenuated hippocampal insulin signaling (reduced phosphorylation of protein kinase B [pAkt] and glycogen synthase kinase-3β [pGSK-3β]), increased neuroinflammation, elevated acetylcholinesterase activity, and memory deficits compared to the Normal-CON group. They also showed systemic insulin resistance and high hepatic glucose output. Zeaxanthin and lutein prevented memory impairment more effectively than the positive-control resveratrol by suppressing acetylcholinesterase activity, lipid peroxidation, and pro-inflammatory cytokines (TNF-α, IL-1β). They also potentiated hippocampal insulin signaling and increased brain-derived neurotrophic factor (BDNF) and ciliary neurotrophic factor (CTNF) mRNA expression to levels comparable to the Normal-CON rats. Additionally, zeaxanthin and lutein improved glucose disposal, reduced hepatic glucose output, and normalized insulin secretion patterns. In conclusion, zeaxanthin and lutein supplementation at doses equivalent to 1.5-2.0 g daily in humans may have practical implications for preventing or slowing human AD progression by reducing neuroinflammation and maintaining systemic and central glucose homeostasis, showing promise even when compared to the established neuroprotective compound resveratrol. However, further clinical trials are needed to evaluate their efficacy and safety in human populations.

Keywords: carotenoids; hippocampal insulin signaling; memory impairment; systemic insulin resistance.


Conflict of interest statement

The authors declare no conflicts of interest.

Figures

Figure 1
Figure 1
Amyloid-β accumulation in the hippocampus. Image amyloid-β deposition in the hippocampus (X100 magnification). Green dots are shown as amyloid-β deposition represented by immunohistochemistry with anti-amyloid-β antibody. The percentage of amyloid-β immunoreactivity in the hippocampus (n = 8 for each group) is shown. AD-CON (control), AD-LTN, AD-ZXT, and AD-RVT (positive-control) represent the groups of assigned 200 mg/kg bw/day resistant dextrin, luteolin, zeaxanthin, or resveratrol in amyloid-β-infused rats. Normal-Con rats infused with β-amyloid (35-25) received and consumed 200 mg/kg bw/day resistant dextrin. Different letters (a, b, c, d) on the bars are significantly different from each other (p < 0.05) by Tukey’s post hoc test. Bars with the same letter (a, a) are not significantly different.
Figure 2
Figure 2
Memory function. (A). Latency time to enter the darkroom in the passive avoidance test (n = 16). (B). Latency time and frequencies of locating zone 5 located the platform on day 5 during the water maze test (n = 16). Each dot or bar with an error bar represents mean ± SD (n = 16 for each group). The β-amyloid (25-35)-infused rats were fed high-fat diets with 200 mg/kg bw/day resistant dextrin (AD-CON; control), lutein (AD-LTN), zeaxanthin (AD-ZXT), or resveratrol (AD-RVT; positive-control). The rats infused with β-amyloid (35-25) were fed a high-fat diet containing 200 mg/kg bw/day resistant dextrin, serving as normal controls (Normal-CON, Non-AD). * Significantly different at the time point among the groups at <0.05. Different letters (a, b, c) on the bars are significantly different from each other (p < 0.05) by Tukey’s post hoc test. Bars with the same letter (a, a) are not significantly different.
Figure 3
Figure 3
Hippocampal insulin signaling. (A). Immunoreactivity blots. (B). Intensity of the bands. After preparing the hippocampus lysates, the phosphorylation and expression of proteins related to insulin signaling were measured using a Western blot analysis, and their density was determined. Each dot and bar with error bars represent mean ± SD (n = 4 for each group). The amyloid-β (25-35)-infused rats were fed high-fat diets with 200 mg/kg bw resistant dextrin (AD-CON; control), lutein (AD-LTN), zeaxanthin (AD-ZXT), or resveratrol (AD-RVT; positive-control). The rats infused with amyloid-β (35-25) were fed a high-fat diet containing 200 mg resistant dextrin per kg bw and served as the normal control (Normal-CON, Non-AD). Different letters (a, b, c, d) on the bars are significantly different from each other (p < 0.05) by Tukey’s post hoc test. Bars with the same letter (a, a) are not significantly different. Akt, protein kinase A; GSK-3β, glycogen synthase kinase-3β; STAT-3, signal transducer and activator of transcription 3; AMPK, AMP kinase.
Figure 4
Figure 4
Oral glucose tolerance test with oral glucose intake (2 g/kg body weight). (A). Changes in the serum glucose levels (n = 16). (B). Area under the curve (AUC) of glucose. Each dot and bar with error bars represent (n = 16). Mean ± SD (n = 16 for each group). The β-amyloid (25-35)-infused rats were fed high-fat diets with 200 mg/kg bw resistant dextrin (AD-CON; control), lutein (AD-LTN), zeaxanthin (AD-ZXT), or resveratrol (AD-RVT; positive-control). The rats infused with β-amyloid (35-25) were fed a high-fat diet containing 200 mg resistant dextrin per kg bw and served as the normal control (Normal-CON, Non-AD). * Significantly different at the time point among the groups at <0.05. Different letters (a, b) on the bars are significantly different from each other (p < 0.05) by Tukey’s post hoc test. Bars with the same letter (a, a) are not significantly different.
Figure 4
Figure 4
Oral glucose tolerance test with oral glucose intake (2 g/kg body weight). (A). Changes in the serum glucose levels (n = 16). (B). Area under the curve (AUC) of glucose. Each dot and bar with error bars represent (n = 16). Mean ± SD (n = 16 for each group). The β-amyloid (25-35)-infused rats were fed high-fat diets with 200 mg/kg bw resistant dextrin (AD-CON; control), lutein (AD-LTN), zeaxanthin (AD-ZXT), or resveratrol (AD-RVT; positive-control). The rats infused with β-amyloid (35-25) were fed a high-fat diet containing 200 mg resistant dextrin per kg bw and served as the normal control (Normal-CON, Non-AD). * Significantly different at the time point among the groups at <0.05. Different letters (a, b) on the bars are significantly different from each other (p < 0.05) by Tukey’s post hoc test. Bars with the same letter (a, a) are not significantly different.
Figure 5
Figure 5
Metabolic parameters during the hyperinsulinemic–euglycemic clamp. (A). Whole-body glucose infusion rates (GIR) and glucose uptake. (B). Hepatic glucose output at the basal and clamped states (n = 8). Bars and error bars represent mean ± standard deviation. Each dot and bar with error bars represent mean ± SD (n = 8 for each group). The β-amyloid (25-35)-infused rats were fed high-fat diets with 200 mg/kg bw resistant dextrin (AD-CON; control), lutein (AD-LTN), zeaxanthin (AD-ZXT), or resveratrol (AD-RVT; positive-control). The rats infused with β-amyloid (35-25) were fed a high-fat diet containing 200 mg resistant dextrin per kg bw and served as normal controls (Normal-CON, Non-AD). Different letters (a, b, c) on the bars are significantly different from each other (p < 0.05) by Tukey’s post hoc test. Bars with the same letter (a, a) are not significantly different.
Figure 6
Figure 6
Insulin secretion capacity during the hyperglycemic clamp. (A). Changes in the serum insulin concentrations during the hyperglycemic clamps (n = 8 for each group). Serum insulin levels were measured when serum glucose levels were maintained at 5.5 mM above fasting levels. (B). Area under the curve (AUC) of serum insulin concentration. Each dot and bar with error bars represent mean ± SD (n = 8). The β-amyloid (25-35)-infused rats were fed high-fat diets with 200 mg/kg bw resistant dextrin (AD-CON; control), lutein (AD-LTN), zeaxanthin (AD-ZXT), or resveratrol (AD-RVT; positive-control). The rats infused with β-amyloid (35-25) were fed a high-fat diet containing 200 mg resistant dextrin per kg bw and served as normal controls (Normal-CON, Non-AD). Dots and error bars represent mean ± standard deviation. * Significantly different at the time point among the four groups at p < 0.05 by one-way ANOVA. Different letters (a, b) on the bars are significantly different from each other (p < 0.05) by Tukey’s post hoc test. Bars with the same letter (a, a) are not significantly different.
Figure 7
Figure 7
Experimental design. HE clamp, hyperinsulinemic–euglycemic clamp; HG clamp, hyperglycemic clamp.

Similar articles

Cited by

References

    1. DeTure M.A., Dickson D.W. The neuropathological diagnosis of Alzheimer’s disease. Mol. Neurodegener. 2019;14:32. doi: 10.1186/s13024-019-0333-5. - DOI - PMC - PubMed
    1. Wu M., Zhang M., Yin X., Chen K., Hu Z., Zhou Q., Cao X., Chen Z., Liu D. The role of pathological tau in synaptic dysfunction in Alzheimer’s diseases. Transl. Neurodegener. 2021;10:45. doi: 10.1186/s40035-021-00270-1. - DOI - PMC - PubMed
    1. Picca A., Calvani R., Coelho-Junior H.J., Landi F., Bernabei R., Marzetti E. Mitochondrial Dysfunction, Oxidative Stress, and Neuroinflammation: Intertwined Roads to Neurodegeneration. Antioxidants. 2020;9:647. doi: 10.3390/antiox9080647. - DOI - PMC - PubMed
    1. Wei Z., Koya J., Reznik S.E. Insulin Resistance Exacerbates Alzheimer Disease via Multiple Mechanisms. Front. Neurosci. 2021;15:687157. doi: 10.3389/fnins.2021.687157. - DOI - PMC - PubMed
    1. Park S., Moon N.R., Kang S., Kim D.S. Ferulic acid and vinpocetine intake improves memory function by enhancing insulin sensitivity and reducing neuroinflammation and oxidative stress in type 2 diabetic animals with induced Alzheimer’s disease. J. Funct. Foods. 2022;95:105180. doi: 10.1016/j.jff.2022.105180. - DOI

MeSH terms

LinkOut - more resources