. 2024 Sep 17;25(18):10005.
doi: 10.3390/ijms251810005.

Wnt/β-Catenin Signaling Regulates Yap/Taz Activity during Embryonic Development in Zebrafish

Affiliations

Wnt/β-Catenin Signaling Regulates Yap/Taz Activity during Embryonic Development in Zebrafish

Matteo Astone et al. Int J Mol Sci. .

Abstract

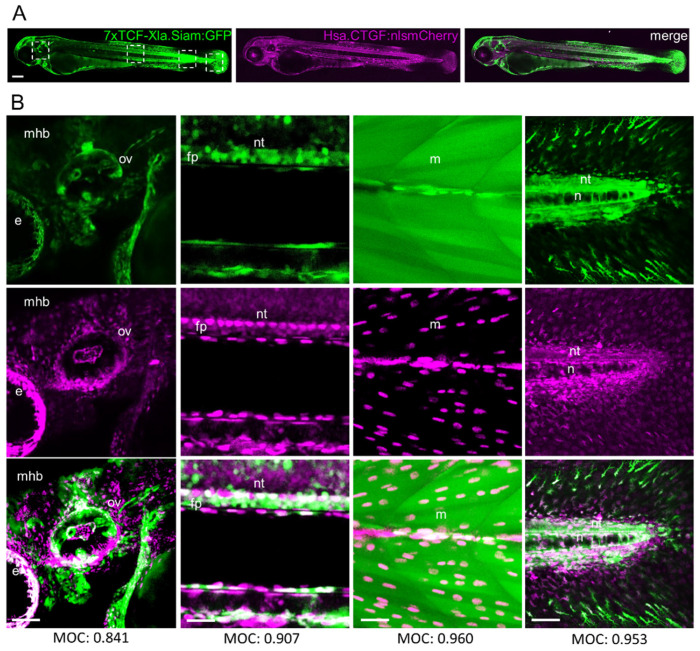
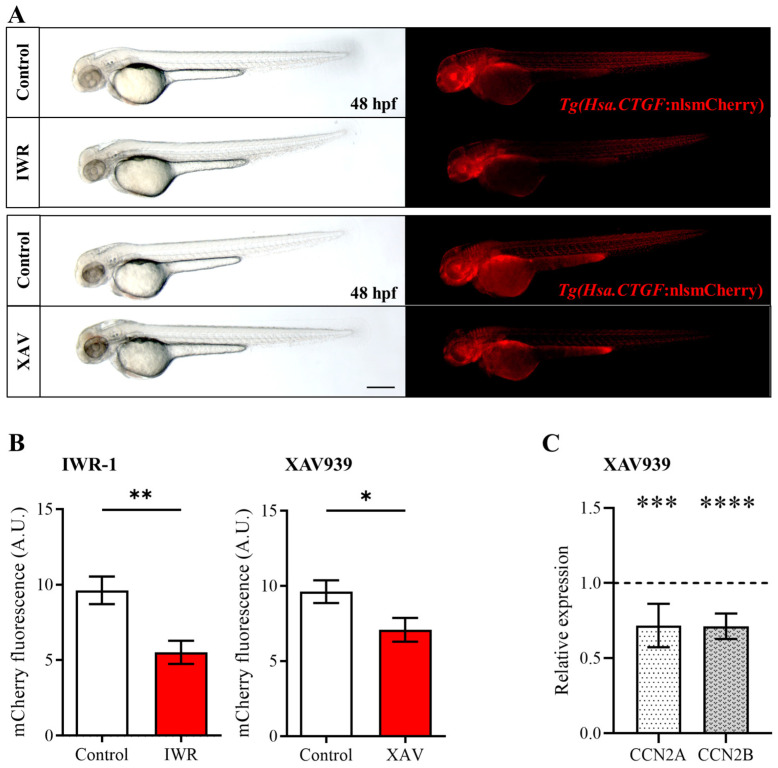
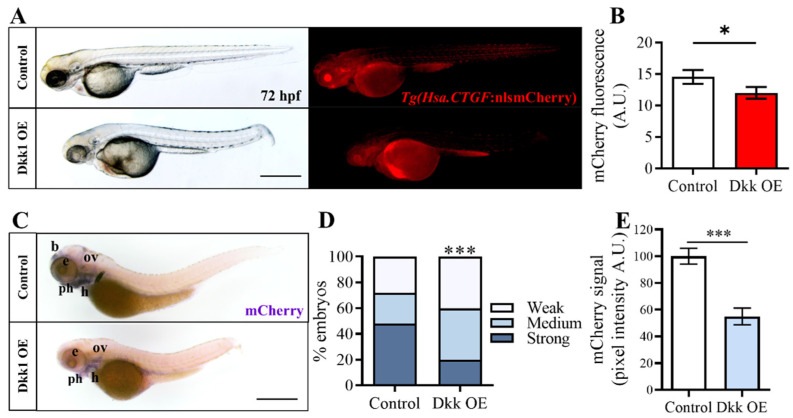
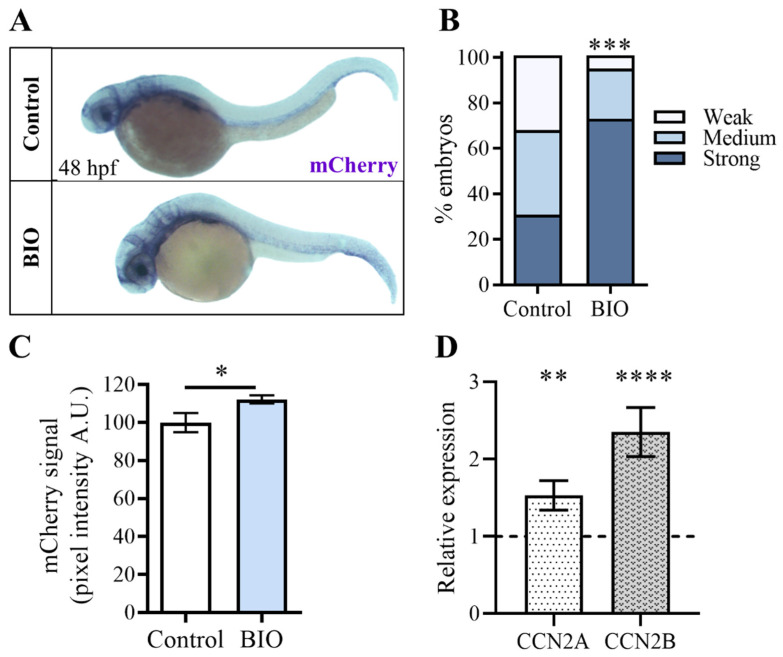
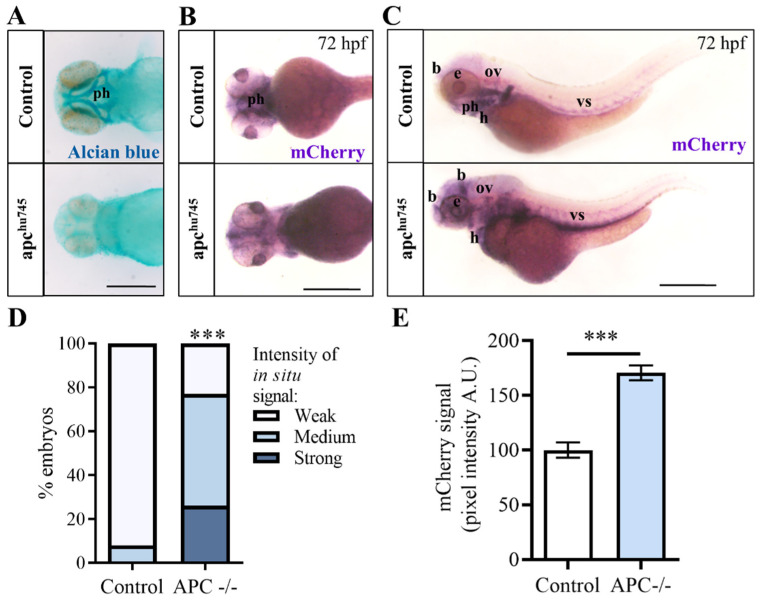
Hippo-YAP/TAZ and Wnt/β-catenin signaling pathways, by controlling proliferation, migration, cell fate, stemness, and apoptosis, are crucial regulators of development and tissue homeostasis. We employed zebrafish embryos as a model system to elucidate in living reporter organisms the crosstalk between the two signaling pathways. Co-expression analysis between the Wnt/β-catenin Tg(7xTCF-Xla.Siam:GFP)ia4 and the Hippo-Yap/Taz Tg(Hsa.CTGF:nlsmCherry)ia49 zebrafish reporter lines revealed shared spatiotemporal expression profiles. These patterns were particularly evident in key developmental regions such as the midbrain-hindbrain boundary (MHB), epidermis, muscles, neural tube, notochord, floorplate, and otic vesicle. To investigate the relationship between the Wnt/β-catenin pathway and Hippo-Yap/Taz signaling in vivo, we conducted a series of experiments employing both pharmacological and genetic strategies. Modulation of the Wnt/β-catenin pathway with IWR-1, XAV939, or BIO resulted in a significant regulation of the Yap/Taz reporter signal, highlighting a clear correlation between β-catenin and Yap/Taz activities. Furthermore, genetic perturbation of the Wnt/β-catenin pathway, by APC inhibition or DKK1 upregulation, elicited evident and robust alteration of Yap/Taz activity. These findings revealed the intricate regulatory mechanisms underlying the crosstalk between the Wnt/β-catenin and Hippo-Yap/Taz signaling, shedding light on their roles in orchestrating developmental processes in vivo.

Keywords: Hippo; Wnt/β-catenin; Yap/Taz; crosstalk; embryonic development; zebrafish.


Conflict of interest statement

The authors declare no conflicts of interest.

Figures

Figure 1
Figure 1
(A,B) Transgene co-expression pattern of Tg(7xTCF-Xla.Siam:GFP)ia4 and Tg(Hsa.CTGF:nlsmCherry)ia49 reporter lines in 48 hpf embryos. (A). Representative Tg(7xTCF-Xla.Siam:GFP)ia4, Tg(Hsa.CTGF:nlsmCherry)ia49, and merged images showing Wnt (green) and Yap/Taz (magenta) responsive areas. Regions selected by white dashed squares have been zoomed in (B). (B) Magnification of head, trunk, muscles and caudal region views of the maximal projection from three stacks. Abbreviation: mhb (midbrain–hindbrain boundary), ov (otic vesicle), nt (neural tube), n (notochord), fp (floorplate), m (muscle), e (eye). Mander’s overlap coefficient (MOC), Scale bar in (A) = 200 µm; Scale bar in (B) = 25 µm.
Figure 2
Figure 2
IWR-1 and XAV939-mediated β-catenin pathway inhibition reduces Tg(Hsa.CTGF:nlsmCherry)ia49 reporter signal. (A,B) Tg(Hsa.CTGF:nlsmCherry)ia49 embryos were exposed to IWR-1 or XAV939 for 24 h, and the fluorescent reporter expression was documented (A) and quantified at the level of the whole embryo (B) at 48 hpf. mCherry fluorescence levels (B) were analyzed by measuring the integrated density with FIJI software Control IWR (n = 27), IWR treated embryos (n = 28); Control XAW (n = 31), XAW treated embryos (n = 34). (C) Relative expression of ccn2a and ccn2b genes in zebrafish embryos after treatment with XAV939 from 24 to 48 hpf. mRNA levels were normalized to the DMSO-treated controls (dashed line). Scale bar 250 μm Data are presented as mean +/− SEM (Mann−Whitney test (B), Student t-test (C); * p < 0.05, ** p < 0.01, *** p < 0.001, **** p < 0.0001).
Figure 3
Figure 3
Wnt/β-catenin pathway inhibition through Dkk1 overexpression reduces Tg(Hsa.CTGF:nlsmCherry)ia49 transgene expression. (A) Tg(Hsa.CTGF:nlsmCherry)ia49 fish were outcrossed with the Tg(hsp70:dkk1-GFP)w32 line, and the offspring was heat shocked to induce the overexpression of the Wnt antagonist Dkk1 (Dkk1 OE). Representative images of a double transgenic embryo (Dkk1 OE) at 72 hpf after Dkk1 overexpression compared to WT control siblings (control). (B) mCherry quantification on the entire embryo showed only a modest but significant decrease of fluorescence intensity in Tg(hsp70:dkk1-GFP)w32 larvae after Dkk1 activation; Control (n = 84), Dkk OE (n = 87). (C) In-situ hybridization performed with an antisense probe against mCherry transcript revealed a significant reduction of mCherry mRNA levels after Dkk1 overexpression, compared to the control siblings. The decrease in mCherry mRNA levels is evident in the brain (b), eyes (e), otic vesicle (ov), heart (h), and pharyngeal arches (ph). (D,E) The variation in the in situ hybridization signal intensity was quantified using two independent systems. In (D), the analysis was performed by manually categorizing the embryos of the control and experimental samples (Dkk1 OE) into distinct groups based on the observed signal strength (strong, medium, and weak) at the whole embryo level. In (E), the mCherry signals in each sample (head region) were quantified using the Volocity 6.0 software. Control (n = 321), Dkk OE (n = 288). Scale bar 500 μm. In (B,E), data are presented as mean +/− SEM (Mann−Whitney test); * p < 0.05, *** p < 0.001).
Figure 4
Figure 4
Pharmacological inhibition of β-catenin kinase GSK3 increases Tg(Hsa.CTGF:nlsmCherry)ia49 reporter signal. (A) Tg(Hsa.CTGF:nlsmCherry)ia49 embryos were exposed to BIO from 24 to 48 hpf, and after fixation, the mCherry transgene expression was assessed by in situ hybridization. (B,C) The embryos treated with BIO showed higher levels of mRNA mCherry transgene expression compared to their untreated control siblings. In the in situ hybridization experiments, the signal intensity variation was assessed using two different methods. In (B), the analysis was performed by grouping the embryos into three distinct classes based on the observed signal strength at the whole embryo level. In (C), the mCherry signals were quantified by measuring the pixel intensity in the head region, using Volocity 6.0 software. Control (n = 52), BIO (n = 51). (D) In 48 hpf zebrafish embryos, the expression of ccn2a and ccn2b genes was strongly up-regulated after treatment with BIO for 24 h. mRNA levels were normalized to the DMSO-treated controls (dashed line). Scale bar: 250 μm. In (C,D), data are presented as mean +/− SEM (Mann−Whitney test in (C) and Student t-test in (D); * p < 0.05, ** p < 0.01, *** p < 0.001, **** p < 0.0001).
Figure 5
Figure 5
Tg(Hsa.CTGF:nlsmCherry)ia49 reporter activity is increased in apc mutant background at 72 hpf. (A) apchu745 mutants fail to develop the cartilage structure, as evidenced by the alcian blue staining. (B) The reporter signal, labeling the pharyngeal arches (ph), disappears in apchu745 mutant background due to the lack of these structures, as shown by the in situ hybridization against mCherry mRNA as well. (C) In situ hybridization for mCherry displaying the general upregulation of Yap/Taz reporter activity in apchu745 mutant background. The increase in mCherry mRNA levels is evident in the brain (b), eyes (e), otic vesicle (ov), heart (h), and vascular system (vs) along the yolk extension. (D,E) Quantification of the in-situ hybridization experiments was performed (D) by grouping the embryos into three distinct classes according to the observed signal strength at the whole-embryo level, or (E) by measuring the pixel intensity in the head region of each sample using Volocity 6.0 software. Control (n = 48), APC−/− (n = 39). In (E), data are presented as mean +/− SEM (Mann−Whitney test). Scale bar: 500 μm; *** p < 0.001.

Similar articles

Cited by

References

    1. MacDonald B.T., Tamai K., He X. Wnt/beta-catenin signaling: Components, mechanisms, and diseases. Dev. Cell. 2009;17:9–26. - PMC - PubMed
    1. Pan D. The hippo signaling pathway in development and cancer. Dev. Cell. 2010;19:491–505. - PMC - PubMed
    1. Mo J.S., Park H.W., Guan K.L. The Hippo signaling pathway in stem cell biology and cancer. EMBO Rep. 2014;15:642–656. - PMC - PubMed
    1. Santinon G., Pocaterra A., Dupont S. Control of YAP/TAZ Activity by Metabolic and Nutrient-Sensing Pathways. Trends Cell Biol. 2016;26:289–299. - PubMed
    1. Piccolo S., Dupont S., Cordenonsi M. The biology of YAP/TAZ: Hippo signaling and beyond. Physiol. Rev. 2014;94:1287–1312. - PubMed

MeSH terms

Substances

LinkOut - more resources