. 2024 Sep 19;25(18):10063.
doi: 10.3390/ijms251810063.

Mechanism Actions of Coniferyl Alcohol in Improving Cardiac Dysfunction in Renovascular Hypertension Studied by Experimental Verification and Network Pharmacology

Affiliations

Mechanism Actions of Coniferyl Alcohol in Improving Cardiac Dysfunction in Renovascular Hypertension Studied by Experimental Verification and Network Pharmacology

Qiuling Wu et al. Int J Mol Sci. .

Abstract

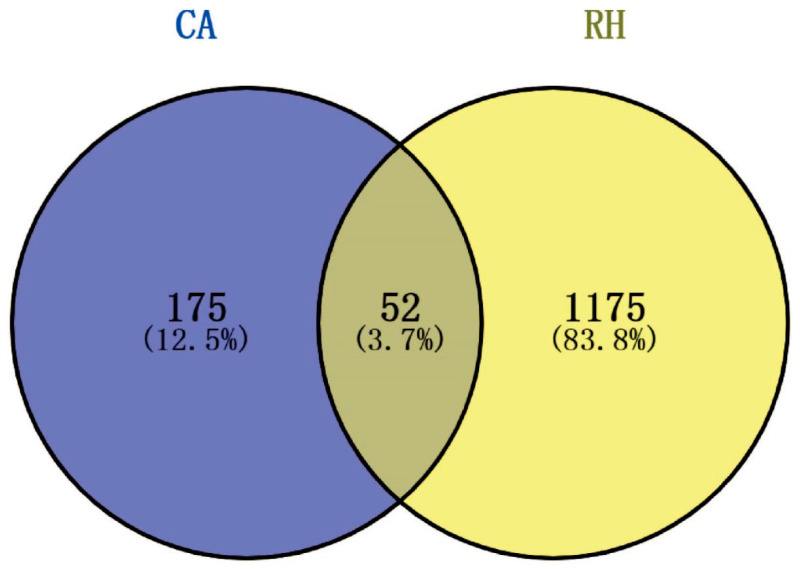
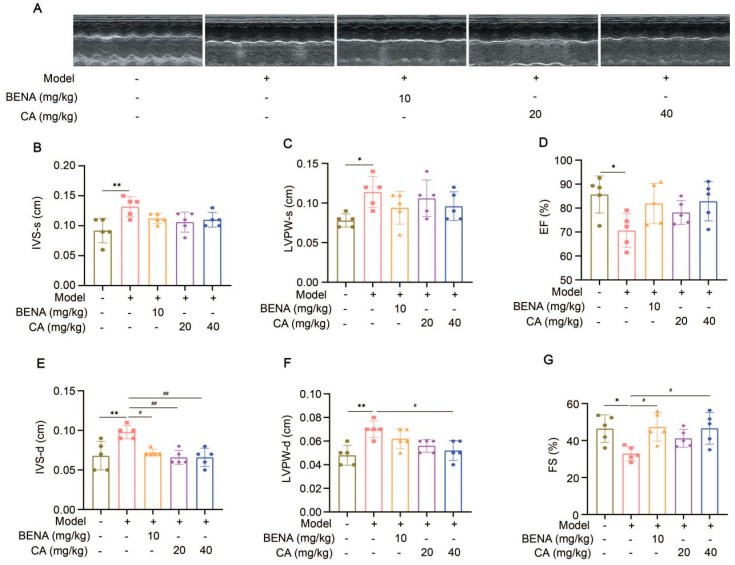
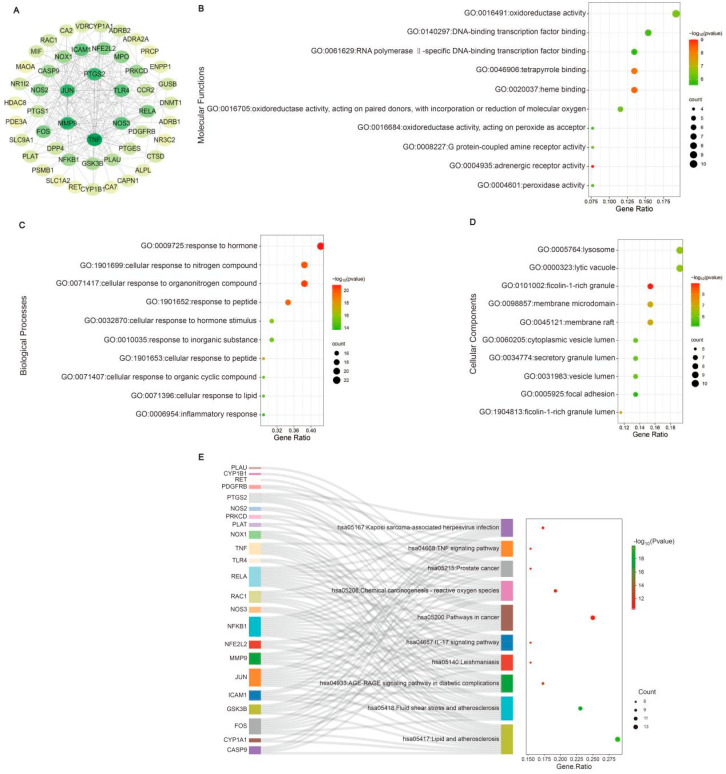
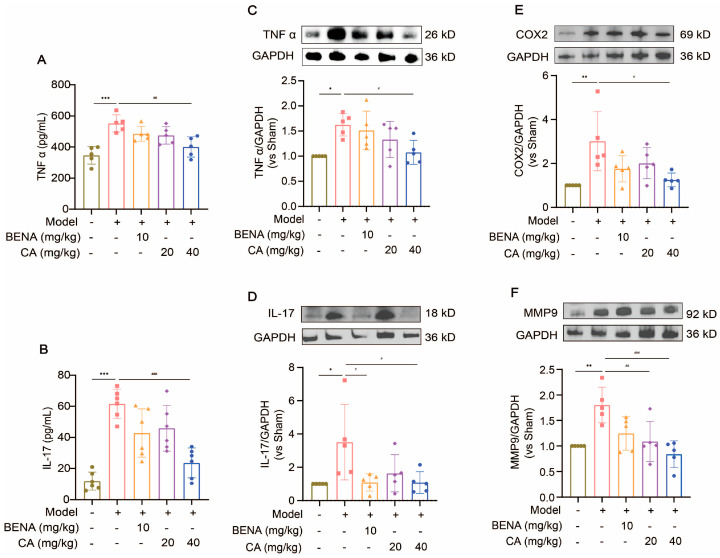
Renovascular hypertension (RH), a secondary hypertension, can significantly impact heart health, resulting in heart damage and dysfunction, thereby elevating the risk of cardiovascular diseases. Coniferol (CA), which has vascular relaxation properties, is expected to be able to treat hypertension-related diseases. However, its potential effects on cardiac function after RH remain unclear. In this study, in combination with network pharmacology, the antihypertensive and cardioprotective effects of CA in a two-kidney, one-clip (2K1C) mice model and its ability to mitigate angiotensin II (Ang II)-induced hypertrophy in H9C2 cells were investigated. The findings revealed that CA effectively reduced blood pressure, myocardial tissue damage, and inflammation after RH. The possible targets of CA for RH treatment were screened by network pharmacology. The interleukin-17 (IL-17) and tumor necrosis factor (TNF) signaling pathways were identified using a Kyoto Encyclopedia of Genes and Genomes (KEGG) enrichment analysis. The inflammatory response was identified using a Gene Ontology (GO) enrichment analysis. Western blot analysis confirmed that CA reduced the expression of IL-17, matrix metallopeptidase 9 (MMP9), cyclooxygenase 2 (COX2), and TNF α in heart tissues and the H9C2 cells. In summary, CA inhibited cardiac inflammation and fibrohypertrophy following RH. This effect was closely linked to the expression of MMP9/COX2/TNF α/IL-17. This study sheds light on the therapeutic potential of CA for treating RH-induced myocardial hypertrophy and provides insights into its underlying mechanisms, positioning CA as a promising candidate for future drug development.

Keywords: MMP9/COX2/TNF α/IL-17; coniferyl alcohol; inflammatory response; myocardial hypertrophy; network pharmacology; renovascular hypertension.


Conflict of interest statement

The authors declare that they have no known competing financial interests or personal relationships.

Figures

Figure 1
Figure 1
Venn diagram of intersection targets of CA and RH. Blue represents the targets of CA and yellow represents the targets of RH. There were 52 intersecting targets.
Figure 2
Figure 2
Effects of CA on cardiovascular parameters in RH mice. Systolic (A) and diastolic (B) blood pressures were monitored before surgery, four weeks after surgery, and three weeks after administration (n = 10). After fasting for 12 h, the body weight of each mice was measured (C), and their hearts were weighed to obtain the HW/BW ratio (D) (n = 5). In the quantitative chart, green circles represent sham group, pink squares represent model group, orange triangles represent 10 mg/kg BENA group, purple rhombuses represent 20 mg/kg CA group, and blue hexagons represent 40 mg/kg CA group. The values are mean ± SD. * p < 0.05, and *** p < 0.001 vs. sham; # p < 0.05, and ### p < 0.001 vs. model. ns = p > 0.05.
Figure 3
Figure 3
Effects of CA on echocardiographic indexes in RH mice. Representations of echocardiographic images are shown (A). From left to right, they are the sham group, model group, 10 mg/kg BENA group, and 20 mg/kg and 40 mg/kg CA groups, respectively. Statistics for IVS-s (B), LVPW-s (C), EF (D), IVS-d (E), LVPW-d (F), and FS (G). In the quantitative chart, green circles represent sham group, pink squares represent model group, orange triangles represent 10 mg/kg BENA group, purple rhombuses represent 20 mg/kg CA group, and blue hexagons represent 40 mg/kg CA group. The values are mean ± SD, n = 5. * p < 0.05, and ** p < 0.01 vs. sham; # p < 0.05, and ## p < 0.01 vs. model.
Figure 4
Figure 4
Effect of CA on cardiac histological changes in RH mice. H&E staining was used to observe the pathological changes in heart tissues in the sham group, model group, 10 mg/kg BENA group, and 20 mg/kg and 40 mg/kg CA groups. Representative images of hearts (A) are shown. The statistics of cardiac pathology scores (B) are also displayed. The scale bar represents 50 µm. In the quantitative chart, green circles represent sham group, pink squares represent model group, orange triangles represent 10 mg/kg BENA group, purple rhombuses represent 20 mg/kg CA group, and blue hexagons represent 40 mg/kg CA group. The values are mean ± SD, n = 5. *** p < 0.001 vs. sham; # p < 0.05, and ## p < 0.01 vs. model.
Figure 5
Figure 5
Network pharmacology analysis of CA in alleviating cardiac hypertrophy in mice with RH. A PPI network was established. The innermost nodes represent the CA–RH intersection targets with a degree of >20 (A). The top ten GO enrichment items of CA anti-RH core targets are reflected in MFs (B), BPs (C), and CCs (D). The top ten KEGG enrichment terms of core targets for CA against RH (E) are also shown.
Figure 6
Figure 6
Molecular docking of CA with the core targets. Molecular docking of CA with the top six intersection targets. CA interacts with MMP9 via GLU-402, MET-422, and ARG-424 (A). CA interacts with COX2 via ALA-199, and ASN-382 (B). CA interacts with TNF α via GLU-94, GLU-95, and LEU-97 (C). CA interacts with IL-17 via GLU-94, GLU-95, and LEU-97 (D). CA interacts with TLR4 via GLU-225, ARG-227, PRO-202, and LEU-204 (E). CA interacts with NOS3 via GLU-272, ARG-255, and GLY-282 (F). CA and JUN have no interaction (G).
Figure 7
Figure 7
CA inhibited the expressions of TNF and IL-17 signaling pathway proteins. The serum levels of TNF α (A) and IL-17 (B) were measured using commercially available ELLSA kits after the administration of 10 mg/kg of BENA, 20 mg/kg of CA, and 40 mg/kg of CA, respectively, to the RH mice. The expressions of TNF α (C), IL-17 (D), COX2 (E), and MMP9 (F) were detected by Western blot analysis after the administration of 10 mg/kg of BENA, 20 mg/kg of CA, and 40 mg/kg of CA, respectively, to the RH mice. The quantification of normalized TNF α, IL-17, COX2, and MMP9 was performed. In the quantitative chart, green circles represent sham group, pink squares represent model group, orange triangles represent 10 mg/kg BENA group, purple rhombuses represent 20 mg/kg CA group, and blue hexagons represent 40 mg/kg CA group. The values are mean ± SD, n = 5. * p < 0.05, ** p < 0.01, and *** p < 0.001 vs. sham; # p < 0.05, ## p < 0.01, and ### p < 0.001 vs. model.
Figure 8
Figure 8
Effect of CA on the viability of H9C2 cells induced Ang II. The cell viability of the H9C2 cells treated with Ang II (0.04, 0.2, 1, 5, and 25 μM) (A) and CA (0.5, 5, and 50 μM) (B) was analyzed by CCK8. The H9C2 cells were treated with CA (0.5, 5, and 50 μM) in the presence of 5 μM Ang II (C). The cell viability of the 5 μM Ang II-induced H9C2 cells treated with CA (0.5, 5, and 50 μM) was detected by CCK8 assay. In quantitative (A), gray circles represent control, green squares represent 0.04 μM Ang II, pink upright triangles represent 0.02 μM Ang II, orange inverted triangles represent 1 μM Ang II, purple rhombuses represent 5 μM Ang II, and blue hexagons represent 25 μM Ang II. In quantitative (B), green circles represent control, orange triangles represent 0.5 μM CA, purple rhombuses represent 5 μM CA, and blue hexagons represent 50 μM CA. In quantitative (C), green circles represent control, pink squares represent 5 μM Ang II, orange triangles represent 5 μM Ang II + 0.5 μM CA, purple rhombuses represent 5 μM Ang II + 5 μM CA, and blue hexagons represent 5 μM Ang II + 50 μM CA. The values are mean ± SD, n = 5. *** p < 0.001 vs. control; ## p < 0.01 vs. 5 μM Ang II.
Figure 9
Figure 9
The inhibitory effect of CA on Ang II-stimulated hypertrophy of H9C2 cells. H9C2 cells were exposed to different concentrations of CA (0.5, 5, and 50 μM) under the stimulation of 5 μM Ang II. The expressions of α-SMA (A), TNF α (B), IL-17 (C), COX2 (D), and MMP9 (E) were detected by Western blot analysis. The quantification of normalized α-SMA, TNF α, IL-17, COX2, and MMP9 was performed. In the quantitative chart, green circles represent control, pink squares represent 5 μM Ang II, orange triangles represent 5 μM Ang II + 0.5 μM CA, purple rhombuses represent 5 μM Ang II + 5 μM CA, and blue hexagons represent 5 μM Ang II + 50 μM CA The values are mean ± SD, n = 5. * p < 0.05 vs. control; # p < 0.05, and ### p < 0.001 vs. 5 μM Ang II.
Figure 10
Figure 10
H&E staining of brain, liver, lungs, and spleen after CA treatment. Pathological changes in brain, liver, lungs, and spleen tissues from the sham group, model group, and 20 mg/kg and 40 mg/kg CA groups were evaluated by H&E staining. Representative images of the brain (A), liver (B), lungs (C), and spleen (D) are shown. The scale bar represents 50 µm.

Similar articles

References

    1. Murray C.J.L., Aravkin A.Y., Zheng P., Abbafati C., Abbas K.M., Abbasi-Kangevari M. Global burden of 87 risk factors in 204 countries and territories, 1990–2019: A systematic analysis for the Global Burden of Disease Study 2019. Lancet. 2020;396:1223–1249. doi: 10.1016/S0140-6736(20)30752-2. - DOI - PMC - PubMed
    1. Mills K.T., Stefanescu A., He J. The global epidemiology of hypertension. Nat. Rev. Nephrol. 2020;16:223–237. doi: 10.1038/s41581-019-0244-2. - DOI - PMC - PubMed
    1. Poasakate A., Maneesai P., Potue P., Bunbupha S., Tong-Un T., Settheetham-Ishida W., Khamseekaew J., Pakdeechote P. Genistein alleviates renin-angiotensin system mediated vascular and kidney alterations in renovascular hypertensive rats. Biomed. Pharmacother. 2022;146:112601. doi: 10.1016/j.biopha.2021.112601. - DOI - PubMed
    1. Rizzoni D., Muiesan M.L., Porteri E., Salvetti M., Castellano M., Bettoni G., Tiberio G., Giulini S.M., Monteduro C., Garavelli G., et al. Relations between cardiac and vascular structure in patients with primary and secondary hypertension. J. Am. Coll. Cardiol. 1998;32:985–992. doi: 10.1016/S0735-1097(98)00322-2. - DOI - PubMed
    1. Nogales C., Mamdouh Z.M., List M., Kiel C., Casas A.I., Schmidt H.H. Network pharmacology: Curing causal mechanisms instead of treating symptoms. Trends Pharmacol. Sci. 2022;43:136–150. doi: 10.1016/j.tips.2021.11.004. - DOI - PubMed

MeSH terms

LinkOut - more resources