. 2024 Sep 20;25(18):10100.
doi: 10.3390/ijms251810100.

Cellular and Molecular Network Characteristics of TARM1-Related Genes in Mycobacterium tuberculosis Infections

Affiliations

Cellular and Molecular Network Characteristics of TARM1-Related Genes in Mycobacterium tuberculosis Infections

Li Peng et al. Int J Mol Sci. .

Abstract

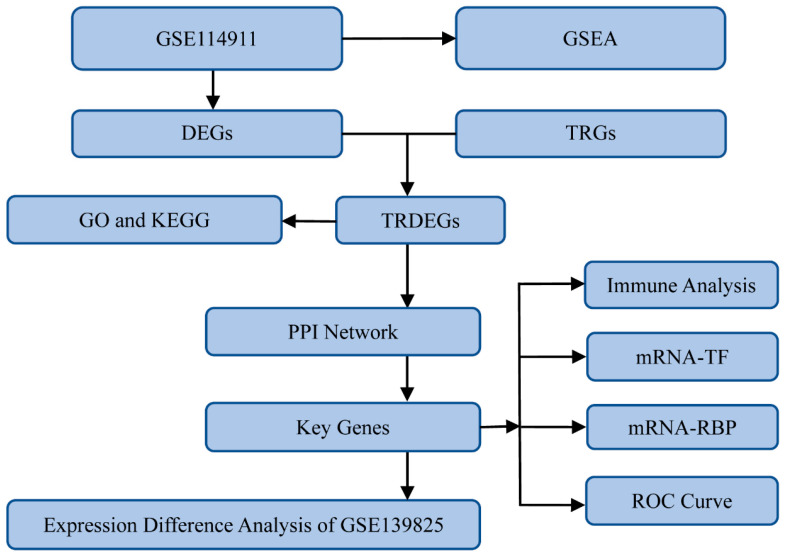
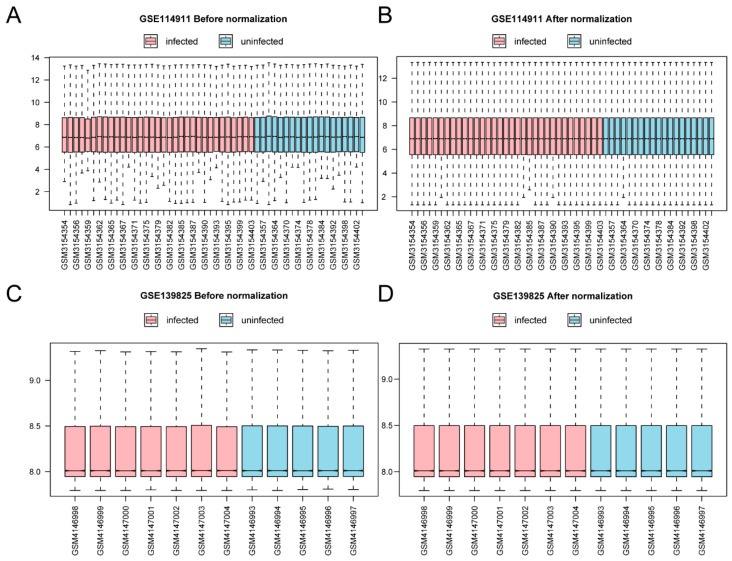
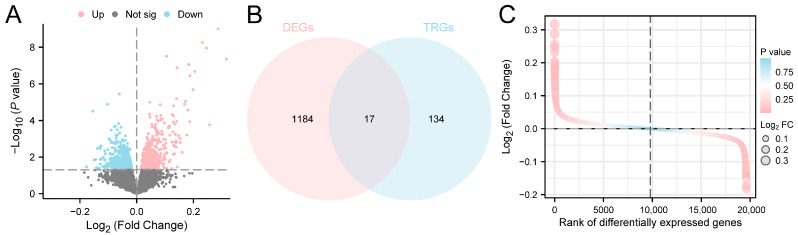
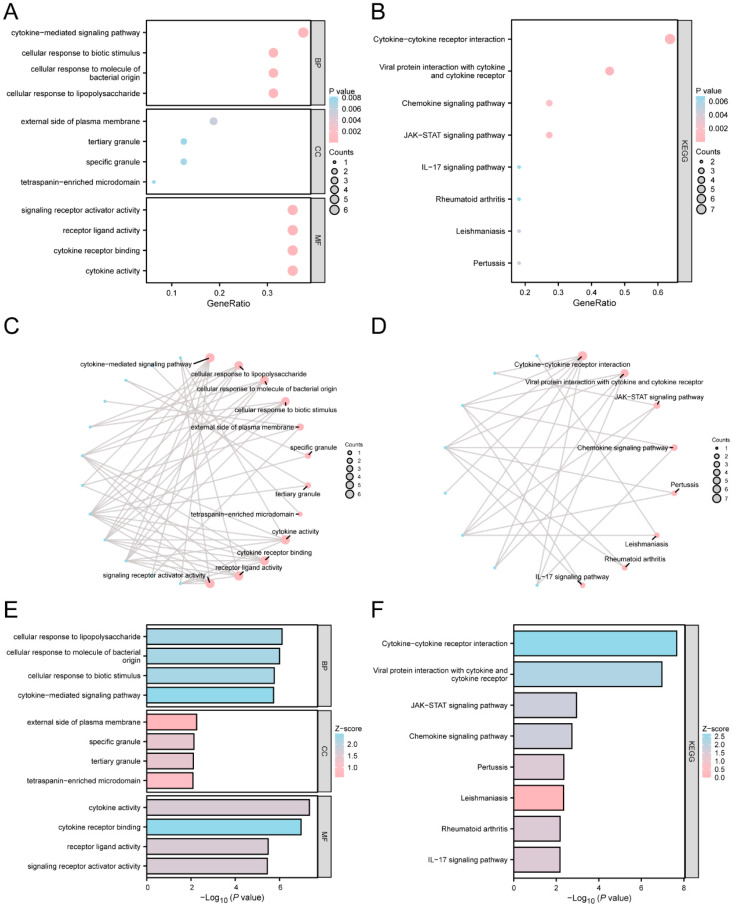
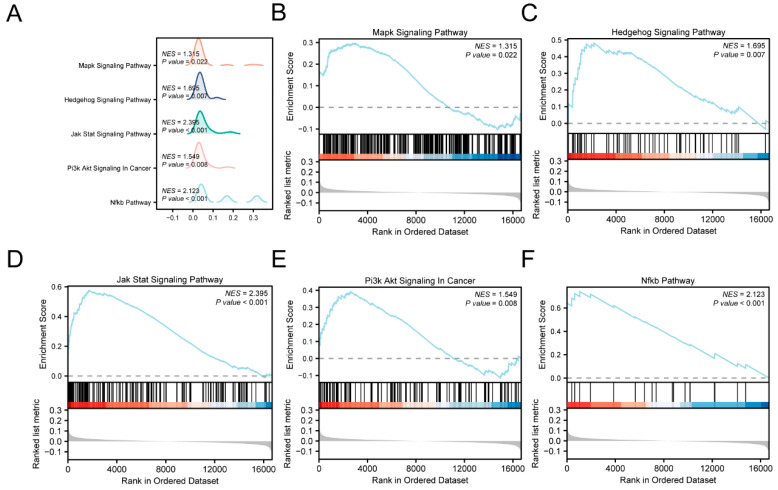
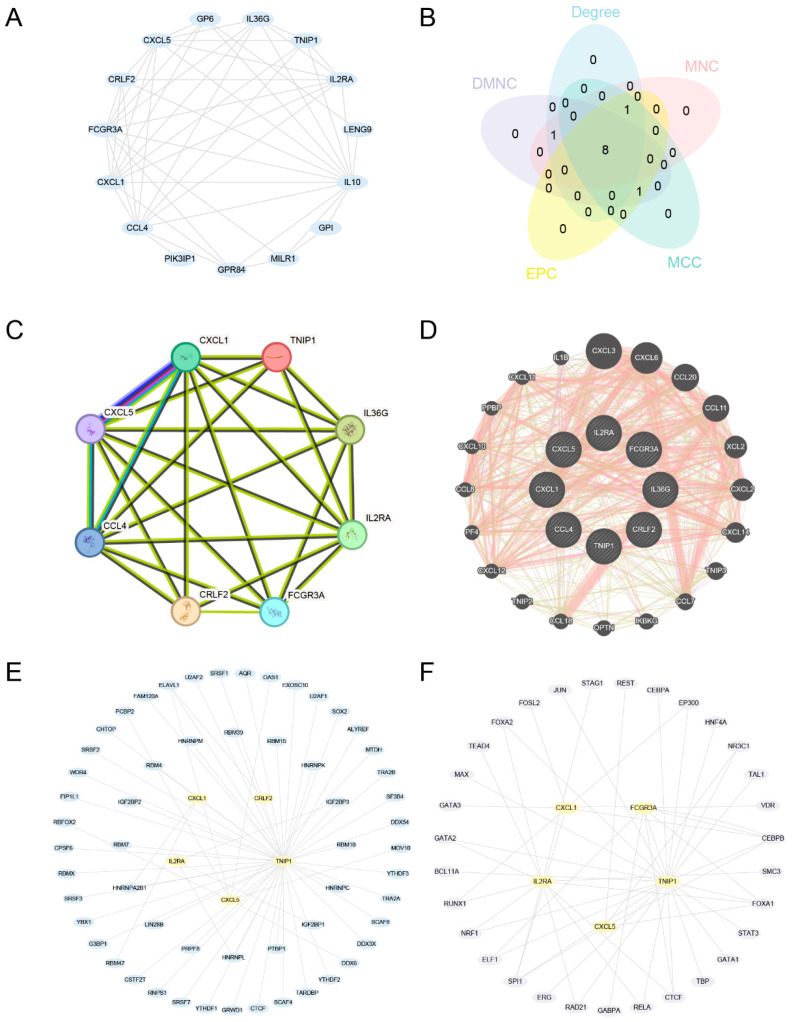
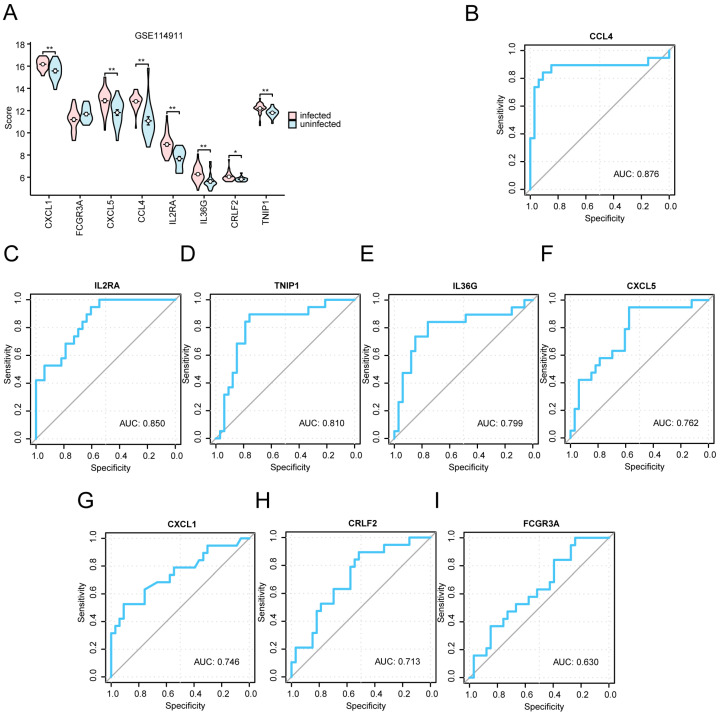
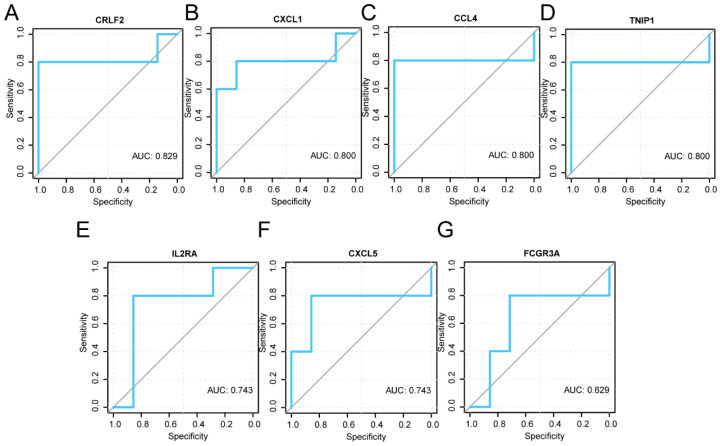
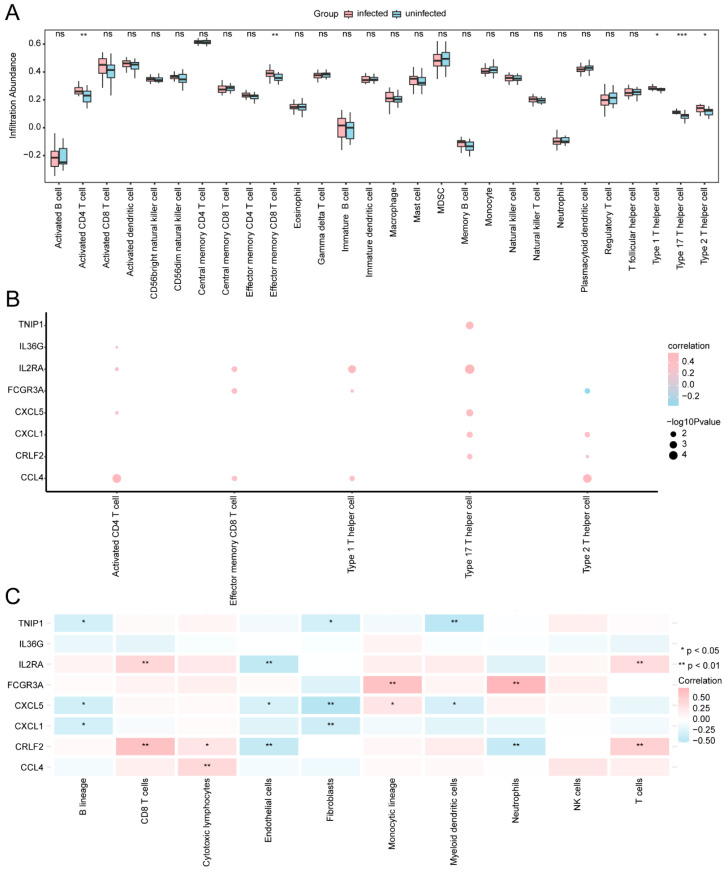
Tuberculosis (TB) is a global infectious threat, and the emergence of multidrug-resistant TB has become a major challenge in eradicating the disease that requires the discovery of new treatment strategies. This study aimed to elucidate the immune infiltration and molecular regulatory network of T cell-interacting activating receptors on myeloid cell 1 (TARM1)-related genes based on a bioinformatics analysis. The GSE114911 dataset was obtained from the Gene Expression Omnibus (GEO) and screened to identify 17 TARM1-related differentially expressed genes (TRDEGs). Genes interacting with the TRDEGs were analyzed using a Gene Ontology (GO) and Kyoto Encyclopedia of Genes and Genomes (KEGG) enrichment analysis. A gene set enrichment analysis (GSEA) was used to identify the biological pathways significantly associated with a Mycobacterium tuberculosis (Mtb) infection. The key genes were obtained based on Cytoscape's cytoHubba plug-in. Furthermore, protein-protein interaction (PPI) networks were analyzed through STRING, while mRNA-RNA-binding protein (RBP) and mRNA-transcription factor (TF) interaction networks were developed utilizing the StarBase v3.0 and ChIPBase databases. In addition, the diagnostic significance of key genes was evaluated via receiver operating characteristic (ROC) curves, and the immune infiltration was analyzed using an ssGSEA and MCPCounter. The key genes identified in the GSE114911 dataset were confirmed in an independent GSE139825 dataset. A total of seventeen TRDEGs and eight key genes were obtained in a differential expression analysis using the cytoHubba plug-in. Through the GO and KEGG analysis, it was found that these were involved in the NF-κB, PI3K/Akt, MAPK, and other pathways related to inflammation and energy metabolism. Furthermore, the ssGSEA and MCPCounter analysis revealed a significant rise in activated T cells and T helper cells within the Mtb infection group, which were markedly associated with these key genes. This implies their potential significance in the anti-Mtb response. In summary, our results show that TRDEGs are linked to inflammation, energy metabolism, and immune cells, offering fresh insights into the mechanisms underlying TB pathogenesis and supporting further investigation into the possible molecular roles of TARM1 in TB, as well as assisting in the identification of prospective diagnostic biomarkers.

Keywords: Mycobacterium tuberculosis; TARM1; bioinformatics; biomarker; tuberculosis.


Conflict of interest statement

The authors declare no conflicts of interest.

Figures

Figure 1
Figure 1
Flow chart of the study. GSEA: gene set enrichment analysis. DEGs: differentially expressed genes. TRGs: TARM1-related genes. TRDEGs: TARM1-related differentially expressed genes. GO: Gene Ontology. KEGG: Kyoto Encyclopedia of Genes and Genomes. PPI Network: protein–protein interaction network. ROC: receiver operating characteristic. RBP: RNA-binding protein. TF: transcription factor.
Figure 2
Figure 2
Datasets for batch processing. (A) Box plot of gene expression distribution between GSE114911 samples before correction. (B) Box plot of distribution of gene expression among corrected GSE114911 samples. (C) Box plot of gene expression distribution among GSE139825 samples before correction. (D) Box plot of gene expression distribution among corrected GSE139825 samples. Mtb-infected samples (infected) in red and uninfected samples (uninfected) in blue in the datasets.
Figure 3
Figure 3
The differential gene expression analysis. (A) A volcano plot of the DEG analysis between infected and uninfected groups in the GSE114911 dataset. (B) A Venn diagram of the DEGs and TRGs in the GSE114911 dataset. (C) A difference sequence diagram of the TRDEGs in the GSE114911 dataset. The size of the bubbles indicates the number of genes, while the color of the bubbles reflects the size of the p-value. A redder hue corresponds to a smaller p-value, whereas a bluer hue indicates a larger p-value.
Figure 4
Figure 4
The enrichment analysis of GO and KEGG for TRDEGs. (A) A bubble plot of the GO enrichment analysis results for TRDEGs: BPs, MFs, and CCs. (B) The bubble plot represents the KEGG enrichment analysis findings for TRDEGs. The bubble size correlates with the number of genes, while the color indicates the magnitude of the adjusted p-value—darker red signifies smaller adjusted p-values, whereas darker blue indicates larger adjusted p-values. (C,D) The network diagram shows the findings of the GO and KEGG enrichment analyses for TRDGEs. The red nodes represent items and the blue nodes represent molecules, with attachment on behalf of the entry and molecular relationship. (E,F) Bar graphs of the TRDEGs’ GO and KEGG enrichment analysis findings. The GO and KEGG selection criteria were a p-value < 0.05 and an FDR value (q-value) < 0.05.
Figure 5
Figure 5
The GSEA for the combined datasets. (A) A ridge plot of the GSEA of the GSE114911 dataset. (BF) The GSEA indicated a significant enrichment of the TRDEGs in several pathways: MAPK (B), Hedgehog (C), JAK-STAT (D), PI3k/Akt (E), and NF-κB (F). The screening criteria of the GSEA were a p-value < 0.05 and an FDR value (q-value) < 0.25.
Figure 6
Figure 6
PPI, mRNA-RBP, and mRNA-TF interaction networks. (A) Network of TRDEGs based on PPIs. (B) Venn diagram illustrating the eight principal genes identified using MCC, MNC, EPC, Degree, and DMNC algorithms. (C) PPI network of the eight key genes. (D) Interaction network between the eight key genes and functionally similar genes. (E) Key genes–RBP interaction network. (F) Key genes–TF interaction network. Yellow ovals denote mRNA, blue ovals denote RBPs, and purple ovals denote TFs, respectively.
Figure 7
Figure 7
The expression difference analysis and ROC curves for key genes in the GSE114911 dataset between the infected and uninfected groups. (A) A comparative analysis of key genes in the datasets for infected versus uninfected groups. (BI) ROC curve evaluations of the key genes CCL4 (B), IL2RA (C), TNIP1 (D), IL36G (E), CXCL5 (F), CXCL1 (G), CRLF2 (H), and FCGR3A (I) in the GSE114911 dataset. ** denotes p < 0.01, indicating a high statistical significance; and * represents p < 0.05 and denotes statistical significance. The ROC curve in the AUC is close to 1, in order to better diagnose the results. The AUC indicated a certain accuracy when it fell in the range of 0.7–0.9. AUC values of 0.5~0.7 indicated a low accuracy. The infected group is represented in red, while the uninfected group is shown in blue.
Figure 8
Figure 8
The ROC curves for key genes within the GSE139825 dataset between the infected and uninfected groups. (AG) ROC curves for the key genes CRLF2 (A), CXCL1 (B), CCL4 (C), TNIP1 (D), IL2RA (E), CXCL5 (F), and FCGR3A (G) in the GSE139825 dataset. AUC values of 0.7~0.9 demonstrated a certain accuracy. AUC values between 0.5 and 0.7 had a low accuracy.
Figure 9
Figure 9
An analysis of immune infiltration (using an ssGSEA and MCPCounter). (A) A comparative diagram illustrating 28 immune cell types under the ssGSEA algorithm across different groups (infected/uninfected) within the GSE114911 dataset. (B) A heat map showing the correlation analysis results between key genes and the infiltration abundance of immune cells (p < 0.05), calculated by the ssGSEA algorithm. (C) The heat map display of the correlation analysis results between the key genes and the immune cell infiltration abundance was calculated by the MCPCounter algorithm. In the correlation heat map, the red circles represent a positive correlation between the genes and immune cell infiltration abundance, with a larger circle signifying a stronger correlation. The larger the circle, the stronger the correlation. The blue circles indicate a negative correlation between the genes and immune cell infiltration abundance, with larger circles reflecting a stronger correlation. ns denotes p > 0.05, indicating a lack of statistical significance. *** represents p < 0.001, signifying a very high level of statistical significance; ** denotes p < 0.01, indicating high statistical significance; and * represents p < 0.05 and denotes statistical significance.

Similar articles

References

    1. Rajabalee N., Siushansian H., Weerapura M., Berton S., Berbatovci F., Hooks B., Geoffrion M., Yang D., Harper M.-E., Rayner K., et al. ATF2 orchestrates macrophage differentiation and activation to promote antibacterial responses. J. Leukoc. Biol. 2023;114:280–298. doi: 10.1093/jleuko/qiad076. - DOI - PubMed
    1. Sutter A., Landis D., Nugent K. Metformin has immunomodulatory effects which support its potential use as adjunctive therapy in tuberculosis. Indian J. Tuberc. 2024;71:89–95. doi: 10.1016/j.ijtb.2023.05.011. - DOI - PubMed
    1. World Health Organization (WHO) Global Tuberculosis Report. World Health Organization; Geneva, Switzerland: 2023. [(accessed on 25 March 2024)]. Available online: https://www.who.int/teams/global-tuberculosis-programme/tb-reports/globa....
    1. Shah N.S., Wright A., Bai G.H., Barrera L., Boulahbal F., Martín-Casabona N., Drobniewski F., Gilpin C., Havelková M., Lepe R., et al. Worldwide emergence of extensively drug-resistant tuberculosis. Emerg. Infect. Dis. 2007;13:380–387. - PMC - PubMed
    1. Gandhi N.R., Moll A., Sturm A.W., Pawinski R., Govender T., Lalloo U., Zeller K., Andrews J., Friedland G. Extensively drug-resistant tuberculosis as a cause of death in patients co-infected with tuberculosis and HIV in a rural area of South Africa. Lancet. 2006;368:1575–1580. doi: 10.1016/S0140-6736(06)69573-1. - DOI - PubMed

LinkOut - more resources