. 2024 Sep 20;25(18):10107.
doi: 10.3390/ijms251810107.

RAMP1 Signaling Mitigates Acute Lung Injury by Distinctively Regulating Alveolar and Monocyte-Derived Macrophages

Affiliations

RAMP1 Signaling Mitigates Acute Lung Injury by Distinctively Regulating Alveolar and Monocyte-Derived Macrophages

Atsushi Yamashita et al. Int J Mol Sci. .

Abstract

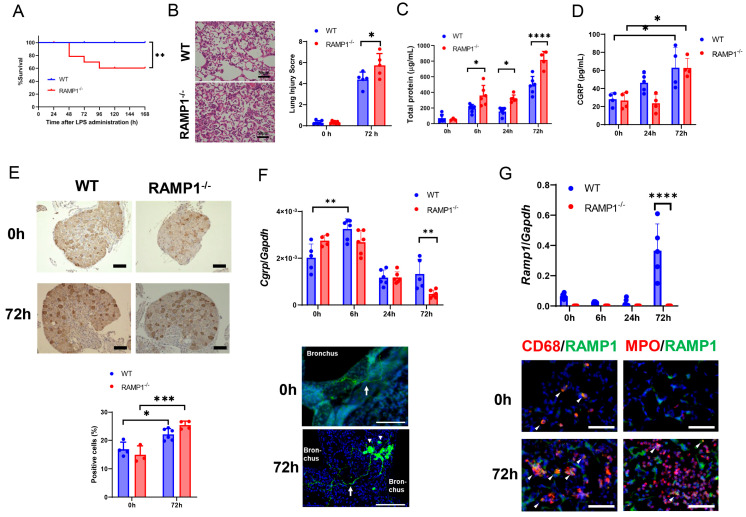
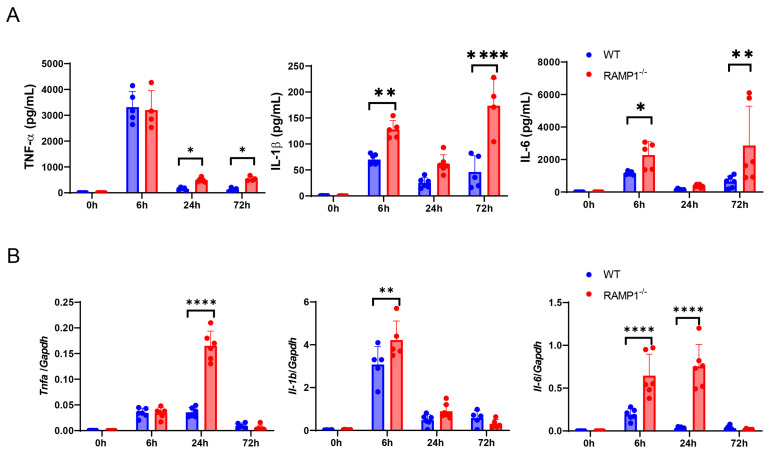
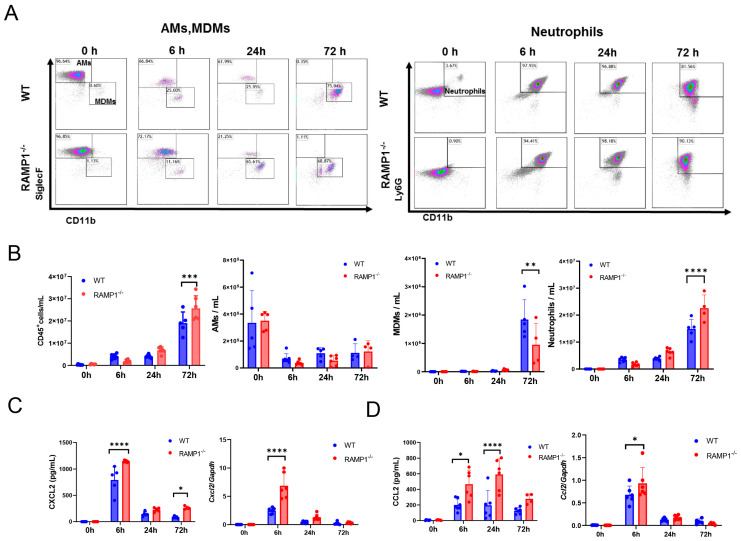
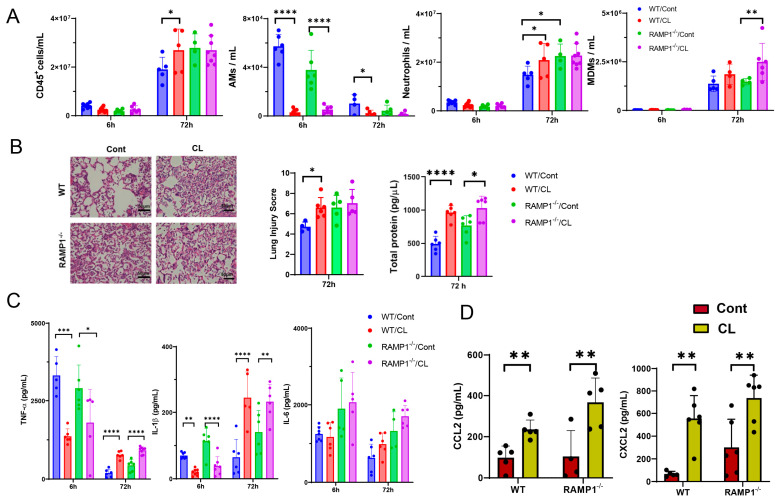
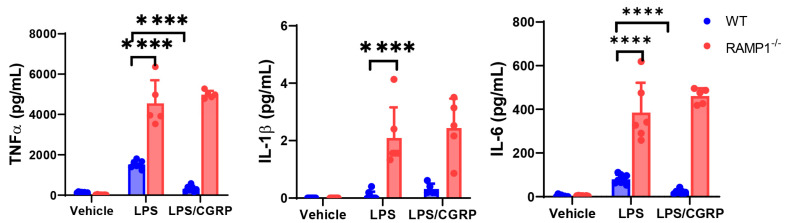
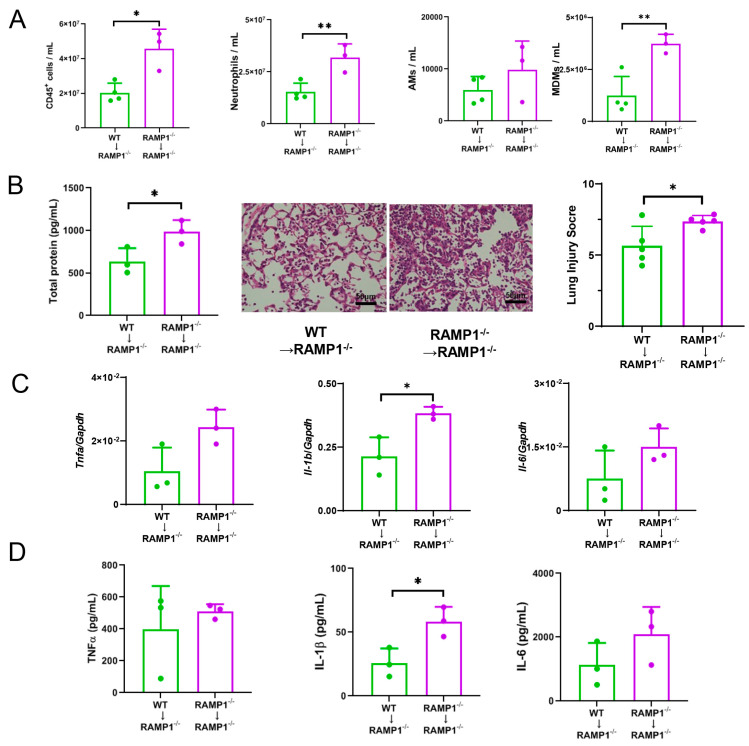
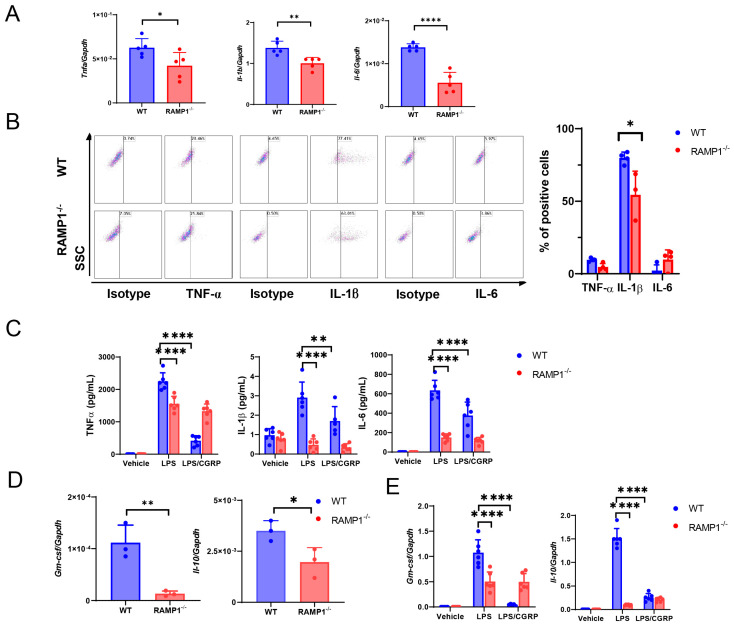
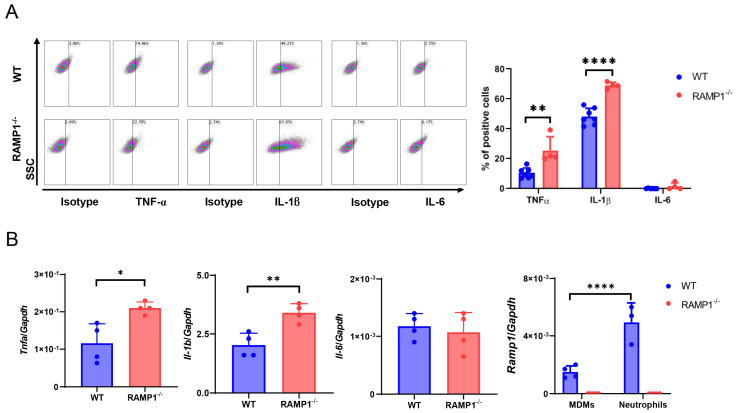
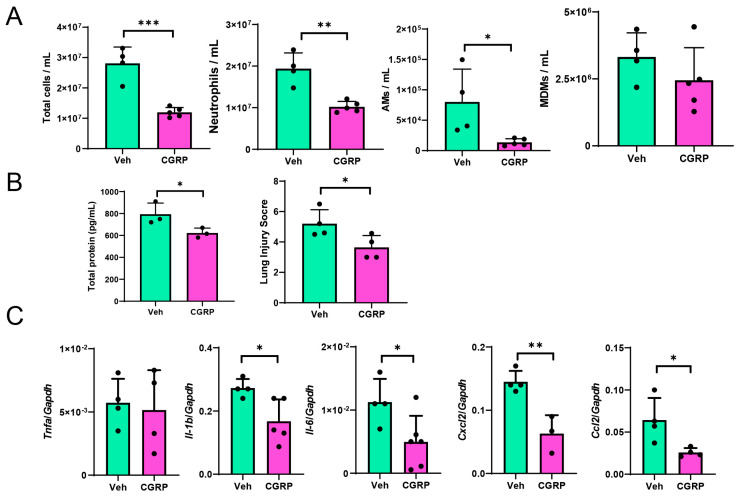
Acute respiratory distress syndrome (ARDS) is a life-threatening lung injury that induces cytokine hypersecretion. Receptor activity-modifying protein (RAMP) 1, a subunit of the calcitonin gene-related peptide (CGRP) receptor, regulates the production of cytokines. This study examined the role of RAMP1 signaling during lipopolysaccharide (LPS)-induced acute lung injury (ALI). LPS administration to wild-type (WT) mice depleted alveolar macrophages (AMs) and recruited monocyte-derived macrophages (MDMs) and neutrophils. RAMP1-deficient (RAMP1-/-) mice exhibited higher lung injury scores, cytokine levels, and cytokine-producing neutrophil infiltration. RAMP1-deficient AMs produced more cytokines in response to LPS than WT AMs. Adoptive transfer of RAMP1-deficient AMs to RAMP1-/- mice increased cytokine levels and neutrophil accumulation compared to the transfer of WT AMs. RAMP1-/- mice had reduced MDM recruitment and lower pro-inflammatory and reparative macrophage profiles. Cultured bone marrow (BM)-derived RAMP1-deficient macrophages stimulated with LPS showed decreased expression of pro-inflammatory and pro-repairing genes. CGRP administration to WT mice reduced cytokine production and neutrophil accumulation. These findings indicate that RAMP1 signaling mitigates LPS-induced ALI by inactivating AMs and promoting inflammatory and repair activities of MDMs. Targeting RAMP1 signaling presents a potential therapeutic approach for the treatment of ARDS.

Keywords: RAMP1; immunity; macrophage; nerve; neutrophil.


Conflict of interest statement

The authors declare no conflicts of interest.

Figures

Figure 1
Figure 1
RAMP1 deficiency aggravates LPS-induced acute lung injury. (A) Survival rates of LPS-treated WT (n = 20) and RAMP1−/− (n = 20) mice. Log-rank (Mantel-Cox) test. ** p < 0.01. (B) Representative photographs of H and E-stained lung sections from WT and RAMP1−/− mice treated with LPS for 72 h. Scale bars: 50 μm. Lung injury score at 0 h and 72 h after LPS administration in WT and RAMP1−/− mice. Lung injury score was assessed based on the presence of intrapulmonary hemorrhage, pulmonary capillary congestion, neutrophil infiltration in lung interstitium, and hyaline membrane formation. For detailed methodology, see Section 4.12 in the Methods. Data are expressed as the mean ± SD. * p < 0.05. (C,D) Concentration of total protein (C) and CGRP (D) in the BALF of WT and RAMP1−/− mice after LPS treatment. Data are expressed as the mean ± SD. * p < 0.05 and **** p < 0.0001. (E) Representative photographs of immunostaining with CGRP in thoracic dorsal root ganglions (DRGs). Scale bars: 100 μm. The percentage of CGRP+ cells in DRGs is shown. Data are expressed as the mean ± SD. * p < 0.05, *** p < 0.001. (F) mRNA levels of Cgrp in lung tissues from WT and RAMP1−/− mice. Data are expressed as the mean ± SD. ** p < 0.01. Representative photographs of immunostaining with CGRP (green) in lung tissue. Arrows indicate CGRP+ nerves. Arrowheads indicate PNECs. Scale bars: 50 μm. (G) mRNA levels of Ramp1 in lung tissues from WT and RAMP1−/− mice. Data are expressed as the mean ± SD. **** p < 0.0001. Immunofluorescence staining for RAMP1 (green) and CD68 (red) or MPO (red) in lung tissues from WT and RAMP1−/− mice at 0 h and 72 h after LPS administration. Arrow heads indicate double-stained cells. Cell nuclei were stained with DAPI (blue). Scale bars: 50 μm.
Figure 2
Figure 2
RAMP1 deficiency enhanced the production of pro-inflammatory cytokines. (A) Concentrations of the pro-inflammatory cytokines TNFα, IL-1β, and IL-6 in WT and RAMP1−/− mice after LPS treatment. Data are expressed as the mean ± SD. * p < 0.05, ** p < 0.01, **** p < 0.0001. (B) mRNA levels of the pro-inflammatory cytokines Tnfa, Il-1b, and Il-6 in WT and RAMP1−/− mice after LPS treatment. Data are expressed as the mean ± SD. ** p < 0.01, **** p < 0.0001.
Figure 3
Figure 3
Changes in inflammatory cells during LPS-induced acute lung injury. (A) Representative dot plots for alveolar macrophages, recruited macrophages, and neutrophils in WT and RAMP1−/− mice after LPS treatment. (B) Changes in the number of CD45+ cells, AMs (Ly6G/SiglecFhigh/CD11blow cells), MDMs (Ly6G/SiglecFlow/CD11bhigh cells), and neutrophils (Ly6G+/CD11b+ cells) in the BALF of WT and RAMP1−/− mice after LPS treatment. Data are expressed as the mean ± SD. ** p < 0.01, *** p < 0.001, **** p < 0.0001. (C) CXCL2 protein and gene expression in WT and RAMP1−/− mice after LPS treatment. Data are expressed as the mean ± SD. **** p < 0.0001. (D) CCL2 protein and gene expression in WT and RAMP1−/− mice after LPS treatment. Data are expressed as the mean ± SD. * p < 0.05, **** p < 0.0001.
Figure 4
Figure 4
Inhibition of AM activity increased inflammatory cell levels, lung injury, and pro-inflammatory factor levels during LPS-induced acute lung injury. (A) Number of CD45+ cells, AMs, MDMs, and neutrophils at 6 h and 72 h after LPS administration in WT and RAMP1−/− mice treated with clodronate liposomes (CL) or control liposomes (Cont). Data are expressed as the mean ± SD. * p < 0.05, ** p < 0.01, **** p < 0.0001. (B) Representative images of H and E-stained lung sections at 72 h in WT and RAMP1−/− mice treated with CL or Cont. Scale bars: 50 μm. Lung injury score and total protein levels in BALF at 72 h after LPS administration in WT and RAMP1−/− mice treated with CL or Cont are shown. Data are expressed as the mean ± SD. * p < 0.05, **** p < 0.0001. (C) Levels of the pro-inflammatory cytokines TNF-α, IL-1β, and IL-6 at 6 h and 72 h in the BALF of WT and RAMP1−/− mice treated with CL or Cont. Data are expressed as the mean ± SD. * p < 0.05, ** p < 0.01, *** p < 0.001, **** p < 0.0001. (D) Levels of the chemokines CXCL2 and CCL2 at 72 h in the BALF of WT and RAMP1−/− mice treated with CL or Cont. Data are expressed as the mean ± SD. ** p < 0.01.
Figure 5
Figure 5
Expression of pro-inflammatory cytokines in cultured AMs from WT and RAMP1−/− mice. Levels of TNF-α, IL-1β, and IL-6 in supernatants of cultured AMs stimulated with LPS in the presence or absence of CGRP. AMs were isolated from BALF samples. Data are expressed as the mean ± SD. **** p < 0.0001.
Figure 6
Figure 6
Effects of adoptive transfer of AMs on LPS-induced acute lung injury. (A) Number of CD45+-cells, neutrophils, AMs, and MDMs after adoptive transfer. AMs isolated from WT and RAMP1−/− mice were transferred to RAMP1−/− mice at 24 h before LPS treatment, and flow cytometry analysis was performed at 72 h after LPS treatment. Data are expressed as the mean ± SD. * p < 0.05, ** p < 0.01. (B) Levels of total protein in the BALF and lung injury score after adoptive transfer. Data are expressed as the mean ± SD. * p < 0.05. Representative images of H and E-stained lung sections from RAMP1−/− mice transplanted with AMs isolated from WT or RAMP1−/− mice are shown. Scale bars: 50 μm. (C) mRNA expression of Tnfa, Il-1b, and Il-6 in lung tissues after adoptive transfer. Data are expressed as the mean ± SD. * p < 0.05. (D) Levels of TNF-α, IL-1β, and IL-6 in the BALF after adoptive transfer. Data are expressed as the mean ± SD. * p < 0.05.
Figure 7
Figure 7
Pro-inflammatory and pro-repairing mediators in MDMs after LPS treatment. (A) Gene levels of the pro-inflammatory cytokines Tnfa, Il-1b, and Il-6 in MDMs from WT and RAMP1−/− mice at 72 h after LPS treatment. Data are expressed as the mean ± SD. * p < 0.05, ** p < 0.01, and **** p < 0.001. (B) Percentage of MDMs positive for TNF-α, IL-1β, and IL-6 in WT and RAMP1−/− mice at 72 h after LPS treatment. Data are expressed as the mean ± SD. * p < 0.05. (C) Pro-inflammatory cytokines, including TNF-α, IL-1β, and IL-6, in supernatants isolated from BM-derived macrophages from WT and RAMP1−/− mice stimulated with LPS in the presence or absence of CGRP. Data are expressed as the mean ± SD. ** p < 0.01, **** p < 0.0001. (D) Gene levels of Gm-csf and Il-10 in MDMs from WT and RAMP1−/− mice at 72 h after LPS treatment. Data are expressed as the mean ± SD. * p < 0.05, ** p < 0.01. (E) Gene levels of Gm-csf and Il-10 in BM-derived macrophages isolated from WT and RAMP1−/− mice stimulated with LPS in the presence or absence of CGRP. Data are expressed as the mean ± SD. **** p < 0.0001.
Figure 8
Figure 8
Inflammatory cytokines are released from accumulated neutrophils during LPS-induced acute lung injury. (A) Percentage of TNF-α+, IL-1β+, and IL-6+ neutrophils in WT and RAMP1−/− mice at 72 h after LPS treatment. Data are expressed as the mean ± SD. ** p < 0.01 and **** p < 0.0001. (B) mRNA levels of the pro-inflammatory cytokines Tnfa, Il-1b, and Il-6 and Ramp1 in neutrophils and MDMs from WT and RAMP1−/− mice at 72 h after LPS treatment. Data are expressed as the mean ± SD. * p < 0.05, ** p < 0.01, and **** p < 0.0001.
Figure 9
Figure 9
Effects of CGRP treatment on LPS-induced ALI. (A) Numbers of CD45+ cells, neutrophils, AMs, and MDMs at 72 h in WT mice treated with CGRP or Veh (vehicle). Data are expressed as the mean ± SD. * p < 0.05, ** p < 0.01, *** p < 0.001. (B) Total protein levels in BALF and lung injury score at 72 h in WT mice treated with CGRP or Veh (vehicle). Data are expressed as the mean ± SD. * p < 0.05. (C) mRNA levels of Tnfa, Il-1b, Il-6, Cxcl2, and Ccl2 in lung tissues at 72 h after LPS administration in WT mice treated with CGRP or Veh (vehicle). Data are expressed as the mean ± SD. * p < 0.05, ** p < 0.01.

Similar articles

Cited by

References

    1. Bellani G., Laffey J.G., Pham T., Fan E., Brochard L., Esteban A., Gattinoni L., van Haren F., Larsson A., McAuley D.F., et al. Epidemiology, Patterns of Care, and Mortality for Patients with Acute Respiratory Distress Syndrome in Intensive Care Units in 50 Countries. JAMA. 2016;315:788–800. doi: 10.1001/jama.2016.0291. - DOI - PubMed
    1. Lomas-Neira J., Chung C.S., Perl M., Gregory S., Biffl W., Ayala A. Role of alveolar macrophage and migrating neutrophils in hemorrhage-induced priming for ALI subsequent to septic challenge. Am. J. Physiol. Lung Cell. Mol. Physiol. 2006;290:L51–L58. doi: 10.1152/ajplung.00028.2005. - DOI - PubMed
    1. Hewitt R.J., Lloyd C.M. Regulation of immune responses by the airway epithelial cell landscape. Nat. Rev. Immunol. 2021;21:347–362. doi: 10.1038/s41577-020-00477-9. - DOI - PMC - PubMed
    1. Jean E.E., Good O., Rico J.M.I., Rossi H.L., Herbert D.R. Neuroimmune regulatory networks of the airway mucosa in allergic inflammatory disease. J. Leukoc. Biol. 2022;111:209–221. doi: 10.1002/JLB.3RU0121-023R. - DOI - PMC - PubMed
    1. Verastegui C., Oliveira A.P., Fernandez-Vivero J., Romero A., de Castro J.M. Calcitonin gene-related peptide immunoreactivity in adult mouse lung. Eur. J. Histochem. 1997;41:119–126. - PubMed

LinkOut - more resources