. 2024 Sep 21;25(18):10146.
doi: 10.3390/ijms251810146.

Phenotypic, Metabolic, and Functional Characterization of Experimental Models of Foamy Macrophages: Toward Therapeutic Research in Atherosclerosis

Affiliations

Phenotypic, Metabolic, and Functional Characterization of Experimental Models of Foamy Macrophages: Toward Therapeutic Research in Atherosclerosis

Amina Sarah Henni Mansour et al. Int J Mol Sci. .

Abstract

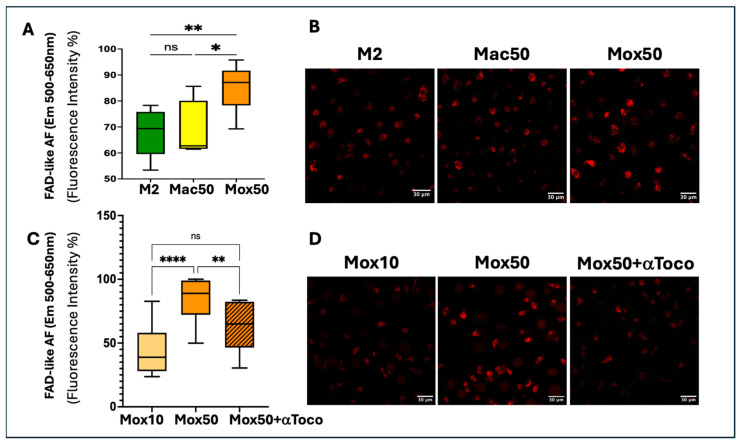
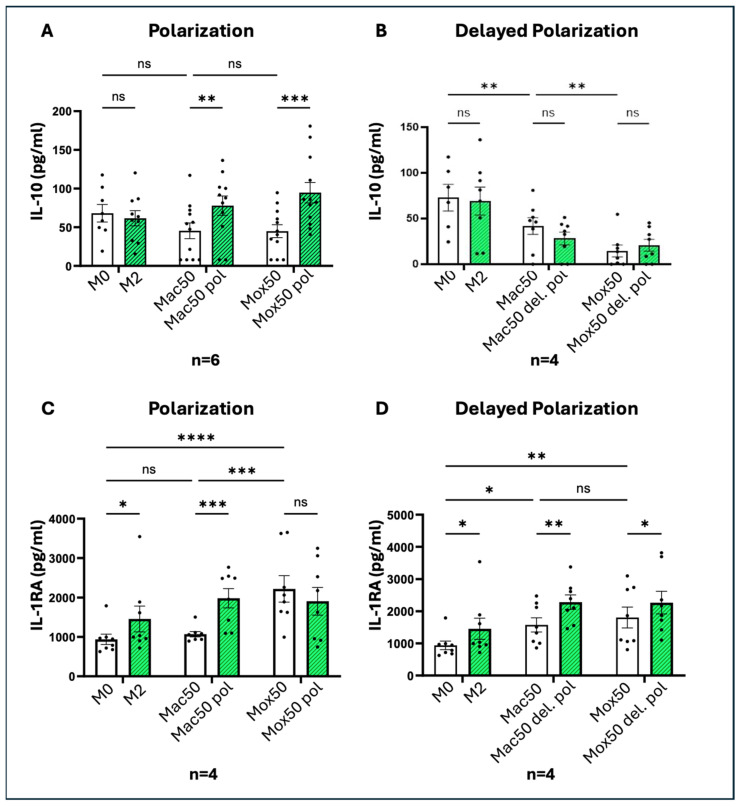
Different types of macrophages (Mφ) are involved in atherogenesis, including inflammatory Mφ and foamy Mφ (FM). Our previous study demonstrated that two-photon excited fluorescence (TPEF) imaging of NADH and FAD autofluorescence (AF) could distinguish experimental models that mimic the different atherosclerotic Mφ types. The present study assessed whether optical differences correlated with phenotypic and functional differences, potentially guiding diagnostic and therapeutic strategies. Phenotypic differences were investigated using three-dimensional principal component analysis and multi-color flow cytometry. Functional analyses focused on cytokine production, metabolic profiles, and cellular oxidative stress, in LDL dose-dependent assays, to understand the origin of AF in the FAD spectrum and assess FM ability to transition toward an immunoregulatory phenotype and function. Phenotypic studies revealed that FM models generated with acetylated LDL (Mac) were closer to immunoregulatory Mφ, while those generated with oxidized LDL (Mox) more closely resembled inflammatory Mφ. The metabolic analysis confirmed that inflammatory Mφ primarily used glycolysis, while immunoregulatory Mφ mainly depended on mitochondrial respiration. FM models employed both pathways; however, FM models generated with high doses of modified LDL showed reduced mitochondrial respiration, particularly Mox FM. Thus, the high AF in the FAD spectrum in Mox was not linked to increased mitochondrial respiration, but correlated with the dose of oxidized LDL, leading to increased production of reactive oxygen species (ROS) and lysosomal ceroid accumulation. High FAD-like AF, ROS, and ceroid accumulation were reduced by incubation with α-tocopherol. The cytokine profiles supported the phenotypic analysis, indicating that Mox FM exhibited greater inflammatory activity than Mac FM, although both could be redirected toward immunoregulatory functions, albeit to different degrees. In conclusion, in the context of immunoregulatory therapies for atherosclerosis, it is crucial to consider FM, given their prevalence in plaques and our results, as potential targets, regardless of their inflammatory status, alongside non-foamy inflammatory Mφ.

Keywords: TPEF autofluorescence; antioxidant; atherosclerosis; bioenergetic immunometabolism; cellular oxidative stress; ceroids; diagnostic and therapeutic strategies; foamy macrophages; immunoregulation; phenotype and cytokine profiling.


Conflict of interest statement

The authors declare they do not have anything to disclose regarding conflicts of interest with respect to this manuscript.

Figures

Figure 1
Figure 1
Phenotype comparison of the different experimental models of Mφ: M1, M2, and FM generated with 50 μg/mL of oxLDL (Mox50) or with 50 μg/mL of acLDL (Mac50). (A) Mean Fluorescence Intensity (MFI) of CD206, CD86, and CD40 (representing the mean level of expression of each marker at the cell surface); (B) Percentage of Cells Positive (PCP) for CD206, CD86, and CD40. (A,B): data obtained using experimental models derived using blood samples from different donors (n = 5 for Mox, n = 7 for Mac, and n = 13 for M1 and M2) after immunostaining using anti-CD86 and anti-CD206 antibodies. (C) FAD and NADH autofluorescence (AF) from TPEF imaging in the NADH spectrum (excitation at 760 nm and detection at 420–500 nm) and FAD spectrum (excitation at 860 nm and detection at 500–650 nm). Normalization was performed for each donor using the maximal value obtained for the experimental model Mox50 as the 100% reference. Data were from n = 8 different donors for all models. * p-value < 0.05; ** p-value < 0.01; *** p-value < 0.001 and **** p-value < 0.0001.
Figure 2
Figure 2
Characterization of the M1, M0, M2, Mox50, and Mac50 models using flow cytometry analysis. Pie charts show the percentage of CD86+/CD206, CD86+/CD206+, CD86/CD206+, and CD86/CD206 subsets for each experimental condition. The M0 model, which corresponds to unstimulated control Mφ, shows, as expected, intermediate percentages of the CD86+/CD206 and CD86/CD206+ subpopulations compared to the two extremes of the continuum, the M1 and M2 models. The outer colored rings indicate the mean fluorescence intensity of CD86 and CD206 using the shown color gradient scale. Data are the mean values of three donors (all cells expressed CD40).
Figure 3
Figure 3
Discrimination of the M1, M2, Mac50, and Mox50 Mφ models using 3D-PCA. (A) The 3D-PCA with the PCP, AF, and MFI data and (B) 3D-PCA with PCP and AF data. Data obtained from different donors (n = 5 for Mox, n = 7 for Mac and n = 13 for M1 and M2). See Supplemental Figures S1A,B and S2A,B.
Figure 4
Figure 4
Quantification of the cytokines secreted in the culture supernatant of the different experimental models of Mφ. (A) Interleukin-18 (IL-18); (B) Interleukin-1β (IL-1 β); (C) Interleukin-6 (IL-6); and (D) Interleukin-10 (IL-10) in the M1, M2, Mac50, and Mox50 models. Data obtained from different donors (n = 9 for IL-18, n = 7 for IL-1β, n = 6 for IL-6, and n = 9 for IL-10). (E) IL-18; (F) IL-1β; (G) IL-6; and (H) IL-10 in the Mac10, Mac50, Mox10, and Mox50 models. Data obtained from different donors (n = 8 for IL-18, n = 5 for IL-1β, n = 6 for IL-6, and n = 6 for IL-10). ns = p-value > 0.05; * p-value < 0.05; ** p-value < 0.01; *** p-value < 0.001 and **** p-value < 0.0001.
Figure 5
Figure 5
Oxygraphy measurement and ATP production in the different Mφ models. (A) Basal Oxygen Consumption Rate (OCR) (basal respiration, ATP-linked respiration, maximal respiratory capacity, and reserve capacity) in M0, M1, M2, and Mox50 cells (representative results; n = 8 different donors). (B) Basal OCR in M0, M1, M2, and Mox50 cells (n = 8 donors). (C) Basal OCR in Mac10, Mac50, Mox10, and Mox50 cells (n = 8 donors). (D) ExtraCellular Acidification Rate (ECAR) indicative of the level of glycolytic flux in M0, M1, M2, and Mox50 cells (n = 7 donors). (E) ECAR in Mac10, Mac50, Mox10, and Mox50 cells (n = 7 donors). (F) ATP-linked to mitochondrial respiration (light green) versus non-mitochondrial ATP production (light red) in M0, M1, M2, and Mox50 cells (n = 8 donors). Statistical comparisons between experimental conditions are represented by green stars for mitochondrial ATP and red stars for non-mitochondrial ATP. ns = p-value > 0.05; * p-value < 0.05; ** p-value < 0.01; *** p-value < 0.001 and **** p-value < 0.0001.
Figure 6
Figure 6
The AF in the FAD spectrum is linked to LDL handling and oxidative stress. (A) Quantification of FAD-like AF (λEm= 500–650 nm) in M2, Mac50, and Mox50 cells (n = 8). (B) Representative TPEF images of one donor (n = 8) in the M2, Mac50, and Mox50 conditions. (C) Quantification of AF emission in the FAD spectrum (Em 500–650 nm) in the Mox10, Mox50, and Mox50 + α-tocopherol conditions (n = 4). (D) Representative TPEF images of one donor (n = 3), in the Mox10, Mox50, and Mox50 + α-tocopherol conditions. ns = p-value > 0.05; * p-value < 0.05; ** p-value < 0.01; **** p-value < 0.0001.
Figure 7
Figure 7
Detection of cellular reactive oxygen species (ROS) and ceroids. (A) Quantification of ROS level in the different experimental models of FM (Mac10, Mox10, Mac50, Mox50) after labeling with CellROX (n = 6 donors) (expressed as percentage of the maximal fluorescence intensity observed in the Mox50 models for each donor). (B) Quantification of ROS in the different models (Mox10, Mox50, Mac10, Mac50) obtained in the presence or absence of the antioxidant α-tocopherol (n = 6 donors). (C) Fluorescence microscopy images of the different models (Mox10, Mox50, Mac10, Mac50) after CellROX labeling (n = 6 donors). (D) Quantification of the SenTraGorTM® fluorescence intensity in the different FM models (Mox10, Mac50, Mox50) (n = 6 donors). (E) Quantification of SenTraGorTM® fluorescence intensity in the presence or absence of the antioxidant α-tocopherol (n = 6 donors). (F) Confocal microscopy images of the different models generated in the presence or absence of α-tocopherol and labeled with SenTraGorTM® (n = 6 donors). ns = p-value > 0.05; * p-value < 0.05; ** p-value < 0.01; *** p-value < 0.001.
Figure 8
Figure 8
Colocalization of ceroids and LAMP-2 (lysosomal marker) in the Mox50 model (representative images obtained from one donor, n = 3, with a Leica TCS SP5 microscope).
Figure 9
Figure 9
Oxygraphy measurement in the different FM models generated in the absence or in the presence of α-tocopherol. (A) Basal Oxygen Consumption Rate (OCR) indicative of the level of basal mitochondrial respiration in Mac10, Mac50, Mox10, and Mox50 Mφ incubated or not with α-tocopherol (n = 4 donors), (B) Basal ExtraCellular Acidification Rate (ECAR) indicative of the level of glycolytic flux in Mac10, Mac50, Mox10, and Mox50 Mφ incubated or not with α-tocopherol (n = 4 donors). ns = p-value > 0.05; * p-value < 0.05; *** p-value < 0.001.
Figure 10
Figure 10
Fold induction of the different surface markers (MFI of the marker in the experimental condition divided by its MFI in the control condition, M0 = unstimulated Mφ) for the ‘Polarization’ protocol (stimulation with the cytokine cocktail added simultaneously with oxLDL/acLDL for 48 h): (A) CD206 (n = 8 donors); (C) CD86 (n = 4 donors); and (E) CD40 (n = 4 donors), or for the ‘Delayed Polarization’ protocol (treatment with oxLDL/acLDL for 48 h, followed by the cytokine cocktail for 48 h after changing the medium): (B) CD206 (n = 8 donors); (D) CD86 (n = 4 donors); and (F) CD40 (n = 4 donors). Here ‘Mac/Mox’ models were named ‘Mac/Mox pol’ (for polarization) when the cytokine cocktail was added during LDL incubation or ‘Mac/Mox del. pol’ (for delayed polarization) when the cytokine cocktail was added after the incubation with LDL, once the cells had already become FM. ns = p-value > 0.05; * p-value < 0.05; ** p-value < 0.01; *** p-value < 0.001 and **** p-value < 0.0001.
Figure 11
Figure 11
Degree of polarization (represented by the fold induction of CD206) according to the experimental conditions: (A) for the ‘Polarization’ protocol, where the cytokine cocktail, alone or with α-tocopherol, is added simultaneously with oxLDL/acLDL for 48 h, and (B) for the ‘Delayed Polarization’ protocol, when oxLDL/acLDL alone or in combination with α-tocopherol was added for 48 h, followed (after changing the medium) by the cytokine cocktail for 48 h. The Mac/Mox models were named ‘Mac/Mox pol’ (for polarization) when the cytokine cocktail (to induce polarization) was added during LDL incubation, or ‘Mac/Mox del. pol’ (for delayed polarization) when the cytokine cocktail was added after incubation with LDL, once the cells had already become FM. Data for the histograms were obtained by automated quantification of the CD40 and CD206 fluorescence signals in the imaged cells (representative images obtained from one donor, n = 4). (C) Images of Mφ obtained after a 48 h incubation with ac/oxLDL alone, or in combination with the cytokine cocktail. * p-value < 0.05; ** p-value < 0.01; *** p-value < 0.001.
Figure 12
Figure 12
Quantification of the production of type-II cytokines after treatment with the immunoregulatory cytokine cocktail. IL-10 production in the Mac50 and Mox50 models: (A) stimulated with the cytokine cocktail added simultaneously with oxLDL/acLDL (polarization) (n = 6 donors), or (B) stimulated with the cytokine cocktail added after the incubation with modified LDL (delayed polarization) (n = 4 donors); IL1-RA production in the Mac50 and Mox50 models: (C) stimulated with the cytokine cocktail added simultaneously with oxLDL/acLDL, or (D) stimulated with the cytokine cocktail added after incubation with modified LDL (delayed polarization) (n = 4 donors). ns = p-value > 0.05; * p-value < 0.05; ** p-value < 0.01; *** p-value < 0.001 and **** p-value < 0.0001.
Figure 13
Figure 13
Quantification of IL-6 production in the Mac50 and Mox50 models stimulated with the cytokine cocktail, added simultaneously with oxLDL/acLDL, with or without α-tocopherol (n = 6 donors). Cells were incubated with acLDL/oxLDL (Mac50/Mox50), with acLDL/oxLDL + IL-4 + IL-13 (Mac50/Mox50 pol) or with acLDL/oxLDL + α-tocopherol + IL-4 + IL-13 (Mac50/Mox50 + toco pol). ns = p-value > 0.05; ** p-value < 0.01; *** p-value < 0.001.

Similar articles

References

    1. Falk E. Pathogenesis of Atherosclerosis. J. Am. Coll. Cardiol. 2006;47:C7–C12. doi: 10.1016/j.jacc.2005.09.068. - DOI - PubMed
    1. Libby P., Hansson G.K. Inflammation and Immunity in Diseases of the Arterial Tree: Players and Layers. Circ. Res. 2015;116:307–311. doi: 10.1161/CIRCRESAHA.116.301313. - DOI - PMC - PubMed
    1. Flynn M.C., Pernes G., Lee M.K.S., Nagareddy P.R., Murphy A.J. Monocytes, Macrophages, and Metabolic Disease in Atherosclerosis. Front. Pharmacol. 2019;10:666. doi: 10.3389/fphar.2019.00666. - DOI - PMC - PubMed
    1. Biessen E.A.L., Wouters K. Macrophage Complexity in Human Atherosclerosis: Opportunities for Treatment? Curr. Opin. Lipidol. 2017;28:419–426. doi: 10.1097/MOL.0000000000000447. - DOI - PubMed
    1. Peterson K.R., Cottam M.A., Kennedy A.J., Hasty A.H. Macrophage-Targeted Therapeutics for Metabolic Disease. Trends Pharmacol. Sci. 2018;39:536–546. doi: 10.1016/j.tips.2018.03.001. - DOI - PMC - PubMed

LinkOut - more resources