. 2024 Sep 21;25(18):10147.
doi: 10.3390/ijms251810147.

miR-10a/b-5p-NCOR2 Regulates Insulin-Resistant Diabetes in Female Mice

Affiliations

miR-10a/b-5p-NCOR2 Regulates Insulin-Resistant Diabetes in Female Mice

Se Eun Ha et al. Int J Mol Sci. .

Abstract

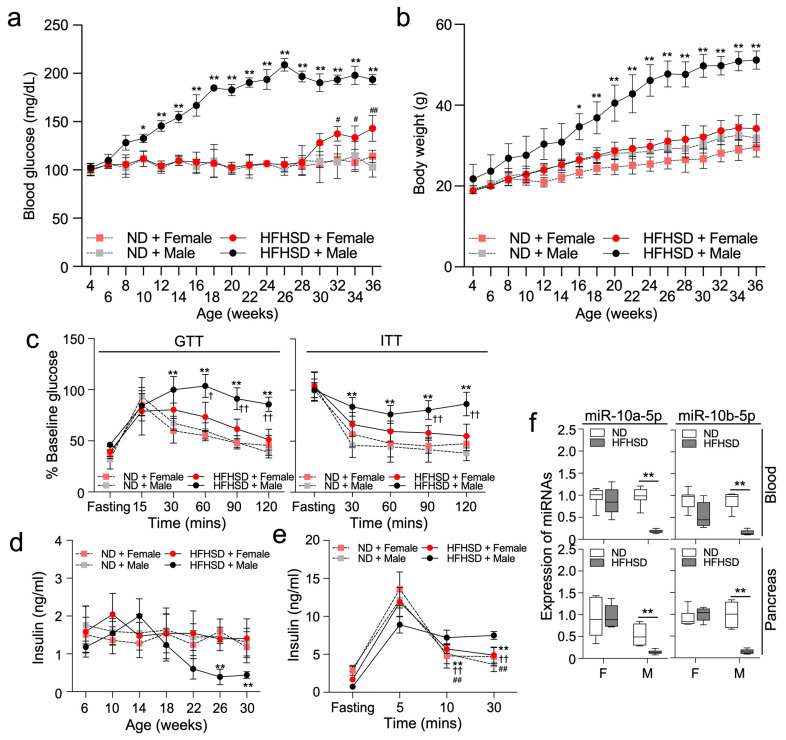
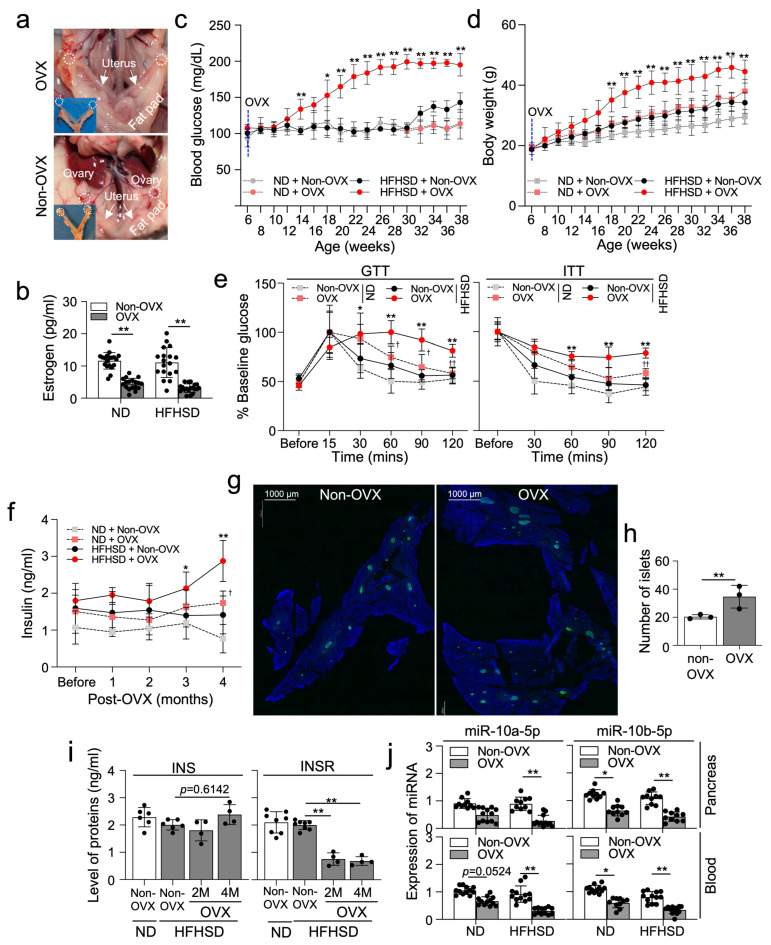
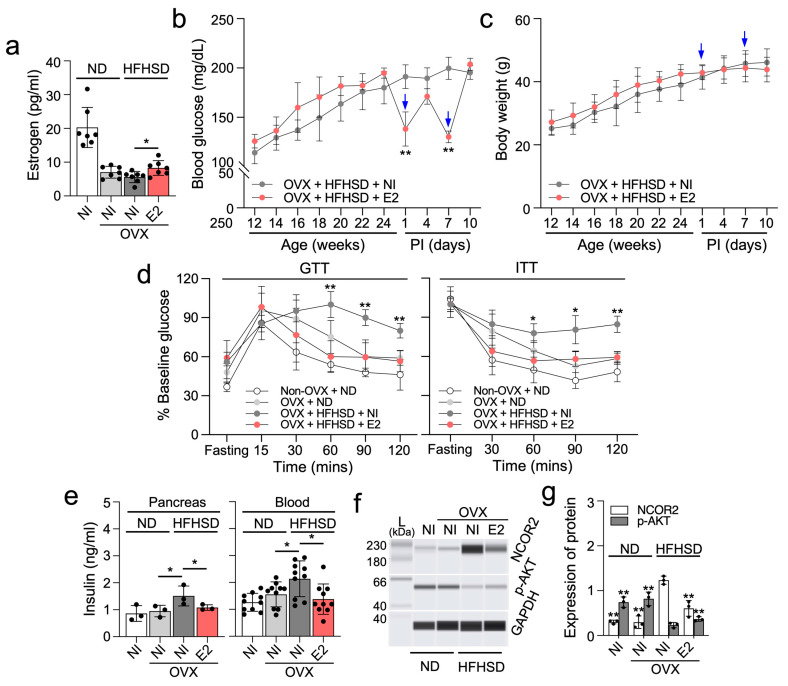
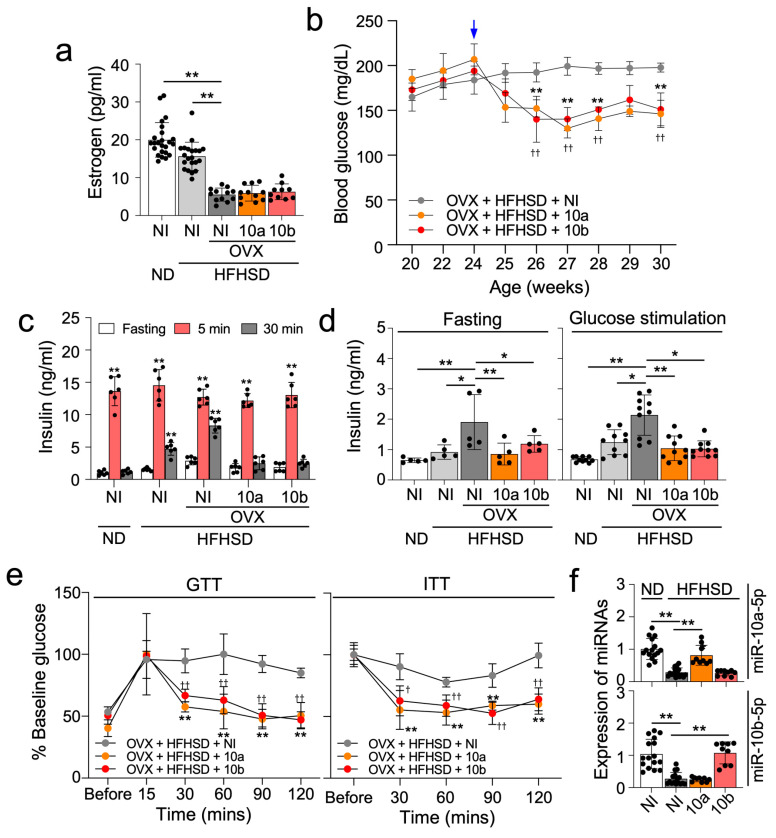
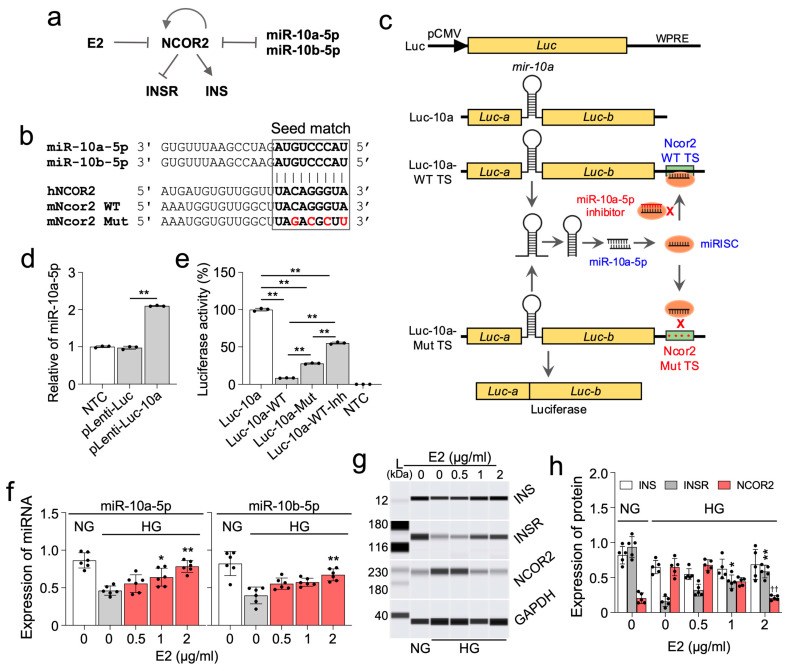
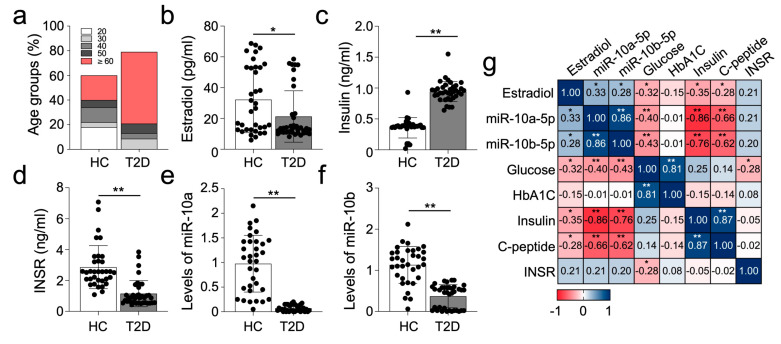
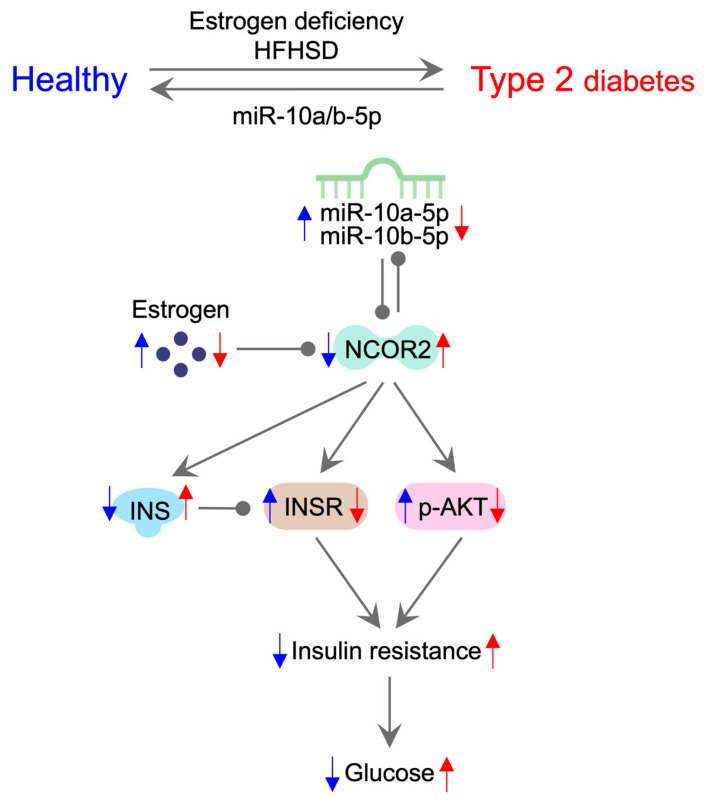
Gender and biological sex have distinct impacts on the pathogenesis of type 2 diabetes (T2D). Estrogen deficiency is known to predispose female mice to T2D. In our previous study, we found that a high-fat, high-sucrose diet (HFHSD) induces T2D in male mice through the miR-10b-5p/KLF11/KIT pathway, but not in females, highlighting hormonal disparities in T2D susceptibility. However, the underlying molecular mechanisms of this hormonal protection in females remain elusive. To address this knowledge gap, we utilized ovariectomized, estrogen-deficient female mice, fed them a HFHSD to induce T2D, and investigated the molecular mechanisms involved in estrogen-deficient diabetic female mice, relevant cell lines, and female T2D patients. Initially, female mice fed a HFHSD exhibited a delayed onset of T2D, but ovariectomy-induced estrogen deficiency promptly precipitated T2D without delay. Intriguingly, insulin (INS) was upregulated, while insulin receptor (INSR) and protein kinase B (AKT) were downregulated in these estrogen-deficient diabetic female mice, indicating insulin-resistant T2D. These dysregulations of INS, INSR, and AKT were mediated by a miR-10a/b-5p-NCOR2 axis. Treatment with miR-10a/b-5p effectively alleviated hyperglycemia in estrogen-deficient T2D female mice, while β-estradiol temporarily reduced hyperglycemia. Consistent with the murine findings, plasma samples from female T2D patients exhibited significant reductions in miR-10a/b-5p, estrogen, and INSR, but increased insulin levels. Our findings suggest that estrogen protects against insulin-resistant T2D in females through miR-10a/b-5p/NCOR2 pathway, indicating the potential therapeutic benefits of miR-10a/b-5p restoration in female T2D management.

Keywords: diabetes mellitus; estrogen; microRNAs; pancreatic β-cells.


Conflict of interest statement

This author discloses the following: S.R. and the University of Nevada Reno Office of Technology Transfer (serial no. 62/837,988, filed 24 April 2019) have published a PCT International Patent WO/2020/219872 entitled “Methods and compositions of miR-10 mimics and targets thereof”. S.R. is an employee and a member of the board of directors of RosVivo Therapeutics. S.E.H. and R.S. are members of the board of directors of RosVivo Therapeutics. The remaining authors disclose no conflicts.

Figures

Figure 1
Figure 1
Male mice, but not female mice exhibit a diabetic phenotype when fed a high-fat high-sucrose diet (HFHSD). Male and female C57 mice were fed either a normal diet (ND) or a HFHSD. (a,b) Comparison of fasting blood glucose levels and body mass. n = 7 per group. * p < 0.05 and ** p < 0.01 (ND versus HFHSD in male mice); # p < 0.05 and ## p < 0.01 (ND versus HFHSD in female mice). (c) Comparison of intraperitoneal glucose tolerance tests (GTT) and insulin tolerance tests (ITT) at 28 weeks old. n = 7 per group. ** p < 0.01 (ND versus HFHSD in male mice); p < 0.05 and †† p < 0.01 (versus HFHSD-fed female mice). (d) Changes in insulin levels after 6 h of fasting. n = 12 per group. ** p < 0.01 (ND versus HFHSD in male mice). (e) Comparison of insulin levels after 6 h of fasting and after glucose stimulation at 5 min, 10 min, and 30 min at 32 weeks old. n = 5 per group. ** p < 0.01 (10 min, 30 min versus 5 min in fed HFHSD female mice); †† p < 0.01 (10 min, 30 min versus 5 min in ND-fed female mice); ## p < 0.01 (10, 30 min versus 5 min in ND-fed male mice). (f) Expression profiles of miR-10a-5p and miR-10b-5p in the whole blood, and pancreas tissue of males and females fed a ND or a HFHSD for 28 weeks. n = 3–6 per group. ** p < 0.01 (ND versus HFHSD in male mice). For all panels, error bars indicate the standard error of the mean (SEM) derived from one-way ANOVA.
Figure 2
Figure 2
Ovariectomized (OVX) female mice fed a HFHSD develop diabetes and obesity. (a) Gross anatomical images of OVX or non-OVX C57 females. (b) Levels of estrogen (pg/mL) in the serum from OVX or non-OVX females fed a HFHSD or a ND. n = 12 per group. ** p < 0.01 (OVX versus non-OVX). (c,d) Comparison of fasting blood glucose levels and body mass in non-OVX or OVX female mice. n = 7 per group. * p < 0.05 and ** p < 0.01, OVX versus non-OVX. (e) Comparison of intraperitoneal GTT and ITT. n = 7 per group. * p < 0.05 and ** p < 0.01 (OVX versus non-OVX in HFHSD-fed female mice); p < 0.05 and †† p < 0.01 (ND versus HFHSD in OVX female mice). (f) Changes in insulin levels after 6 h of fasting in the serum in non-OVX and OVX females. * p < 0.05 and ** p < 0.01 (OVX versus non-OVX in HFHSD-fed female mice); p < 0.05 (ND versus HFHSD in OVX female mice). n = 5 per group. (g) Cross-section images of the pancreatic islets containing β cells (insulin, INS+) from OVX and non-OVX HFHSD-fed female mice. Scale bars are 1000 μm. (h) Quantification of the number of islets in (g). n = 3 per group. ** p < 0.01 (OVX versus non-OVX). (i) Comparison of insulin (INS) and insulin receptor (INSR) levels in the pancreas tissue from OVX or non-OVX females fed a HFHSD or a ND. n = 4 per group. ** p < 0.01 (versus Non-OVX in HFHSD-fed female mice). (j) Expression profiles of miR-10a-5p and miR-10b-5p in the whole blood and pancreas of non-OVX or OVX female mice under ND or HFHSD conditions. * p < 0.05 and ** p < 0.01. n = 12 per group. Error bars indicate the SEM derived from one-way ANOVA.
Figure 3
Figure 3
Estrogen partially improves glucose and insulin homeostasis in ovariectomized HFHSD-fed diabetic female mice. (a) Comparison of estrogen levels in OVX mice fed a ND or a HFHSD and injected twice with 50 µg/kg of β-estradiol (E2) at post-injection 1 week or given no injection (NI). n = 7 per group. (b,c) Fasting blood glucose levels and body mass in OVX mice fed a HFHSD and injected twice (↓) with E2 or given NI. n = 7 per group. * p < 0.05 and ** p < 0.01 (E2 versus NI). n = 5–10 per group. (d) Comparison of GTT and ITT after the 2nd E2 injection. n = 7 per group. * p < 0.05 and ** p < 0.01 (E2 versus NI). (e) Comparison of insulin levels after 6 h of fasting in OVX mice fed a ND or HFHSD after the 2nd E2 injection. n = 3 (pancreas) or 7 (blood) per group. * p < 0.05. (f,g) Quantification of NCOR2 and phosphorylated-AKT (Ser473) in the pancreas of OVX female mice fed a ND or a HFHSD after the 2nd E2 injection. n = 3 per group. ** p < 0.01 (versus OVX mice fed HFHSD and given NI). Error bars indicate the SEM derived from one-way ANOVA.
Figure 4
Figure 4
miR-10a-5p mimic and miR-10b-5p mimic rescue diabetic phenotype in ovariectomized HFHSD-fed diabetic female mice. (a) Levels of estrogen (pg/mL) in the serum from OVX mice fed a ND or a HFHSD and injected once with 500 ng/g of miR-10a-5p mimic (10a), miR-10b-5p mimic (10b) or given no injection (NI). n = 20 per group. (b) Fasting blood glucose levels in OVX mice fed a ND or a HFHSD and injected (↓) with 10a, 10b, or given NI. n = 7 per group. ** p < 0.01 (10a versus NI); †† p < 0.01 (10b versus NI). n = 7–10 per group. (c) Insulin levels after glucose administration at 5 min, 10 min, and 30 min after 6 h of fasting in OVX and ND or HFHSD-fed females at 3 weeks post-injection (PI) in (b). n = 6 per group. ** p < 0.01 (5 min, 30 min versus 5 min). (d) Comparison of insulin levels after 6 h of fasting and 2 h after glucose stimulation in OVX and ND or HFHSD-fed females at 3 weeks PI. n = 5 per group. * p < 0.05 and ** p < 0.01 (versus OVX female given NI in HFHSD). (e) Comparison of GTT and ITT at 3 weeks PI. n = 7 per group. p < 0.05, †† p < 0.01 and ** p < 0.01 (versus OVX female given NI in HFHSD). (f) Levels of miR-10a-5p and miR-10b-5p in pancreas at 3 weeks PI. n = 10 per group. ** p < 0.01 (versus OVX female NI in HFHSD). For all panels, error bars indicate the SEM derived from one-way ANOVA.
Figure 5
Figure 5
β-estradiol (E2) regulates the expression of essential metabolic proteins via miR-10a/b-5p. (a) Ingenuity Pathway Analysis of the target genes of miR-10a/b-5p and E2. (b) Seed match target sequences of miR-10a/b-5p in the 3′ UTR of NCOR2 in humans and mice. (c) Schematic illustration of the target validation mechanism and maps of the pLenti-Luc-10a-Ncor2 vectors. In this design, the mouse pre-mir-10a (110 bp) with an artificial intron is strategically inserted within the luciferase (Luc) gene, resulting in separated Luc-a and Luc-b exons. The wild type (WT) or mutant (Mut) target-binding sequence of the mouse Ncor2 is then introduced into the 3′ UTR of the Luc gene. Upon transcription, a miR-10a duplex comprising mature miR-10a-5p and miR-10a-3p strands is generated from the artificial intron, which encodes a pre-mir-10a spliced out from the primary Luc-a and Luc-b transcripts. The miR-10a-5p strand is preferentially selected within the RNA-induced silencing complex (RISC), forming the miRISC that specifically binds to the Ncor2 WT target site (TS), but not the Mut TS. The exonic segments of Luc-a and Luc-b then join to produce functional LUC protein (luciferase), whose activity is downregulated by the targeting action of miR-10a-5p. Moreover, inhibition of miR-10a-5p by its inhibitor mitigates its targeting effect on luciferase. Luc, luciferase gene; pCMV, CMV promoter; WPRE, Woodchuck Hepatitis Virus Posttranscriptional Regulatory Element DNA sequence; miRISC, miRNA-RNA-induced silencing complex. (d) Expression of miR-10a-5p in HEK293T cells transfected with the luciferase reporter plasmid containing the murine pre-mir-10a insertion (pLenti-Luc-10a) and without insertion (pLenti-Luc). pLenti-Luc-10a vector was used to insert the NCOR2 wild type target site (WT TS) or the mutant target site (Mut TS) at the end of luciferase gene (c). n = 3 per group. (e) Luciferase activity in HEK293T cells transfected with pLenti-Luc-10a, pLenti-Luc-10a-WT TS, pLenti-Luc-10a-Mut TS, or co-transfected with miR-10b-5p inhibitor (pLenti-Luc-10a-WT TS-Inh). NTC, non-transfected cells. n = 3 per group. (f) Effects of E2 on expression of miR-10a/b-5p in NIT-2 cells. n = 5–6 per group. (g,h) Automated western blots and quantified protein expression of INS, INSR, and NCOR2 in NIT-2 cells cultured in a normal glucose medium (1 mg/L, NG) or a high glucose medium (10 mg/L, HG) and treated with E2 for 24 h. A protein marker (L) with corresponding molecular weights (kDa) is shown. n = 5 per group. * p < 0.05, ** p < 0.01 (versus given NT in a HG). n = 5–6 per group. Error bars indicate the SEM derived from one-way ANOVA.
Figure 6
Figure 6
Altered levels of miR-10a/b-5p, INS, and INSR in female patients with T2D. (a) Distribution of age groups in female healthy control (HC) individuals and T2D patients. (bd) Comparison of estrogen, insulin, and INSR levels in the plasma samples from female T2D patients (n = 37) compared to female HC individuals (n = 34). ** p < 0.01. (e,f) Levels of miR-10a-5p and miR-10b-5p in the plasma samples from female T2D patients and HC individuals. (g) Spearman rank correlation between levels of estradiol, miR-10a-5p, miR-10b-5p, and metabolic parameters in female T2D patients and HC individuals. Error bars indicate the SEM derived from one-way ANOVA. * p < 0.05, ** p < 0.01.
Figure 7
Figure 7
Molecular pathway outlining the etiology and pathogenesis of insulin-resistant T2D in females. Ovariectomized HFHSD-fed female mice develop T2D, which can be rescued by miR-10a-5p or miR-10b-5p injection. In healthy female mice, estrogen protects against T2D via the estrogen-dependent miR-10a/b-5p pathway. In ovariectomized HFHSD-fed female mice, estrogen deficiency reduces the expression of miR-10a/b-5p via NCOR2. The mutual inhibition between miR-10a/b-5p and NCOR2 enhances NCOR2 levels, increasing insulin production and decreasing INSR expression and AKT phosphorylation, leading to insulin resistance and T2D. Blue and red arrows denote up and down-regulation of designated miRNAs, hormones, proteins, or conditions in healthy or diabetic states.

References

    1. Nair G.G., Tzanakakis E.S., Hebrok M. Emerging routes to the generation of functional beta-cells for diabetes mellitus cell therapy. Nat. Rev. Endocrinol. 2020;16:506–518. doi: 10.1038/s41574-020-0375-3. - DOI - PMC - PubMed
    1. Nordstrom A., Hadrevi J., Olsson T., Franks P.W., Nordstrom P. Higher Prevalence of Type 2 Diabetes in Men Than in Women Is Associated With Differences in Visceral Fat Mass. J. Clin. Endocr. Metab. 2016;101:3740–3746. doi: 10.1210/jc.2016-1915. - DOI - PubMed
    1. Louet J.F., LeMay C., Mauvais-Jarvis F. Antidiabetic actions of estrogen: Insight from human and genetic mouse models. Curr. Atheroscler. Rep. 2004;6:180–185. doi: 10.1007/s11883-004-0030-9. - DOI - PubMed
    1. Merino B., Garcia-Arevalo M. Sexual hormones and diabetes: The impact of estradiol in pancreatic beta cell. Int. Rev. Cell Mol. Biol. 2021;359:81–138. - PubMed
    1. Leiter E.H., Chapman H.D. Obesity-induced diabetes (diabesity) in C57BL/KsJ mice produces aberrant trans-regulation of sex steroid sulfotransferase genes. J. Clin. Investig. 1994;93:2007–2013. doi: 10.1172/JCI117194. - DOI - PMC - PubMed

MeSH terms

LinkOut - more resources