. 2024 Sep 22;25(18):10168.
doi: 10.3390/ijms251810168.

Polyethylene Micro/Nanoplastics Exposure Induces Epithelial-Mesenchymal Transition in Human Bronchial and Alveolar Epithelial Cells

Affiliations

Polyethylene Micro/Nanoplastics Exposure Induces Epithelial-Mesenchymal Transition in Human Bronchial and Alveolar Epithelial Cells

Alice Traversa et al. Int J Mol Sci. .

Abstract

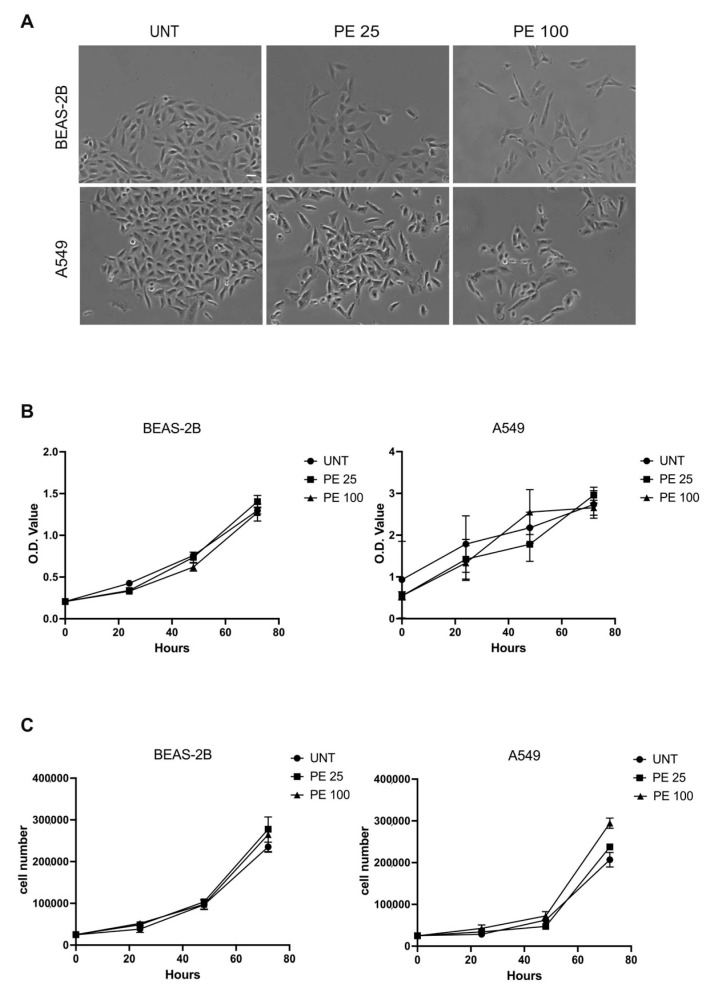
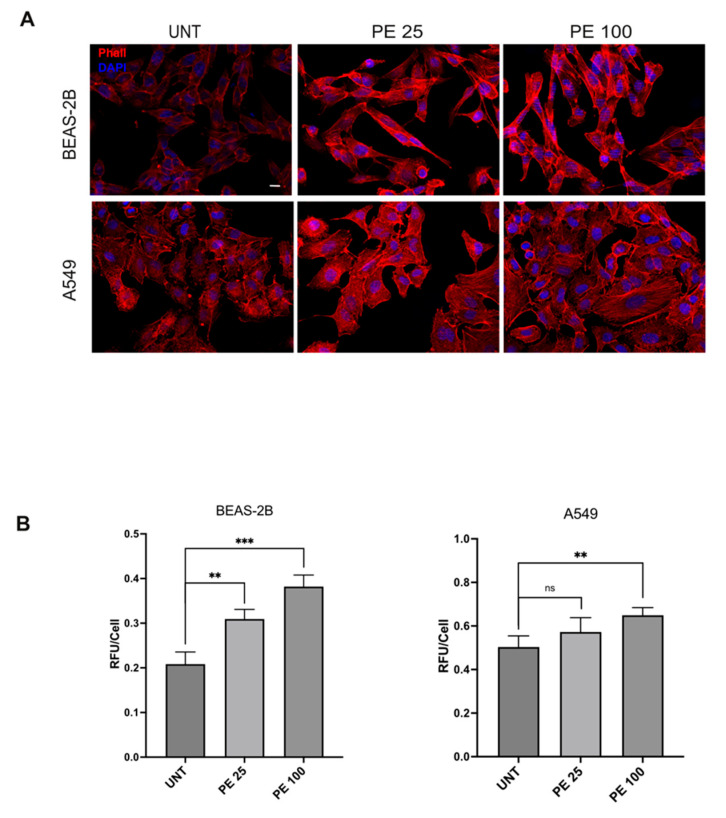
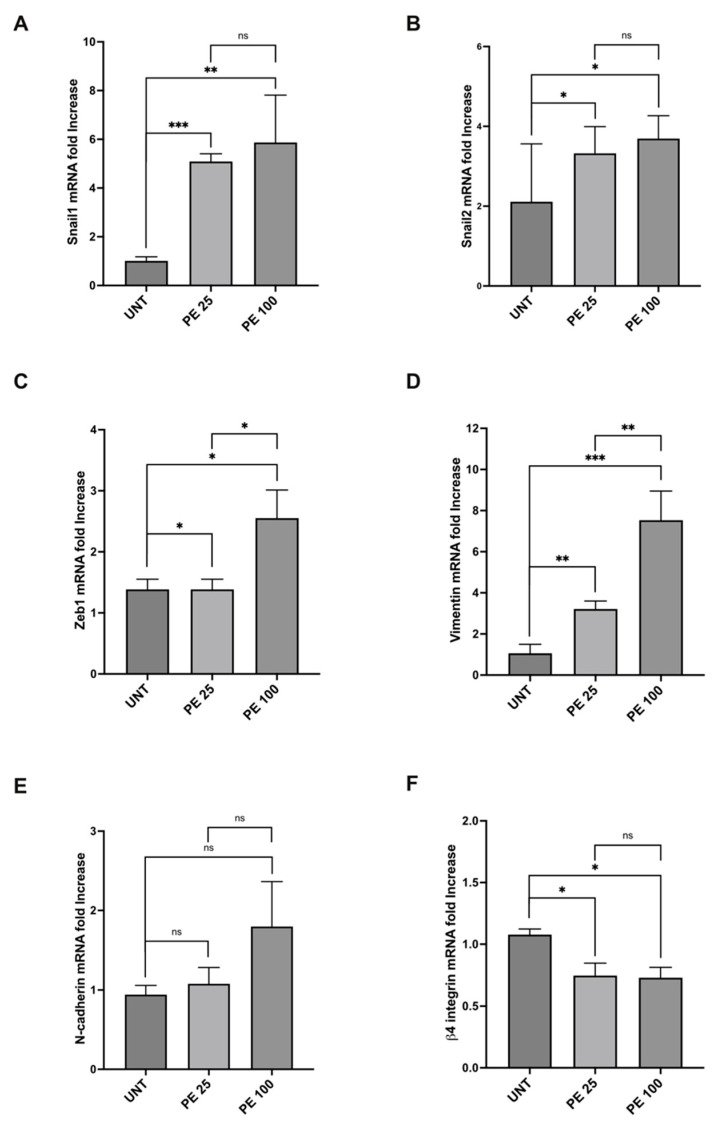
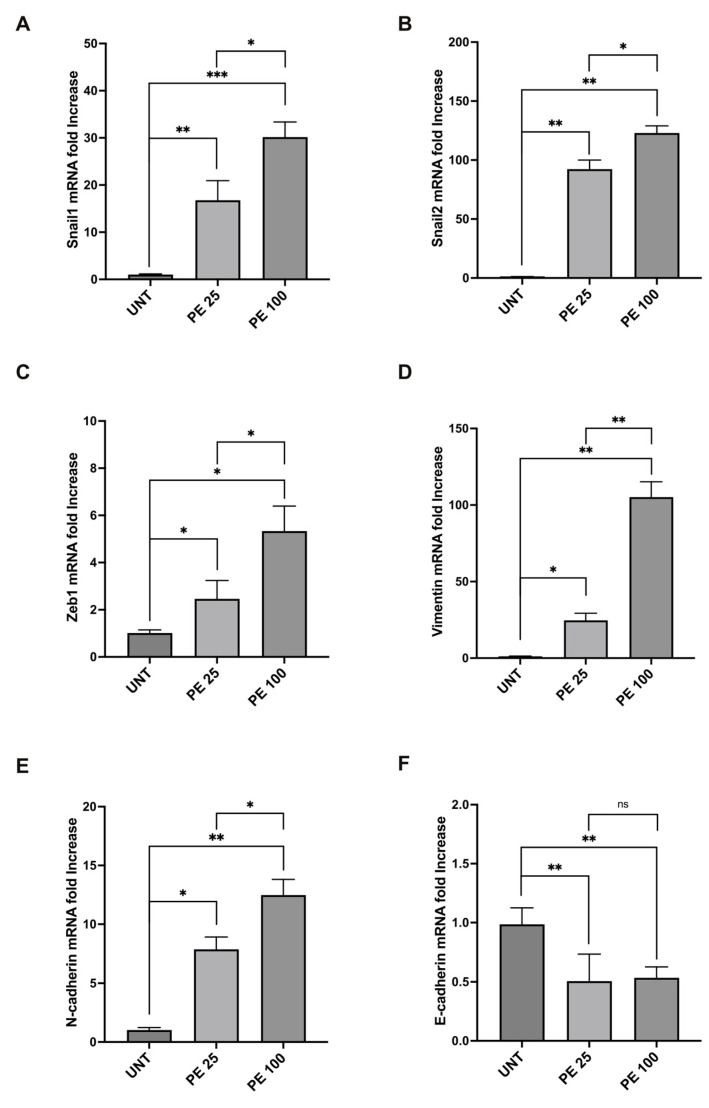
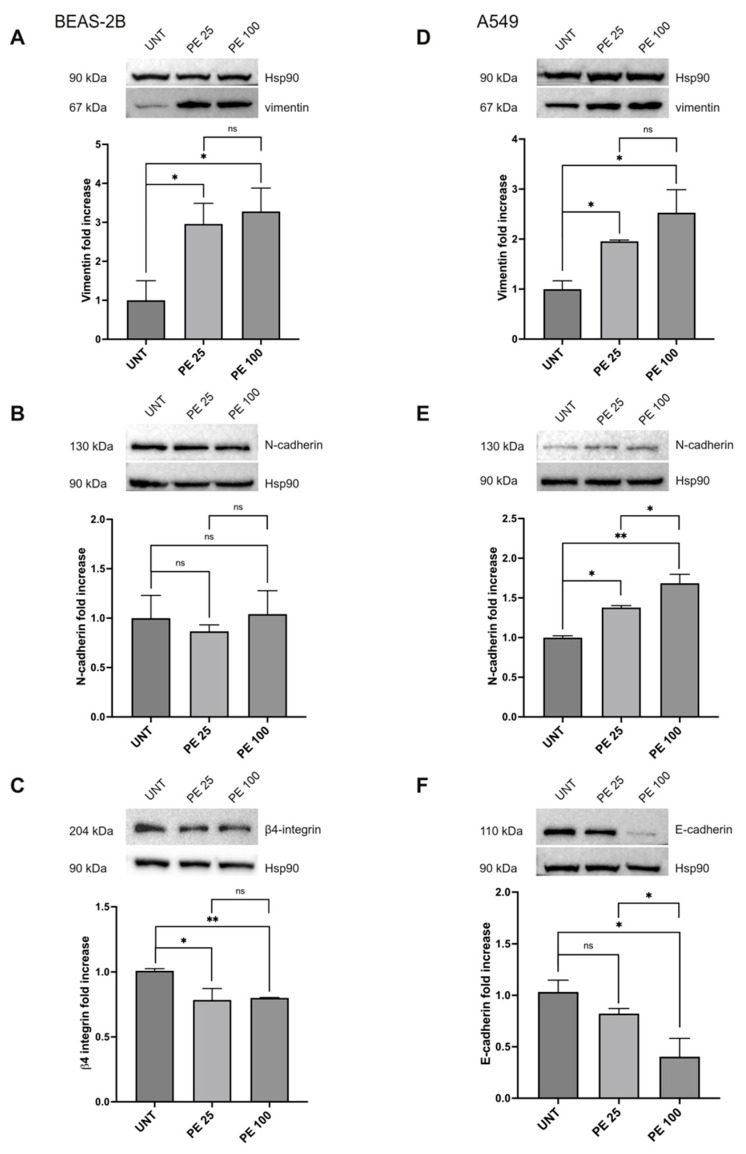
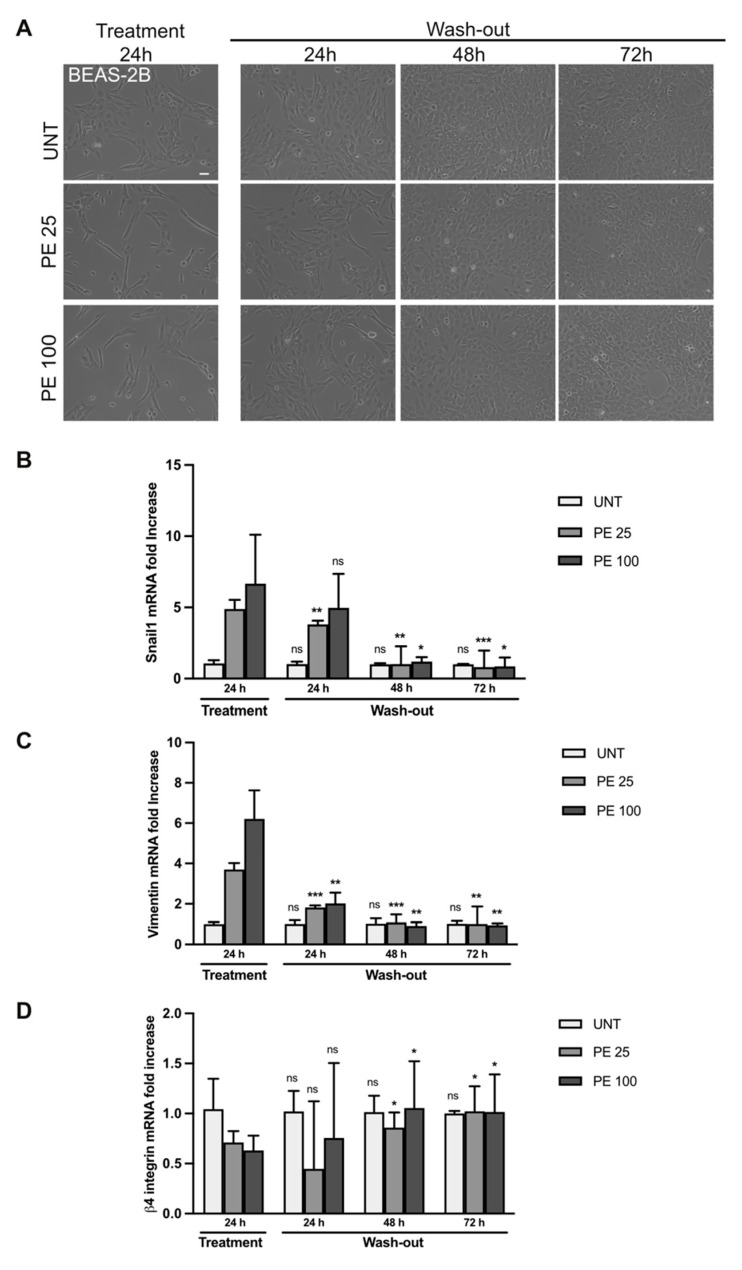
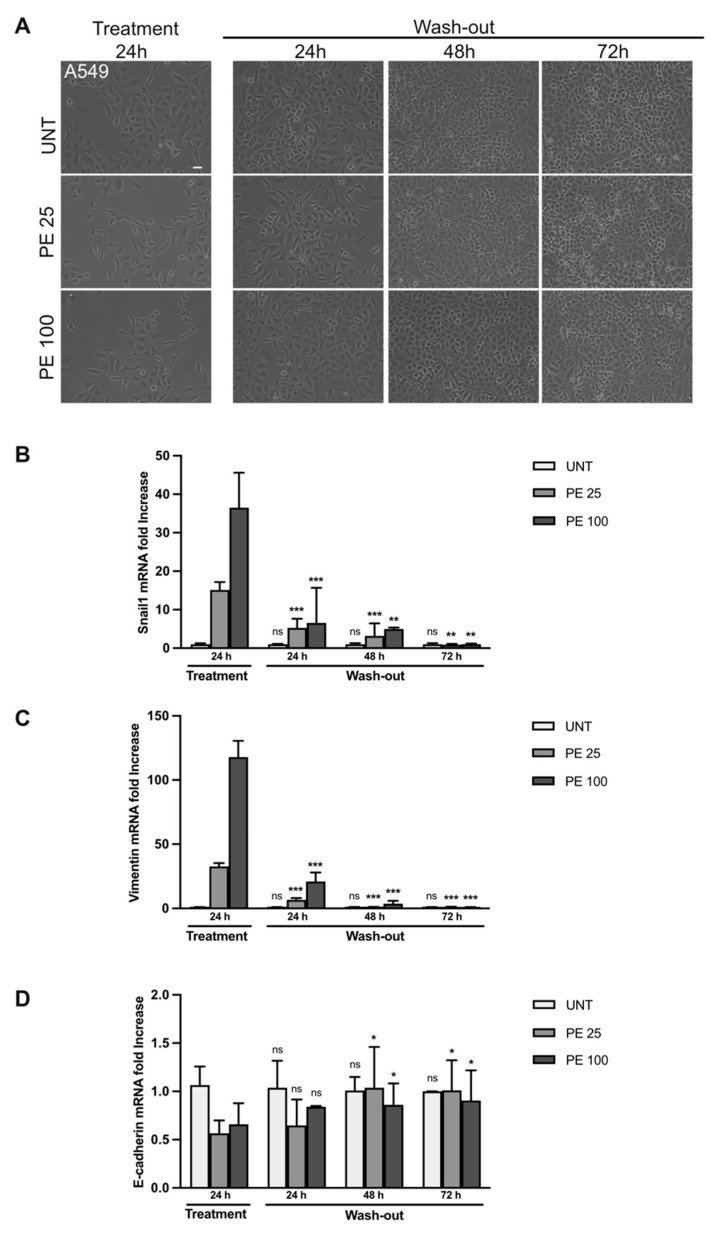
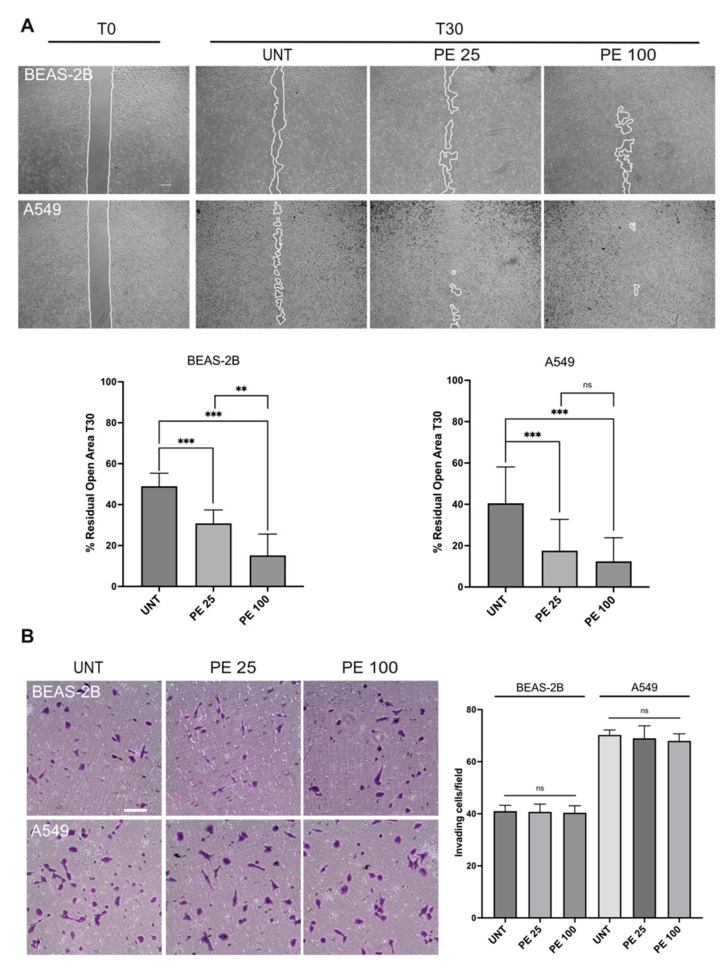
Micro/nanoplastics (MNPs), which are widely spread in the environment, have gained attention because of their ability to enter the human body mainly through ingestion, inhalation, and skin contact, thus representing a serious health threat. Several studies have reported the presence of MNPs in lung tissue and the potential role of MNP inhalation in triggering lung fibrosis and tumorigenesis. However, there is a paucity of knowledge regarding the cellular response to MNPs composed of polyethylene (PE), one of the most common plastic pollutants in the biosphere. In this study, we investigated the effects of low/high concentrations of PE MNPs on respiratory epithelial cell viability and migration/invasion abilities, using MTT, scratch, and transwell assays. Morphological and molecular changes were assessed via immunofluorescence, Western blot, and qRT-PCR. We demonstrated that acute exposure to PE MNPs does not induce cellular toxicity. Instead, cells displayed visible morphological changes also involving actin cytoskeleton reorganization. Our data underlined the role of epithelial-mesenchymal transition (EMT) in triggering this process. Moreover, a remarkable increase in migration potential was noticed, in absence of a significant alteration of the cell's invasive capacity. The present study highlights the potential impact of PE MNPs inhalation on the human respiratory epithelium, suggesting a possible role in carcinogenesis.

Keywords: EMT; MNPs; alveolar; bronchial; polyethylene.


Conflict of interest statement

The authors declare no conflicts of interest.

Figures

Figure 1
Figure 1
Evaluation of acute PE MNPs exposure on morphological characteristics cellular viability and proliferation in human bronchial epithelial cells (BEAS-2B) and human alveolar epithelial cells (A549). (A) Representative phase contrast images of BEAS-2B and A549 cells treated for 24 h with 0.01% Tween20 (UNT) or PE MNPs at 25 μg/mL (PE 25) and 100 μg/mL (PE 100). Bar: 20 μm. (B) The effect of PE MNPs at (24, 48, and 72 h) on BEAS-2B and A549 cell viability as determined via MTT assay and expressed in O.D. value. (C) The effect of PE MNPs at 24, 48 and 72 h on BEAS-2B and A549 cell proliferation, as determined via viable cell counts. (B,C) Mean value ± standard deviation (SD) was obtained from three independent experiments, each performed in triplicate.
Figure 2
Figure 2
Immunofluorescence analysis of the effects of acute PE MNPs exposure on actin cytoskeleton architecture in BEAS-2B and A549 cells. (A) Representative IF acquisitions (N = 3) showing actin cytoskeleton of BEAS-2B and A549 cells treated with PE MNPs (PE 25 and PE 100) or untreated (UNT). F-Actin is stained in red with TRITC-Phalloidin and nuclei are stained in blue with DAPI. Bar: 10 μm. (B) Quantitative immunofluorescence analysis of TRITC-Phalloidin staining, expressed as the mean ± SD relative fluorescence unit per cell (RFU/cell). ns, not statistically significant; **, p < 0.01; ***, p < 0.001.
Figure 3
Figure 3
Modulation of mRNA expression levels of EMT markers after acute PE MNPs exposure in BEAS-2B cells. (AF) Bar graphs (N = 3) showing gene expression levels of the EMT markers Snail1 (A), Snail2 (B), Zeb1 (C), and of the epithelial/mesenchymal markers vimentin (D), N- cadherin (E), β4-Integrin (F) in BEAS-2B cells, treated for 24 h with PE MNPs (PE 25 and PE 100), compared to untreated cells (UNT). Results are expressed as mean value ± SD. ns, not statistically significant; *, p < 0.05; **, p < 0.01; ***, p < 0.001.
Figure 4
Figure 4
Modulation of mRNA expression levels of EMT markers after acute PE MNPs exposure in A549 cells. (AF) Bar graphs (N = 3) showing gene expression levels of the EMT markers Snail1 (A), Snail2 (B), Zeb1 (C), and of the epithelial/mesenchymal markers vimentin (D), N-cadherin (E), E-cadherin (F) in A549 cells, treated for 24 h with PE MNPs at low and high concentrations (PE 25 and PE 100), compared to untreated cells (UNT). Results are expressed as mean value ± SD. ns, not statistically significant; *, p < 0.05; **, p < 0.01; ***, p < 0.001.
Figure 5
Figure 5
Protein expression analysis of EMT markers after acute PE MNPs exposure in BEAS-2B and A549 cells. (AC) Representative Western blot analysis (N = 3) for the EMT markers vimentin (A), N-cadherin (B), β4-integrin (C) in BEAS-2B exposed to PE MNPs (PE 25 and PE 100) for 24 h, compared to untreated cells (UNT). HSP90 was used as loading control. Densitometric analysis was reported as relative expression with respect to untreated cells. Results are expressed as mean value ± SD. ns, not statistically significant; *, p < 0.05; **, p < 0.01. (DF) Representative Western blot analysis for the EMT markers vimentin (D), N-cadherin (E), E-Cadherin (F) in A549 exposed to 25 μg/mL and 100 μg/mL of PE MNPs (PE 25 and PE 100) for 24 h, compared to untreated cells (UNT). HSP90 was used as loading control. Densitometric analysis was reported as relative expression with respect to untreated cells. Results are expressed as mean value ± SD. ns, not statistically significant; *, p < 0.05; **, p < 0.01.
Figure 6
Figure 6
Rescue of PE MNPs-induced EMT phenotype in BEAS-2B cells. (A) Representative phase contrast images of BEAS-2B cells untreated (UNT) or treated with PE-MNPs (PE 25 and PE 100) for 24 h and then washed to remove PE-MNPs and cultured in standard medium for 24, 48, and 72 h. Bar: 20 μm. (BD) Bar graphs (N = 3) showing gene expression levels of the EMT marker Snail1 (B), and of the epithelial/mesenchymal markers vimentin (C) and β4-Integrin (D) in untreated BEAS-2B cells or treated with PE-MNPs for 24 h and after 24, 48, or 72 h of wash-out. Results are expressed as mean value ± SD. ns, not statistically significant; *, p < 0.05; **, p < 0.01; ***, p < 0.001 vs. treatment 24 h.
Figure 7
Figure 7
Rescue of PE-induced EMT phenotype in A549 cells. (A) Representative phase contrast images of A549 cells untreated (UNT) or treated with PE MNPs (PE 25 and PE 100) for 24 h, and then washed to remove PE-MNPs and cultured in standard media for 24, 48, and 72 h. Bar: 20 μm. (BD) Bar graphs (N = 3) showing gene expression levels of the EMT marker Snail1 (B), and of the epithelial/mesenchymal markers vimentin (C) and E-Cadherin (D) in untreated A549 cells or treated with PE MNPsfor 24 h, and after 24, 48, and 72 h of wash-out. Results are expressed as mean value ± SD. ns, not statistically significant; *, p < 0.05; **, p < 0.01; ***, p < 0.001 vs. treatment 24 h.
Figure 8
Figure 8
Effects of PE MNPs exposure on BEAS-2B and A549 migration and invasiveness abilities. (A) Representative images of scratch assay (N = 3) showing the effect of PE MNPs on BEAS-2B and A549 migration. Bar: 500 μm. The percentage of residual open area after 30 h of treatment with PE MNPs (PE 25 and PE 100), compared to that of untreated cells (UNT), was measured via ImageJ 1.54j software. Results are expressed as mean value ± SD. ns, not statistically significant; **, p < 0.01; ***, p < 0.001. (B) Representative images and quantification of transwell invasion assay (N = 3) on BEAS-2B and A549 treated with PE MNPs (PE 25 and PE 100) for 24 h or untreated (UNT). Migrated cells were stained with crystal violet. Bar: 100 μm. Invasiveness was calculated by counting the number of migrated cells as reported in the Material and Methods section. Results are expressed as mean value ± SD. ns, not statistically significant.

References

    1. Andrady A.L., Neal M.A. Applications and societal benefits of plastics. Philos. Trans. R. Soc. Lond. B Biol. Sci. 2009;364:1977–1984. doi: 10.1098/rstb.2008.0304. - DOI - PMC - PubMed
    1. Du H., Huang S., Wang J. Environmental risks of polymer materials from disposable face masks linked to the COVID-19 pandemic. Sci. Total Environ. 2022;815:152980. doi: 10.1016/j.scitotenv.2022.152980. - DOI - PMC - PubMed
    1. Gonçalves J.M., Bebianno M.J. Nanoplastics impact on marine biota: A review. Environ. Pollut. 2021;273:116426. doi: 10.1016/j.envpol.2021.116426. - DOI - PubMed
    1. Vethaak A.D., Legler J. Microplastics and human health. Science. 2021;371:672–674. doi: 10.1126/science.abe5041. - DOI - PubMed
    1. Landrigan P.J., Raps H., Cropper M., Bald C., Brunner M., Canonizado E.M., Charles D., Chiles T.C., Donohue M.J., Enck J., et al. The Minderoo-Monaco Commission on Plastics and Human Health. Ann. Glob. Health. 2023;89:23. doi: 10.5334/aogh.4056. - DOI - PMC - PubMed

MeSH terms

LinkOut - more resources