. 2024 Sep 23;25(18):10199.
doi: 10.3390/ijms251810199.

Downregulation of TASK-3 Channel Induces Senescence in Granulosa Cells of Bovine Cystic Ovarian Follicles

Affiliations

Downregulation of TASK-3 Channel Induces Senescence in Granulosa Cells of Bovine Cystic Ovarian Follicles

Chang-Woon Kim et al. Int J Mol Sci. .

Abstract

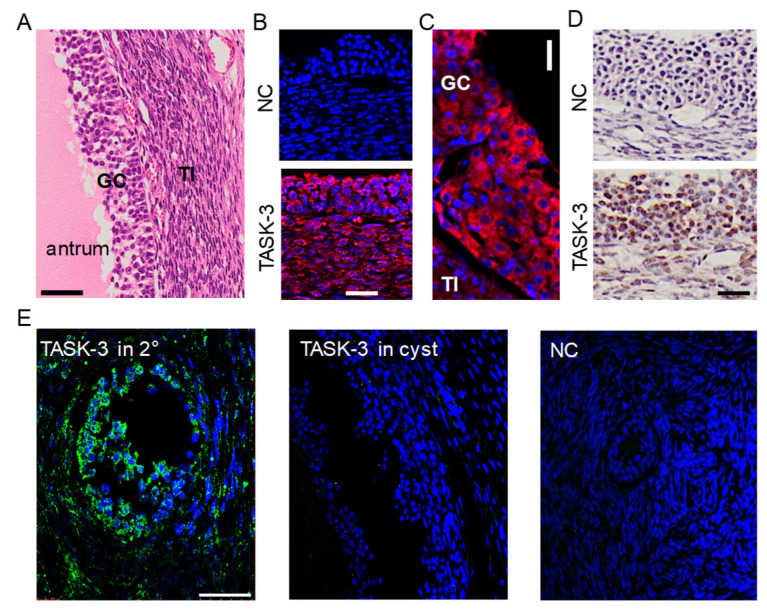
Ovarian cysts are linked to hormone imbalances and altered gene expressions, but the connection between cysts and ion channel expression is understudied. This study explored the role of TWIK-related acid-sensitive K+ (TASK) channels in bovine ovarian cyst formation. The ovarian follicles were split into small (5 to 10 mm in diameter) and large (>25 mm in diameter) groups. Among the measured K+, Na+, and Cl- concentrations in follicular fluid (FF) obtained from small-sized follicles (SFs) and large-sized follicles (LFs), the K+ concentration was significantly lower in LFFF. Quantitative PCR, Western blot, and immunocytochemistry data revealed that TASK-3 expression levels significantly decreased by approximately 50% in LFs and granulosa cells obtained from LFs (LFGCs) compared to the corresponding controls. The TASK-3 protein was localized to the plasma membranes of GCs. The diameters of LFGCs were larger than those of SFGCs. The cell swelling response to exposure to a hypotonic solution (200 mOsm/L) was highly reduced in TASK-3-overexpressing cells compared to vector-transfected cells. TASK-3-knockdown cells showed arrested growth. Senescence markers were detected in LFGCs and TASK-3-knockdown cells. These findings suggest that reduced TASK-3 expression in LFs is associated with the inhibition of GC growth, leading to senescence and cyst formation.

Keywords: TASK-3 channel; granulosa cell; ovarian cyst; potassium ion.


Conflict of interest statement

The authors declare no conflicts of interest. The funding sponsors had no role in the design of the study; in the collection, analysis, or interpretation of the data; in the writing of the manuscript; or in the decision to publish the results.

Figures

Figure 1
Figure 1
Hormone and ion concentrations in bovine ovarian follicular fluid obtained from small-sized and large-sized follicles. (A) The concentrations of 17β-estradiol (E2), progesterone (P4), and testosterone (Te). (B) The concentrations of K+, Na+, and Cl. Each bar represents the mean ± SD of five different samples. * Significant difference from the corresponding control value (p < 0.05). SFFF and LFFF denote follicular fluid obtained from small-sized (5 to 10 mm) and large-sized (>25 mm) follicles, respectively.
Figure 2
Figure 2
Downregulation of TASK-3 expression levels in bovine ovarian follicles and granulosa cells. (A) TASK-1 and TASK-3 mRNA expression in follicles (SFs and LFs) and GCs (SFGC and LFGC). TASK-1 (287 bp) and TASK-3 (433 bp). (B) Real-time PCR data for TASK-1 and TASK-3 in follicles and GCs. The expression levels were normalized to GAPDH. (C) Western blot analysis of TASK-1 and TASK-3 in SFGC and LFGC. The protein expression levels were normalized to α-tubulin. (D) TASK-3 immunofluorescence intensity in GCs. The GCs isolated from each ovary were cultured on a glass coverslip and subjected to immunostaining to detect the expression of TASK-3 within the cells. TASK-3 was immunostained with an anti-TASK-3 antibody and cyanine (Cy3)-conjugated anti-rabbit IgG (red). 4′,6′-diamidino-2-phenylindole (DAPI) was used for nuclear staining (blue). Each bar represents the mean ± SD of four different samples. * Significant difference from the corresponding control value (p < 0.05). Scale bar, 50 μm.
Figure 3
Figure 3
Expression of TASK-3 in granulosa cells. (A) H&E staining of a bovine ovary tissue section. GC and TI represent granulosa cells and theca interna, respectively. (B) Expression of TASK-3 in both GC and TI. Fluorescent images labeled with anti-TASK-3 antibody and cyanine (Cy3)-conjugated anti-rabbit IgG (orange/red). 4′,6′-diamidino-2-phenylindole (DAPI) was used for nuclear staining (blue). (C) An enlarged immunofluorescence image showing the TASK-3 channel (red) and DAPI staining for nuclei (blue). Scale bar, 10 μm. (D) TASK-3 expression in GC detected by DAB staining. (E) The immunofluorescence intensity of TASK-3 detected in follicles of different sizes. Green and blue indicate TASK-3 expression and nucleus stained with Alexa Fluor 488 and DAPI, respectively. The 2° and cyst labels correspond to secondary and cystic follicles, respectively. NC represents negative control, omitting anti-TASK-3 antibody. Scale bars, 50 μm.
Figure 4
Figure 4
Upregulation of senescence signals in LFGC. (A) Trypan blue-stained cells. The size of the cells was measured with a software ruler. (B) Calcium concentration in GCs. (C) ROS levels in GCs. RFU represents the relative fluorescence unit. (D) MDA concentration in GCs. The label referenced in (D) was common to (B,C). (E) Representative images stained with SA-β-gal. Images depict cells stained with SA-β-gal, which appear in dark cyan when stained. (F) Detection of p53 and p21 proteins. The expression levels were normalized to β-actin. Each bar represents the mean ± SD of four to six samples. * Significant difference from the corresponding control value (p < 0.05). Scale bars, 100 μm.
Figure 5
Figure 5
Volume regulation by the TASK-3 channel. (A) Activation of the TASK-3 channel by hypotonic solution. The whole-cell current of TASK-3 was responsive to the tonicity shift in the extracellular solution from 300 mOsm to 200 mOsm. (B) Summary of changes in TASK-3 currents upon applying a hypotonic solution. (C) Volume changes in response to a hypotonic solution. The volume changes were monitored by examining the time course of relative fluorescence. Bar graphs showed fluorescence intensity after a 6 min exposure to the hypotonic solution. Each bar represents the mean ± SD of four different samples. * Significant difference from the corresponding control value (p < 0.05). FI represents fluorescence intensity. F0 signifies the fluorescence intensity in an isotonic solution at time = 0. The ratio F0/Ft correlates with cell volume. Control refers to cells transfected with the pcDNA3.1 vector. The a.u. stands for an arbitrary unit. Isotonic and hypotonic solutions have tonicities of 300 mOsm and 200 mOsm, respectively.

References

    1. Peter A.T. An update on cystic ovarian degeneration in cattle. Reprod. Domest. Anim. 2004;39:1–7. doi: 10.1046/j.0936-6768.2003.00466.x. - DOI - PubMed
    1. Hamilton S.A., Garverick H.A., Keisler D.H., Xu Z.Z., Loos K., Youngquist R.S., Salfen B.E. Characterization of ovarian follicular cysts and associated endocrine profiles in dairy cows. Biol. Reprod. 1995;53:890–898. doi: 10.1095/biolreprod53.4.890. - DOI - PubMed
    1. Ortega H.H., Marelli B.E., Rey F., Amweg A.N., Diaz P.U., Stangaferro M.L., Salvetti N.R. Molecular aspects of bovine cystic ovarian disease pathogenesis. Reproduction. 2015;149:R251–R264. doi: 10.1530/REP-14-0618. - DOI - PubMed
    1. Salvetti N.R., Alfaro N.S., Velazquez M.M., Amweg A.N., Matiller V., Diaz P.U., Ortega H.H. Alteration in localization of steroid hormone receptors and coregulatory proteins in follicles from cows with induced ovarian follicular cysts. Reproduction. 2012;144:723–735. doi: 10.1530/REP-12-0188. - DOI - PubMed
    1. Rodriguez F.M., Colombero M., Amweg A.N., Huber E., Gareis N.C., Salvetti N.R., Ortega H.H., Rey F. Involvement of PAPP-A and IGFR1 in Cystic Ovarian Disease in Cattle. Reprod. Domest. Anim. 2015;50:659–668. doi: 10.1111/rda.12547. - DOI - PubMed

Substances

LinkOut - more resources