Review
. 2024 Sep 4;16(9):1165.
doi: 10.3390/pharmaceutics16091165.

Biological Evaluations and Computer-Aided Approaches of Janus Kinases 2 and 3 Inhibitors for Cancer Treatment: A Review

Affiliations
Review

Biological Evaluations and Computer-Aided Approaches of Janus Kinases 2 and 3 Inhibitors for Cancer Treatment: A Review

Lenci K Vázquez-Jiménez et al. Pharmaceutics. .

Abstract

Cancer remains one of the leading diseases of mortality worldwide. Janus kinases 2/3 (JAK2/3) have been considered a drug target for the development of drugs to treat different types of cancer. JAK2/3 play a critical role in innate immunity, inflammation, and hematopoiesis by mediating the signaling of numerous cytokines, growth factors, and interferons. The current focus is to develop new selective inhibitors for each JAK type. In this review, the current strategies of computer-aided studies, and biological evaluations against JAK2/3 are addressed. We found that the new synthesized JAK2/3 inhibitors are prone to containing heterocyclic aromatic rings such as pyrimidine, pyridine, and pyrazolo [3,4-d]pyrimidine. Moreover, inhibitors of natural origin derived from plant extracts and insects have shown suitable inhibitory capacities. Computer-assisted studies have shown the important features of inhibitors for JAK2/3 binding. Biological evaluations showed that the inhibition of the JAK receptor affects its related signaling pathway. Although the reviewed compounds showed good inhibitory capacity in vitro and in vivo, more in-depth studies are needed to advance toward full approval of cancer treatments in humans.

Keywords: JAK2; JAK3; anticancer; compounds.


Conflict of interest statement

The authors declare no conflicts of interest. The funders had no role in the design of the study; in the collection, analyses, or interpretation of the data; in the writing of the manuscript; or in the decision to publish the results.

Figures

Figure 1
Figure 1
Structure of the JAK2 kinase domain (PDB ID: 8BM2, JH1; 7F7W, JH2) (A) and domain structure of JAK2 (B). Magenta color indicates the JH2 domain, and green color represents the JH1 of JAK2. The 3D structure image was generated with PyMOL software v. 3.0.3 (https://www.pymol.org/).
Figure 2
Figure 2
Cys909 residue (sticks) in the JAK3 structure (PDB ID: 5TTV).
Figure 3
Figure 3
Chemical structures of heterosteroid derivatives 1 and 2 described by Mohamed et al. [52]. In the figure, the numbers in bold refer to the compounds described in the text, indicating their inhibitory values in distinct cancer cell lines. Figures were drawn and labeled with ChemDraw v. 19.0.
Figure 4
Figure 4
Chemical structure of the lead 4-piperazinyl-2-aminopyrimidine derivative described by Li et al. [53]. In the figure, the number in bold refers to the compound described in the text, indicating its inhibitory values in JAK2 and distinct cancer cell lines. The figure was drawn and labeled with ChemDraw v. 19.0.
Figure 5
Figure 5
Chemical structure of 1H-pyrazolo[3,4-d]pyrimidin-4-amino derivatives synthesized by Yin et al. [39]. In the figure, the numbers in bold refer to the compounds described in the text, indicating their inhibitory values in JAK2. Figures were drawn and labeled with ChemDraw v. 19.0.
Figure 6
Figure 6
Chemical structures of 2,4-disubstituted quinazoline derivatives synthesized by Jyothi-Buggana et al. [54]. In the figure, the numbers in bold refer to the compounds described in the text, indicating their inhibitory values in JAK2. Figures were drawn and labeled with ChemDraw v. 19.0.
Figure 7
Figure 7
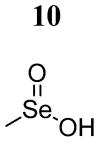
Chemical structure of methylseleninic acid (10). In the figure, the number in bold refers to the compound described in the text. The figure was drawn and labeled with ChemDraw v. 19.0.
Figure 8
Figure 8
Chemical structure of the lead 2-aminopyridine derivative evaluated by Ma et al. [58]. In the figure, the number in bold refers to the compound described in the text, indicating its inhibitory value in JAK2. The figure was drawn and labeled with ChemDraw v. 19.0.
Figure 9
Figure 9
Chemical structure of the 2-aminopyrimidine derivative analyzed by Li et al. [59]. In the figure, the number in bold refers to the compound described in the text, indicating its inhibitory values in JAK2 and cancer cell lines. The figure was drawn and labeled with ChemDraw v. 19.0.
Figure 10
Figure 10
Chemical structure of S-adenosylmethionine (13). In the figure, the number in bold refers to the compound described in the text, indicating its inhibitory values in distinct cancer cell lines over time. The figure was drawn and labeled with ChemDraw v. 19.0.
Figure 11
Figure 11
Chemical structure of 2-((5-nitrothiazol-2-yl)carbamoyl)phenyl acetate (14). In the figure, the number in bold refers to the compound described in the text, indicating its inhibitory values in a cancer cell line. The figure was drawn and labeled with ChemDraw v. 19.0.
Figure 12
Figure 12
Chemical structure of the 2-amino-4-aryl-6-(quinolin-2-ylthio)pyridine-3,5-dicarbonitrile derivatives synthesized by Nafie et al. [70]. In the figure, the numbers in bold refers to the compound described in the text, indicating their inhibitory values in distinct cancer cell lines. Figures were drawn and labeled with ChemDraw v. 19.0.
Figure 13
Figure 13
Chemical structure of the compound 1-nitro-2-acetylanthraquinone glycine (18). In the figure, the number in bold refers to the compound described in the text, indicating its inhibitory values in distinct cancer cell lines. The figure was drawn and labeled with ChemDraw v. 19.0.
Figure 14
Figure 14
Chemical structure of bufothionine (19). In the figure, the number in bold refers to the compound described in the text. The figure was drawn and labeled with ChemDraw v. 19.0.
Figure 15
Figure 15
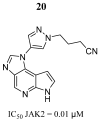
Chemical structure of the lead imidazopyrrolopyridine derivative evaluated by Xu et al. [74]. In the figure, the number in bold refers to the compound described in the text, indicating its inhibitory values in JAK2. The figure was drawn and labeled with ChemDraw v. 19.0.
Figure 16
Figure 16
Chemical structures of thiazole aromatic alkylamino analogs evaluated by Sanachai et al. [75]. In the figure, the numbers in bold refer to the compounds described in the text, indicating their inhibitory values in JAK2 and cancer cell lines. Figures were drawn and labeled with ChemDraw v. 19.0.
Figure 17
Figure 17
Chemical structure of compounds 23 and 24 analyzed by Newton et al. [76]. In the figure, the numbers in bold refer to the compounds described in the text, indicating their inhibitory values in JAK2. Figures were drawn and labeled with ChemDraw v. 19.0.
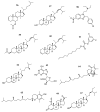
Figure 18
Figure 18
Chemical structure of the 3β-acetoxy-5α-androstane derivative evaluated by Tantawy et al. [77]. In the figure, the number in bold refers to the compound described in the text, indicating its inhibitory values in a cancer cell line. The figure was drawn and labeled with ChemDraw v. 19.0.
Figure 19
Figure 19
Chemical structure of compound 26 identified by in silico methods as a potential JAK2 inhibitor by Singh et al. [78]. In the figure, the number in bold refers to the compound described in the text. The figure was drawn and labeled with ChemDraw v. 19.0.
Figure 20
Figure 20
Chemical structure of compounds 27, 28, and 29 identified by computational techniques as potential JAK2 inhibitors by He et al. [79]. In the figure, the numbers in bold refer to the compounds described in the text. Figures were drawn and labeled with ChemDraw v. 19.0.
Figure 21
Figure 21
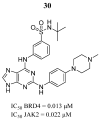
Chemical structure of the leading 9H-purine-2,6-diamine derivative obtained by Guo et al. [80]. In the figure, the number in bold refers to the compound described in the text, indicating its inhibitory values in BRD4 and JAK2 proteins. The figure was drawn and labeled with ChemDraw v. 19.0.
Figure 22
Figure 22
Chemical structures of the macrocycles synthesized by Diao et al. [81]. In the figure, the numbers in bold refer to the compounds described in the text, indicating their inhibitory values in JAK2 and distinct cancer cell lines. Figures were drawn and labeled with ChemDraw v. 19.0.
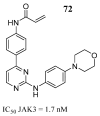
Figure 23
Figure 23
Compounds 33, 34, and 35 evaluated by Virtanen et al. [28]. In the figure, the numbers in bold refer to the compounds described in the text, indicating their inhibitory values in JAK2 and distinct cancer cell lines. Figures were drawn and labeled with ChemDraw v. 19.0.
Figure 24
Figure 24
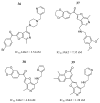
Chemical structures of the selected compounds based on furopyridine. In the figure, the numbers in bold refer to the compounds described in the text, indicating their inhibitory values in JAK2. Figures were drawn and labeled with ChemDraw v. 19.0.
Figure 25
Figure 25
Chemical structures selected as potential JAK2 inhibitors through drug repositioning by Yasir et al. [83]. In the figure, the numbers in bold refer to the compounds described in the text. Figures were drawn and labeled with ChemDraw v. 19.0.
Figure 26
Figure 26
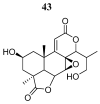
Chemical structure of 3-deoxy-2β, 16-dihydroxynagilactone E (43). In the figure, the number in bold refers to the compound described in the text. The figure was drawn and labeled with ChemDraw v. 19.0.
Figure 27
Figure 27
Chemical structure of 2-deoxy-4β-propylcarbamate-pulchelin (44). In the figure, the number in bold refers to the compound described in the text. The figure was drawn and labeled with ChemDraw v. 19.0.
Figure 28
Figure 28
Chemical structure of compounds 45 and 46 selected from a virtual screening by Li W et al. [75]. In the figure, the numbers in bold refer to the compounds described in the text. Figures were drawn and labeled with ChemDraw v. 19.0.
Figure 29
Figure 29
Chemical structure of Rosmanol (47). In the figure, the number in bold refers to the compound described in the text, indicating its inhibitory values in distinct cancer cell lines. The figure was drawn and labeled with ChemDraw v. 19.0.
Figure 30
Figure 30
Chemical structure of triptolide (48). In the figure, the number in bold refers to the compound described in the text. The figure was drawn and labeled with ChemDraw v. 19.0.
Figure 31
Figure 31
Chemical structure of proanthocyanidins (49). In the figure, the number in bold refers to the compound described in the text. The figure was drawn and labeled with ChemDraw v. 19.0.
Figure 32
Figure 32
Chemical structure of licochalcone H (50). In the figure, the number in bold refers to the compound described in the text. The figure was drawn and labeled with ChemDraw v. 19.0.
Figure 33
Figure 33
Chemical structure of the natural products evaluated by Pölläniemi et al. [7]. In the figure, the numbers in bold refer to the compounds described in the text, indicating their inhibitory values in JAK2. Figures were drawn and labeled with ChemDraw v. 19.0.
Figure 34
Figure 34
Chemical structure of compound 55 identified through high-throughput virtual screening as a potential JAK2 inhibitor by Shaikh et al. [93]. In the figure, the number in bold refers to the compound described in the text, indicating its inhibitory value in JAK2. The figure was drawn and labeled with ChemDraw v. 19.0.
Figure 35
Figure 35
Chemical structures of compounds obtained from natural products (Upreti et al.) [94]. In the figure, the numbers in bold refer to the compounds described in the text. Figures were drawn and labeled with ChemDraw v. 19.0.
Figure 36
Figure 36
Chemical structures of the natural compounds analyzed by Vaziri-Amjad et al. [95]. In the figure, the numbers in bold refer to the compounds described in the text. Figures were drawn and labeled with ChemDraw v. 19.0.
Figure 37
Figure 37
Chemical structure of the pyrimidine-4,6-diamine derivative as a selective JAK3 inhibitor described by Yu et al. [96]. In the figure, the number in bold refers to the compound described in the text, indicating its inhibitory value in JAK3. The figures was drawn and labeled with ChemDraw v. 19.0.
Figure 38
Figure 38
Chemical structure of the phenylpyrimidine derivative analyzed by Shu et al. [20] as a potential JAK3 inhibitor. In the figure, the number in bold refers to the compound described in the text, indicating its inhibitory value in JAK3. The figures was drawn and labeled with ChemDraw v. 19.0.
Figure 39
Figure 39
Chemical structure of the 1H-pyrrolo [2,3-b]pyridine derivative evaluated on JAK3 by Forster et al. [17]. In the figure, the number in bold refers to the compound described in the text, indicating its inhibitory value in JAK3. Figures were drawn and labeled with ChemDraw v. 19.0.
Figure 40
Figure 40
Chemical structure of 3-(4-phenyl-1H-imidazol-2-yl)-1H-pyrazole derivatives synthesized and evaluated by Zheng et al. [97]. In the figure, the numbers in bold refer to the compounds described in the text, indicating their inhibitory values in JAK3 and distinct cancer cell lines. Figures were drawn and labeled with ChemDraw v. 19.0.
Figure 41
Figure 41
Chemical structure of the pyrido [2,3-d]pyrimidin-7-one derivative synthesized as a potential JAK3 inhibitor by Su et al. [21]. In the figure, the number in bold refers to the compound described in the text, indicating its inhibitory value in JAK3 and a cancer cell line. The figure was drawn and labeled with ChemDraw v. 19.0.
Figure 42
Figure 42
Chemical structure of hybrid and chimeric derivatives of 4,5-dihydro-4,4-dimethyl-1H-[1,2]dithiolo [3,4-c]quinoline-1-thiones obtained as potential JAK3 inhibitors by Medvedeva et al. [98]. In the figure, the numbers in bold refer to the compounds described in the text, indicating their inhibitory values in JAK3 Figures were drawn and labeled with ChemDraw v. 19.0.
Figure 43
Figure 43
Chemical structure of the potential JAK3 inhibitor identified by structure-based high-throughput virtual screening by Wei et al. [99]. In the figure, the number in bold refers to the compound described in the text, indicating its inhibitory values in JAK3 and cancer cell lines. The figures was drawn and labeled with ChemDraw v. 19.0.
Figure 44
Figure 44
Chemical structures of compounds 82–85 identified as potential JAK3 inhibitors using predictive techniques by Faris et al. [100]. In the figure, the numbers in bold refer to the compounds described in the text. Figures were drawn and labeled with ChemDraw v. 19.0.
Figure 45
Figure 45
Chemical structure of the compounds selected as potential JAK3/STAT inhibitors based on the pyrimidine-4,6-diamine structure by Faris et al. [101]. In the figure, the numbers in bold refer to the compounds described in the text. Figures were drawn and labeled with ChemDraw v. 19.0.
Figure 46
Figure 46
Chemical structure of Chinses herbal compounds analyzed by Su et al. [102]. In the figure, the numbers in bold refer to the compounds described in the text. Figures were drawn and labeled with ChemDraw v. 19.0.
Figure 47
Figure 47
Chemical structure of natural products from B. japanensis analyzed by Yan et al. [103] as potential JAK3 inhibitors. In the figure, the number in bold refers to the compound described in the text, indicating its inhibitory values in JAK3 and distinct cancer cell lines. The figures was drawn and labeled with ChemDraw v. 19.0.
Figure 48
Figure 48
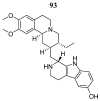
Chemical structure of tubulosin (93). In the figure, the number in bold refers to the compound described in the text. Figures were drawn and labeled with ChemDraw v. 19.0.
Figure 49
Figure 49
Chemical structure of the compounds selected by Sanachai et al. [49] from pharmacophore models built from the commercial drug tofacitinib. In the figure, the numbers in bold refer to the compounds described in the text, indicating their inhibitory values in JAK2 and JAK3. Figures were drawn and labeled with ChemDraw v. 19.0.
Figure 50
Figure 50
Chemical structure of the lead compound (97) identified as a potential quinoxalinone-based dual JAK2/3 inhibitor by Sanachai et al. [105]. In the figure, the number in bold refers to the compound described in the text, indicating their inhibitory values in JAK2 and JAK3, and distinct cancer cell lines. Figures were drawn and labeled with ChemDraw v. 19.0.
Figure 51
Figure 51
Chemical structures of naphthoquinones identified as potential JAK2/3 inhibitors by Sanachai et al. [106]. In the figure, the numbers in bold refer to the compounds described in the text, indicating their inhibitory values in JAK2 and JAK3, and distinct cancer cell lines. Figures were drawn and labeled with ChemDraw v. 19.0.

References

    1. Bose S., Banerjee S., Mondal A., Chakraborty U., Pumarol J., Croley C.R., Bishayee A. Targeting the JAK/STAT Signaling Pathway Using Phytocompounds for Cancer Prevention and Therapy. Cells. 2020;11:1451. doi: 10.3390/cells9061451. - DOI - PMC - PubMed
    1. Jemal A., Siegel R., Xu J., Ward E. Cancer statistics. CA Cancer J. Clin. 2010;60:277–300. doi: 10.3322/caac.20073. - DOI - PubMed
    1. Leonard W.J., O’Shea J.J. Jaks and STATs: Biological implications. Annu. Rev. Immunol. 1998;16:293–322. doi: 10.1146/annurev.immunol.16.1.293. - DOI - PubMed
    1. Ihle J.N., Witthuhn B.A., Quelle F.W., Yamamoto K., Silvennoinen O. Signaling through the hematopoietic cytokine receptors. Annu. Rev. Immunol. 1995;13:369–398. doi: 10.1146/annurev.iy.13.040195.002101. - DOI - PubMed
    1. Hammarén H.M., Virtanen A.T., Raivola J., Silvennoinen O. The regulation of JAKs in cytokine signaling and its breakdown in disease. Cytokine. 2019;118:48–63. doi: 10.1016/j.cyto.2018.03.041. - DOI - PubMed

LinkOut - more resources