

Modeling UV/Vis Absorption Spectra of Food Colorants in Solution: Anthocyanins and Curcumin as Case Studies
- PMID: 39339373
- PMCID: PMC11434053
- DOI: 10.3390/molecules29184378
Modeling UV/Vis Absorption Spectra of Food Colorants in Solution: Anthocyanins and Curcumin as Case Studies
Abstract
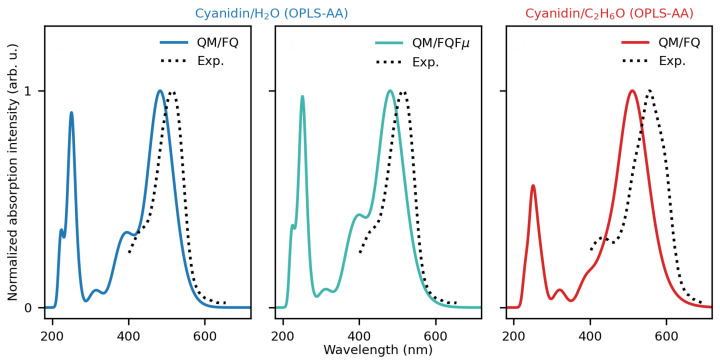
We present a comprehensive computational study of UV/Vis absorption spectra of significant food colorants, specifically anthocyanins and curcumin tautomers, dissolved in polar protic solvents, namely water and ethanol. The absorption spectra are simulated using two fully polarizable quantum mechanical (QM)/molecular mechanics (MM) models based on the fluctuating charge (FQ) and fluctuating charge and dipoles (FQFμ) force fields. To accurately capture the dynamical aspects of the solvation phenomenon, atomistic approaches are combined with configurational sampling obtained through classical molecular dynamics (MD) simulations. The calculated QM/FQ and QM/FQFμ spectra are then compared with experiments. Our findings demonstrate that a precise reproduction of the UV/Vis spectra of the studied pigments can be achieved by adequately accounting for configurational sampling, polarization effects, and hydrogen bonding interactions.
Keywords: MD; QM/MM; UV/Vis; absorption spectrum; anthocyanins; curcumin; food colorants.
Conflict of interest statement
The authors declare no conflicts of interest.
Figures


References
-
- Reichardt C., Welton T. Solvents and Solvent Effects in Organic Chemistry. John Wiley & Sons; Hoboken, NJ, USA: 2011.
-
- Reichardt C. Solvatochromic dyes as solvent polarity indicators. Chem. Rev. 1994;94:2319–2358. doi: 10.1021/cr00032a005. - DOI
-
- Reichardt C. Solvatochromism, thermochromism, piezochromism, halochromism, and chiro-solvatochromism of pyridinium N-phenoxide betaine dyes. Chem. Soc. Rev. 1992;21:147–153. doi: 10.1039/cs9922100147. - DOI
-
- Perkampus H.H. UV-VIS Spectroscopy and Its Applications. Springer Science & Business Media; Berlin/Heidelberg, Germany: 2013.
-
- Antonov L., Nedeltcheva D. Resolution of overlapping UV–Vis absorption bands and quantitative analysis. Chem. Soc. Rev. 2000;29:217–227. doi: 10.1039/a900007k. - DOI
LinkOut - more resources
Full Text Sources
