. 2024 Sep 21;13(18):2651.
doi: 10.3390/plants13182651.

Biochemical and Epigenetic Regulation of Glutamate Metabolism in Maize (Zea mays L.) Leaves under Salt Stress

Affiliations

Biochemical and Epigenetic Regulation of Glutamate Metabolism in Maize (Zea mays L.) Leaves under Salt Stress

Alexander T Eprintsev et al. Plants (Basel). .

Abstract

The effect of salt stress (150 mM NaCl) on the expression of genes, methylation of their promoters, and enzymatic activity of glutamate dehydrogenase (GDH), glutamate decarboxylase (GAD), and the 2-oxoglutarate (2-OG)-dehydrogenase (2-OGDH) complex was studied in maize (Zea mays L.). GDH activity increased continuously under salt stress, being 3-fold higher after 24 h. This was accompanied by the appearance of a second isoform with lower electrophoretic mobility. The expression of the Gdh1 gene strongly increased after 6-12 h of incubation, which corresponded to the demethylation of its promoter, while Gdh2 gene expression slightly increased after 2-6 h and then decreased. GAD activity gradually increased in the first 12 h, and then returned to the control level. This corresponded to the increase of Gad expression and its demethylation. Salt stress led to a 2-fold increase in the activity of 2-OGDH during the first 6 h of NaCl treatment, then the activity returned to the control level. Expression of the genes Ogdh1 and Ogdh3 peaked after 1-2 h of incubation. After 6-8 h with NaCl, the expression of these genes declined below the control levels, which correlated with the higher methylation of their promoters. We conclude that salt stress causes a redirection of the 2-OG flux to the γ-aminobutyric acid shunt via its amination to glutamate, by altering the expression of the Gdh1 and Gdh2 genes, which likely promotes the assembly of the native GDH molecule having a different subunit composition and greater affinity for 2-OG.

Keywords: 2-oxoglutarate dehydrogenase; NaCl; Zea mays L.; glutamate dehydrogenase; mitochondria; promoter methylation; salt stress; tricarboxylic acid cycle.


Conflict of interest statement

The authors declare no conflicts of interest.

Figures
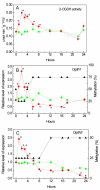
Figure 1
Figure 1
Effect of salt stress on the operation of the 2-oxoglutarate dehydrogenase (2-OGDH) complex. Changes in the activity of the 2-OGDH complex (A), in the relative levels of transcripts and the fraction of methylation of promoters (black triangles) of the genes Ogdh1 (B) and Ogdh3 (C) in maize leaves in the course of incubation of maize plants in 150 mM NaCl (red circles) as compared to the control plants (green squares). The data represent the means of three biological repeats ± SD. Statistically significant differences in activity and expression as compared to the control (p ≤ 0.05) are shown by stars.
Figure 2
Figure 2
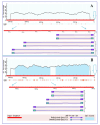
Results of analysis of the promoters of the genes Ogdh1 (A) and Ogdh3 (B) of Zea mays for the presence of CpG islands. Vertical lines indicate the positions of CpG dinucleotides. The outlined arrows indicate the position of the start codon. Thin blue arrows show the change of scale to outline the region used for designing three groups (I, II, III) of primers to the different CpG dinucleotides.
Figure 3
Figure 3
Effect of salt stress on glutamate dehydrogenase activity and expression in maize leaves. Changes in the activity of glutamate dehydrogenase (GDH) (A), in the relative levels of transcripts and the fraction of methylation of promoters (black triangles) of the genes Gdh1 (B) and Gdh2 (C) in maize leaves in the course of incubation of maize plants in 150 mM NaCl (red circles) as compared to the control plants (green squares). The data represent the means of three biological repeats ± SD. Statistically significant differences in activity and expression as compared to the control (p ≤ 0.05) are shown by stars.
Figure 4
Figure 4
Effect of salt stress on the isoenzyme composition of GDH in maize leaves. PAGE electropherogram of GDH from maize leaves under salt stress: 0, 1, 6, 12, 24—incubation time in the NaCl solution (hours); P1, P2—protein bands representing native GDH protein molecules (isoenzymes) stained by the tetrazolium method; and F—dye front.
Figure 5
Figure 5
Results of analysis of the promoters of the genes Gdh1 (A) and Gdh2 (B) of Zea mays for the presence of CpG islands. Vertical lines indicate the positions of CpG dinucleotides. The outlined arrows indicate the position of the start codon. Thin blue arrows show the change of scale to outline the region used for designing three groups (I, II, III) of primers to the different CpG dinucleotides.
Figure 6
Figure 6
Effect of salt stress on glutamate decarboxylase (GAD) activity and expression in maize leaves. Changes in the total enzymatic activity of GAD (A), and in the relative levels of transcripts and the fraction of methylation of the promoters (black triangles) of the gene Gad (B) in maize leaves in the course of incubation of maize plants in 150 mM NaCl (red circles) as compared to the control plants (green squares). The data represent the means of three biological repeats ± SD. Statistically significant differences in activity and expression as compared to the control (p ≤ 0.05) are shown by stars.
Figure 7
Figure 7
Analysis of Gad gene promoters of Zea mays for the presence of CpG islands. Vertical lines indicate the positions of CpG dinucleotides. The outlined arrow indicates the position of the start codon. Thin blue arrows show the change of scale to outline the region used for designing three groups (I, II, III) of primers to the different CpG dinucleotides.
Figure 8
Figure 8
Regulation of glutamate metabolism in plant cells under salt stress. Abbreviations: TCA cycle, tricarboxylic acid cycle; 2-OG, 2-oxoglutarate; OGDH, 2-oxoglutarate dehydrogenase complex; GDH1 and GDH2, polypeptides encoded by the Gdh1 and Gdh2 genes, respectively; Glu, glutamate; GABA, γ-aminobutyric acid; SSA, succinic acid semialdehyde; Suc, succinate. Salt stress affects plant cell metabolism in two stages: 1. During the first 6 h of salt stress, 2-OGDH activity increases, while GDH, due to the induction of Gdh2 gene expression, acts as a supplier of 2-OG, the source of which is glutamate (red arrow). 2. After 6 h, 2-OGDH is inhibited, GDH redirects the flow of 2-OG to glutamate due to the induction of the Gdh1 gene, 2-OG is converted into glutamate, which is used for the synthesis of GABA (blue arrow). −CH3 indicates the methylation of gene promoter.

References

    1. Jacoby R.P., Taylor N.L., Millar A.H. The role of mitochondrial respiration in salinity tolerance. Trends Plant Sci. 2011;16:614–623. doi: 10.1016/j.tplants.2011.08.002. - DOI - PubMed
    1. Schwarzländer M., Fricker M.D., Sweetlove L.J. Monitoring the in vivo redox state of plant mitochondria: Effect of respiratory inhibitors, abiotic stress and assessment of recovery from oxidative challenge. Biochim. Biophys. Acta. 2009;1787:468–475. doi: 10.1016/j.bbabio.2009.01.020. - DOI - PubMed
    1. Robertson R.N., Wilkins M. Quantitative Relation between Salt Accumulation and Salt Respiration in Plant Cells. Nature. 1948;161:101. doi: 10.1038/161101a0. - DOI - PubMed
    1. Bandehagh A., Taylor N.L. Can alternative metabolic pathways and shunts overcome salinity-induced inhibition of central carbon metabolism in crops? Front. Plant Sci. 2020;11:1072. doi: 10.3389/fpls.2020.01072. - DOI - PMC - PubMed
    1. Møller I.M., Igamberdiev A.U., Bykova N.V., Finkemeier I., Rasmusson A.G., Schwarzländer M. Matrix Redox Physiology Governs the Regulation of Plant Mitochondrial Metabolism through Posttranslational Protein Modifications. Plant Cell. 2020;32:573–594. doi: 10.1105/tpc.19.00535. - DOI - PMC - PubMed

LinkOut - more resources