. 2024 Sep 11;16(18):3068.
doi: 10.3390/nu16183068.

Effect of a Phytochemical-Rich Olive-Derived Extract on Anthropometric, Hematological, and Metabolic Parameters

Affiliations

Effect of a Phytochemical-Rich Olive-Derived Extract on Anthropometric, Hematological, and Metabolic Parameters

Anna Aiello et al. Nutrients. .

Abstract

Background: Extra virgin olive oil is a fundamental component of the Mediterranean diet. It contains several molecules that sustain human well-being by modulating cellular metabolism and exerting antioxidant, anti-inflammatory, and anti-ageing effects to protect normal tissues, and it can exert anti-angiogenic and pro-apoptotic effects on cancer cells. Metabolites found in different parts of the olive tree, including leaves, also possess properties that might help in cancer prevention and promote wellness in aging. Olive mill wastewater (OMWW), a liquid residue produced during olive oil extraction, represents an environmental issue. However, it is rich in phytochemicals with potential beneficial properties. Dietary supplements based on OMWW can be produced for nutritional supplementation with advantages to the ecology.

Purpose: This work aims to measure hematochemical, anthropometric, and metabolomic parameters in volunteers taking an OMWW dietary supplement, Oliphenolia® (OMWW-OL).

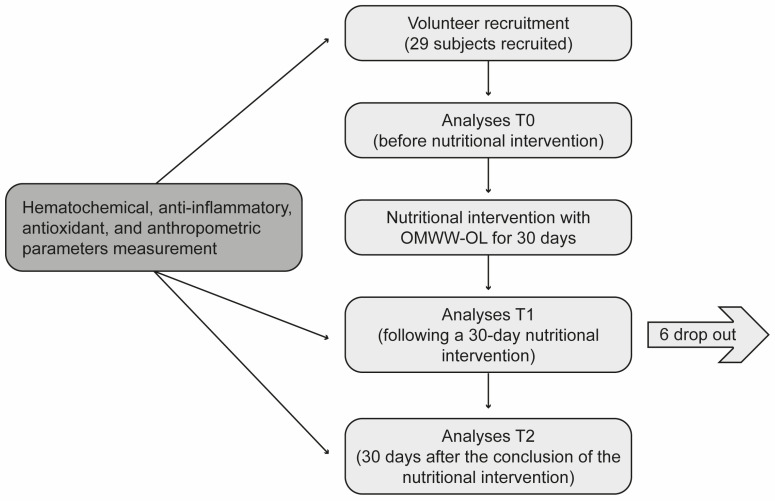
Methods: The supplementation of OMWW-OL 25 mL twice daily for 30 days was tested on a pilot cohort of volunteers with characteristics close to metabolic syndrome. Hematochemical, anthropometric, serum biomarkers and serum metabolomic parameters were analyzed before the intervention, at 30 days, and 30 days after stopping consumption.

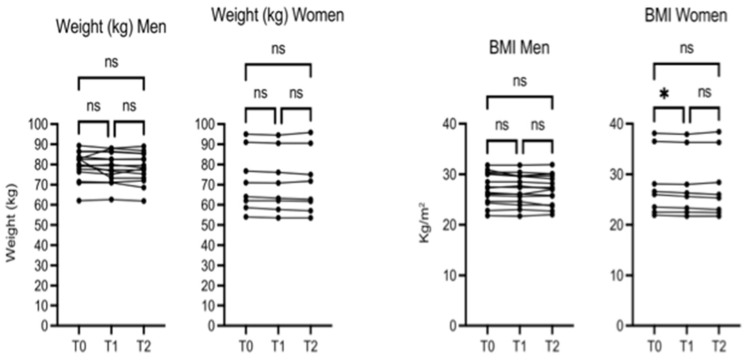
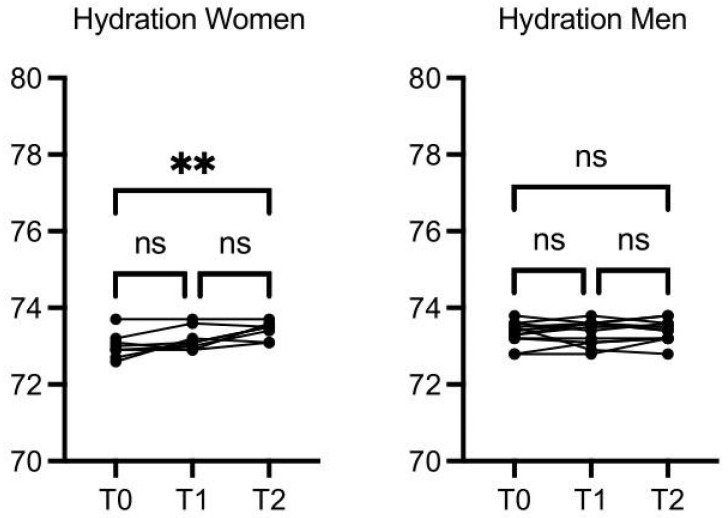
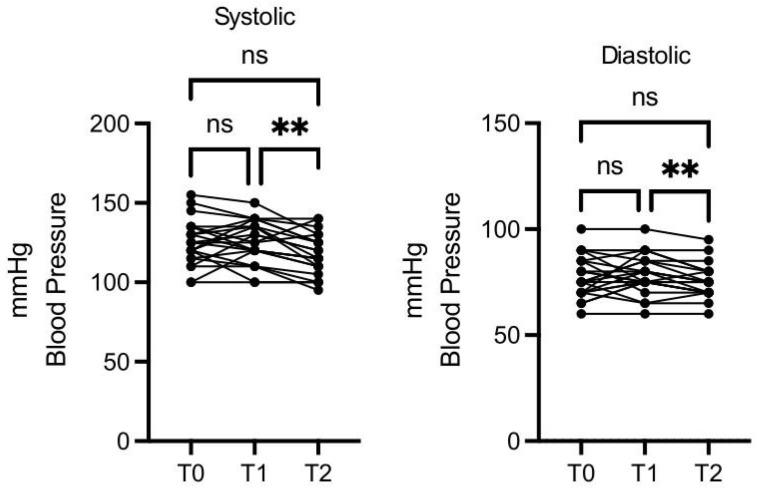
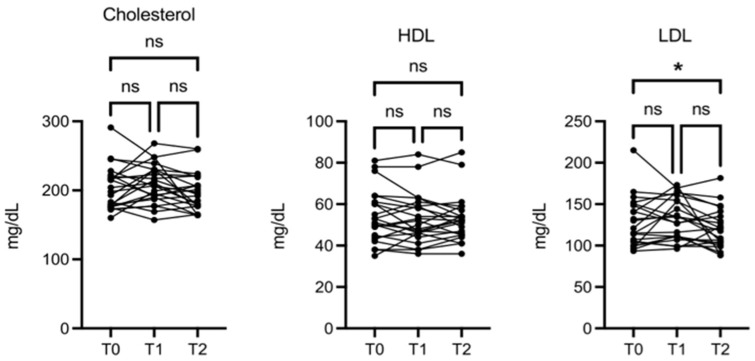
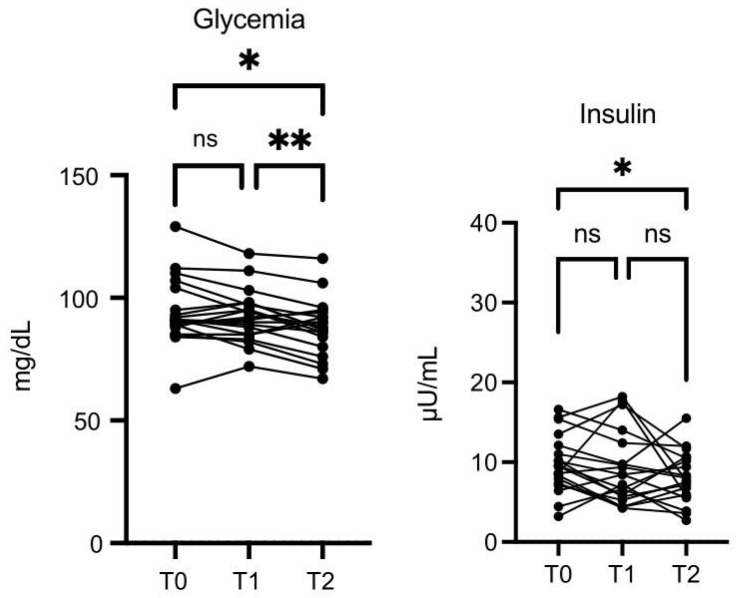
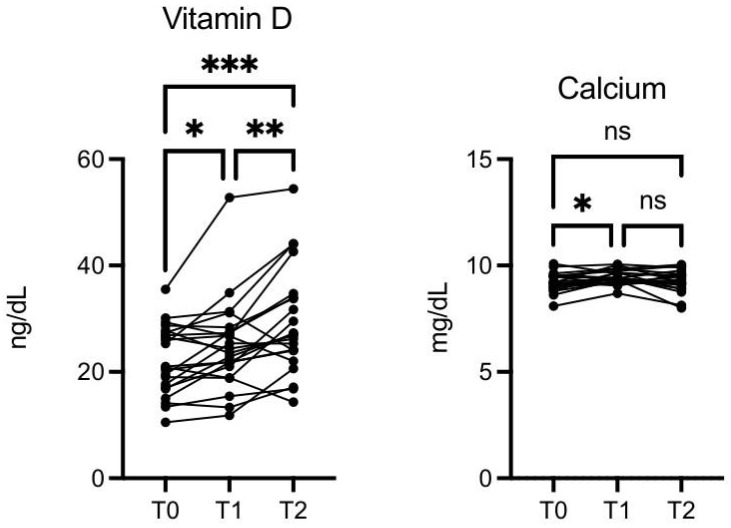
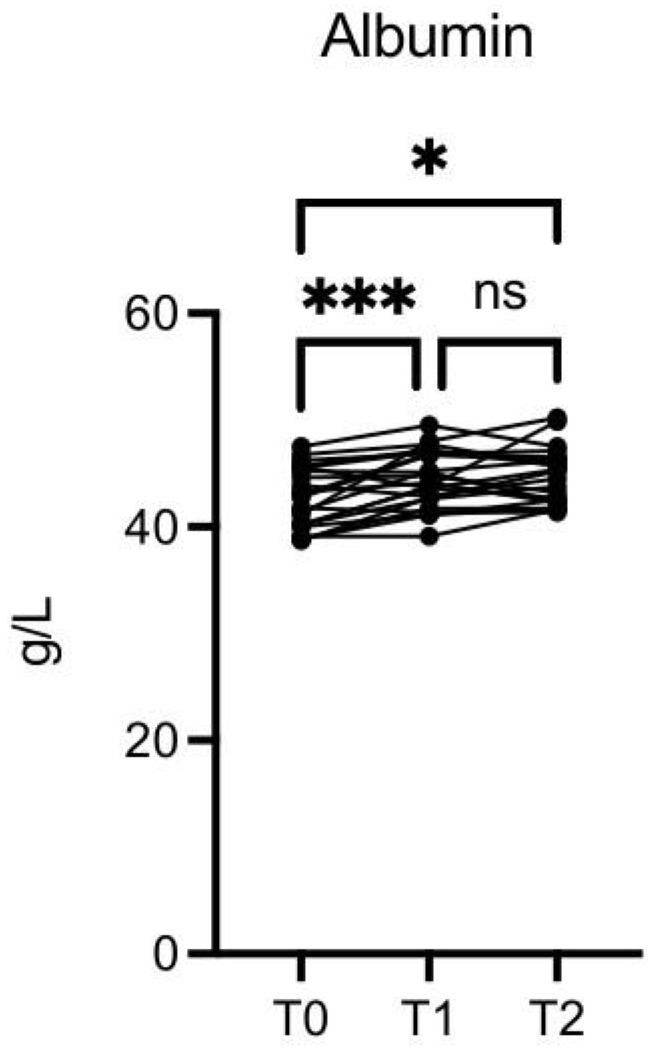
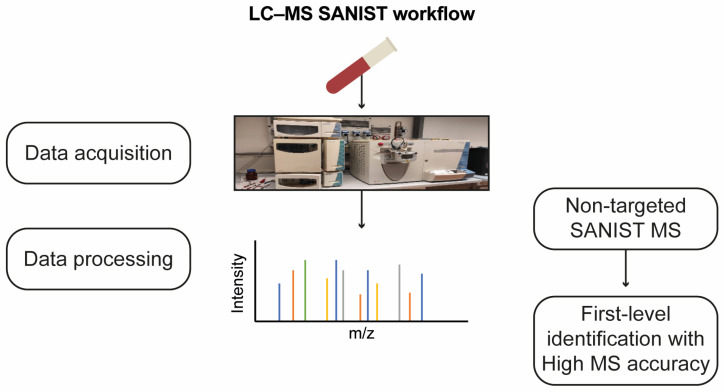
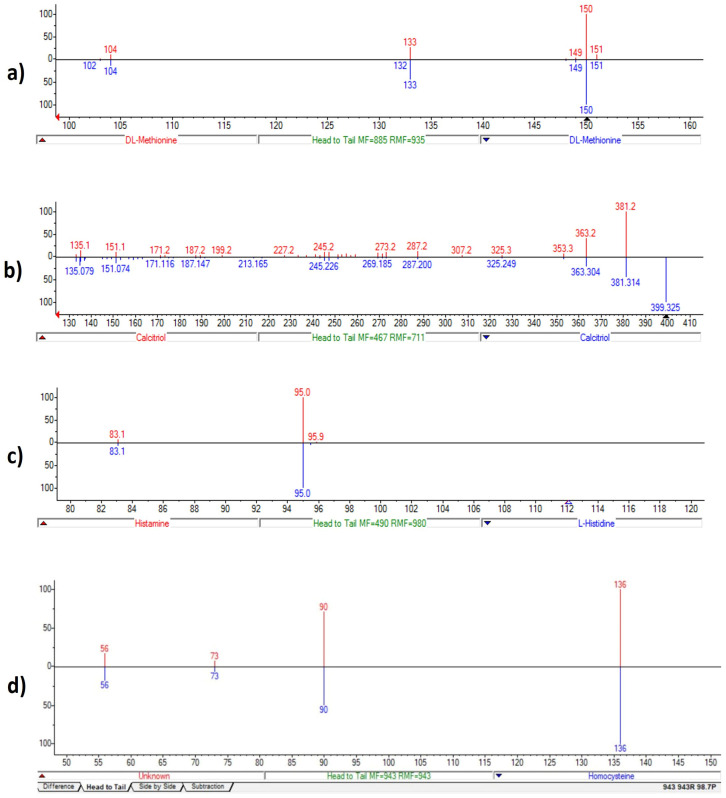
Results: A total of 29 volunteers were enrolled, and 23 completed the study. The participants' parameters at baseline were measured, and then twice daily at 30 days of treatment and 30 days after assumption discontinuation. Although treatment was with an olive derivative, their weight did not increase. Their body mass index, instead of augmenting, slightly decreased, particularly in the women. Also, hydration increased, especially in the women, while blood pressure, glycemia, and insulin decreased. Cholesterol, high-density lipoproteins, and triglycerides were stable, and LDL levels decreased, while vitamin D levels, alongside calcium, perceptibly increased. Albumin also increased. All the values were in support of an equilibrium, with no damaging effects. By mass spectrometry analysis, we also found favorable changes in the vitamin D/histamine and homocysteine/methionine ratios, an increase in a new metabolite of unknown formula, and the vitamin D/unknown metabolite ratio.

Conclusions: Supplementation of OMWW-OL has no detrimental effects and might imply the beneficial modulation of several biological parameters. Although this is a small pilot study, with limited potency, it preliminarily suggests that the OMWW extract use could be potentially valuable for people at risk of metabolic syndrome. Some of these parameters could also be relevant in supporting healthy ageing and in cancer prevention.

Keywords: antiaging; antioxidants; cancer; extra virgin olive oil; metabolic syndrome; olive mill wastewater; phytochemicals; polyphenols.


Conflict of interest statement

The authors declare that the research was conducted in the absence of any commercial or financial relationships that could be construed as potential conflicts of interest.

Figures

Figure 1
Figure 1
The flowchart of the study design. The study protocol was approved by the Ethics Committee. During a 7-day washout period, the participants were required to abstain from extra virgin olive oil and food supplements containing polyphenols. The nutritional intervention consisted of the consumption of the Oliphenolia® dietary supplement preparation (25 mL) twice a day, 30 min before the main meals (lunch and dinner), for 30 days, with no other restriction from the usual diet.
Figure 2
Figure 2
OMWW-OL consumption effects on weight and BMI in volunteers. The images show the single values at T0, T1, and T2. There were no differences in the men’s weight and BMI values; in the women, the BMI showed a slight decrease at 30 days (T1), returning to the value of T0 after 60 days (T2). The Y-axis reports the values of the analyzed biomarker. Statistics are performed in comparison between the average of T0/T1 ± SEM, T1/T2 ± SEM, T0/T2 ± SEM. * p < 0.05, ns: non-significant.
Figure 3
Figure 3
OMWW-OL consumption effects on hydration in volunteers. The images show the single values at T0, T1, and T2. In the women, hydration is increased at T2 vs. T0, while no significant differences were observed in the men. The Y-axis reports the values of the analyzed biomarker. Statistics are performed in comparison between the average of T0/T1 ± SEM, T1/T2 ± SEM T0/T2 ± SEM. ** p < 0.01, ns: non-significant.
Figure 4
Figure 4
OMWW-OL consumption effects on blood pressure in volunteers. The images show the single values at T0, T1, and T2. Blood pressure values decreased significantly at T2 vs. T1, both in the maximum and minimum values. The Y-axis reports the values of the analyzed biomarker. Statistics are performed in comparison between the average of T0/T1 ± SEM, T1/T2 ± SEM, T0/T2 ± SEM. ** p < 0.01, ns: non-significant.
Figure 5
Figure 5
OMWW-OL consumption effects on cholesterol in volunteers. The images show the single values at T0, T1, and T2. There were no significant differences in total cholesterol and HDL, while the LDL decreased slightly but statistically significantly. The Y-axis reports the values of the analyzed biomarker. Statistics are performed in comparison between the average of T0/T1 ± SEM, T1/T2 ± SEM T0/T2 ± SEM. * p < 0.05, ns: non-significant.
Figure 6
Figure 6
OMWW-OL assumption effects on glycemia and insulin in volunteers. The images show the single values at T0, T1, and T2. Glycemia values decreased at T2 vs. T0, and at T2 vs. T1. Insulin was also decreased at T2 vs. T0. The Y-axis reports the values of the analyzed biomarker. Statistics are performed in comparison between the average of T0/T1 ± SEM, T1/T2 ± SEM T0/T2 ± SEM. * p < 0.05, ** p < 0.01, ns: non-significant.
Figure 7
Figure 7
OMWW-OL consumption effects on vitamin D and calcium in volunteers. The images show the single values at T0, T1, and T2. Vitamin D increases following OMWW intake in a statistically significant manner both at T1 and T2. Calcium was increased at T1 vs. T0. The Y-axis reports the values of the analyzed biomarker. Statistics are performed in comparison between the average of T0/T1 ± SEM, T1/T2 ± SEM T0/T2 ± SEM. * p < 0.05, ** p < 0.01, *** p < 0.001, ns: non-significant.
Figure 8
Figure 8
OMWW-OL consumption effects on free thyroid hormones (FT3 and FT4) in volunteers. The images show the single values at T0, T1, and T2. The FT3 level was increased significantly at T1 vs. T0 and at T2 vs. T0, while FT4 was significantly higher at T1 vs. T0. The Y-axis reports the values of the analyzed biomarker. Statistics are performed in comparison between the average of T0/T1 ± SEM, T1/T2 ± SEM T0/T2 ± SEM. * p < 0.05, ** p < 0.01, **** p < 0.0001, ns: non-significant.
Figure 9
Figure 9
OMWW-OL consumption effects on albumin in volunteers. The images show the single values at T0, T1, and T2. The albumin values increase significantly at T1 vs. T0 and T2 vs. T0. The Y-axis reports the values of the analyzed biomarker. Statistics are performed in comparison between the average of T0/T1 ± SEM, T1/T2 ± SEM T0/T2 ± SEM. * p < 0.05, *** p < 0.001, ns: non-significant.
Figure 10
Figure 10
Workflow for non-targeted LC-MS SANIST metabolites profiling.
Figure 11
Figure 11
Biomarkers detected by NIST MS Search Program. Tandem mass spectra (MS/MS) library similarity match obtained by LC-MS data using NIST database: D-L-Methionine profile (a); Calcitriol (1α,25-dihydroxyvitamin D3) profile (b); Histamine profile (c), and Homocysteine profile (d).

References

    1. Jimenez-Lopez C., Carpena M., Lourenço-Lopes C., Gallardo-Gomez M., Lorenzo J.M., Barba F.J., Prieto M.A., Simal-Gandara J. Bioactive Compounds and Quality of Extra Virgin Olive Oil. Foods. 2020;9:1014. doi: 10.3390/foods9081014. - DOI - PMC - PubMed
    1. Therdyothin A., Prokopidis K., Galli F., Witard O.C., Isanejad M. The Effects of Omega-3 Polyunsaturated Fatty Acids on Muscle and Whole-Body Protein Synthesis: A Systematic Review and Meta-Analysis. Nutr. Rev. 2024:nuae055. doi: 10.1093/nutrit/nuae055. - DOI - PMC - PubMed
    1. Lanza B., Ninfali P. Antioxidants in Extra Virgin Olive Oil and Table Olives: Connections between Agriculture and Processing for Health Choices. Antioxidants. 2020;9:41. doi: 10.3390/antiox9010041. - DOI - PMC - PubMed
    1. Flynn M.M., Tierney A., Itsiopoulos C. Is Extra Virgin Olive Oil the Critical Ingredient Driving the Health Benefits of a Mediterranean Diet? A Narrative Review. Nutrients. 2023;15:2916. doi: 10.3390/nu15132916. - DOI - PMC - PubMed
    1. Rossi M., Caruso F., Kwok L., Lee G., Caruso A., Gionfra F., Candelotti E., Belli S.L., Molasky N., Raley-Susman K.M., et al. Protection by Extra Virgin Olive Oil against Oxidative Stress In Vitro and In Vivo. Chemical and Biological Studies on the Health Benefits Due to a Major Component of the Mediterranean Diet. PLoS ONE. 2017;12:e0189341. doi: 10.1371/journal.pone.0189341. - DOI - PMC - PubMed

LinkOut - more resources