. 2024 Sep 17;16(18):3138.
doi: 10.3390/nu16183138.

The Impact of Yoyo Dieting and Resistant Starch on Weight Loss and Gut Microbiome in C57Bl/6 Mice

Affiliations

The Impact of Yoyo Dieting and Resistant Starch on Weight Loss and Gut Microbiome in C57Bl/6 Mice

Kate Phuong-Nguyen et al. Nutrients. .

Abstract

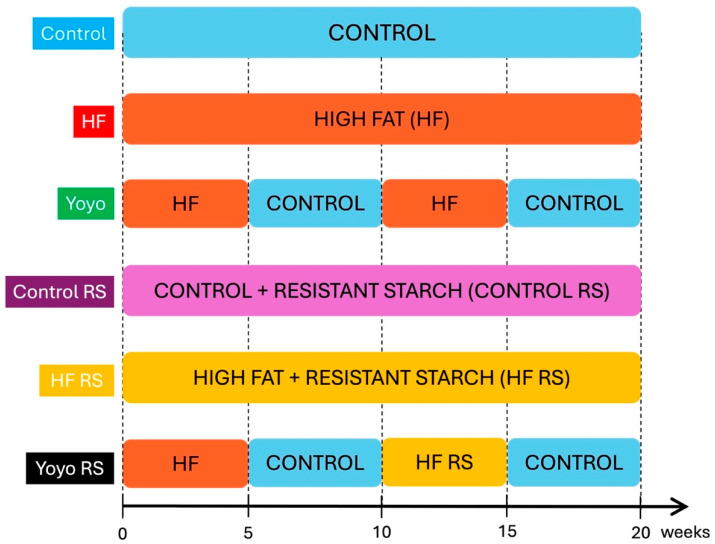
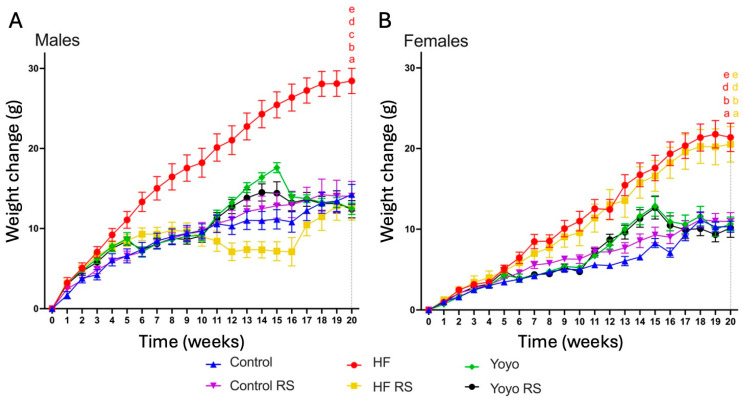
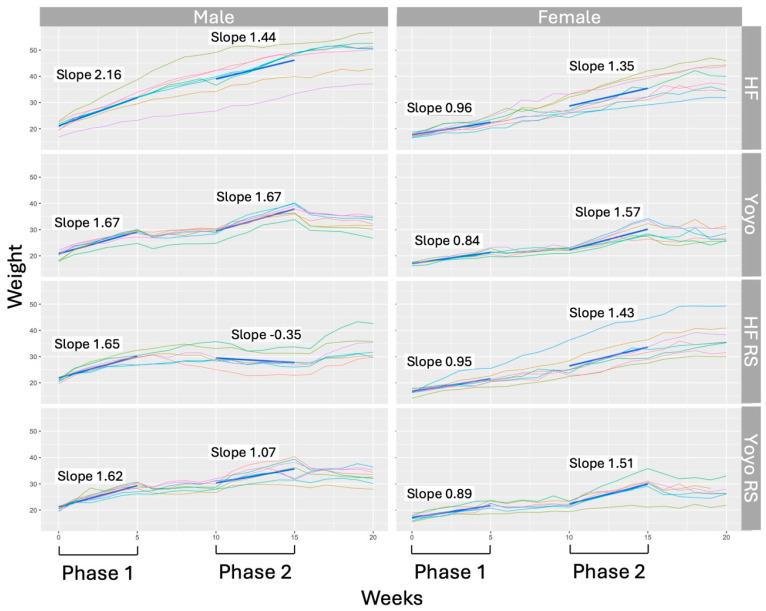
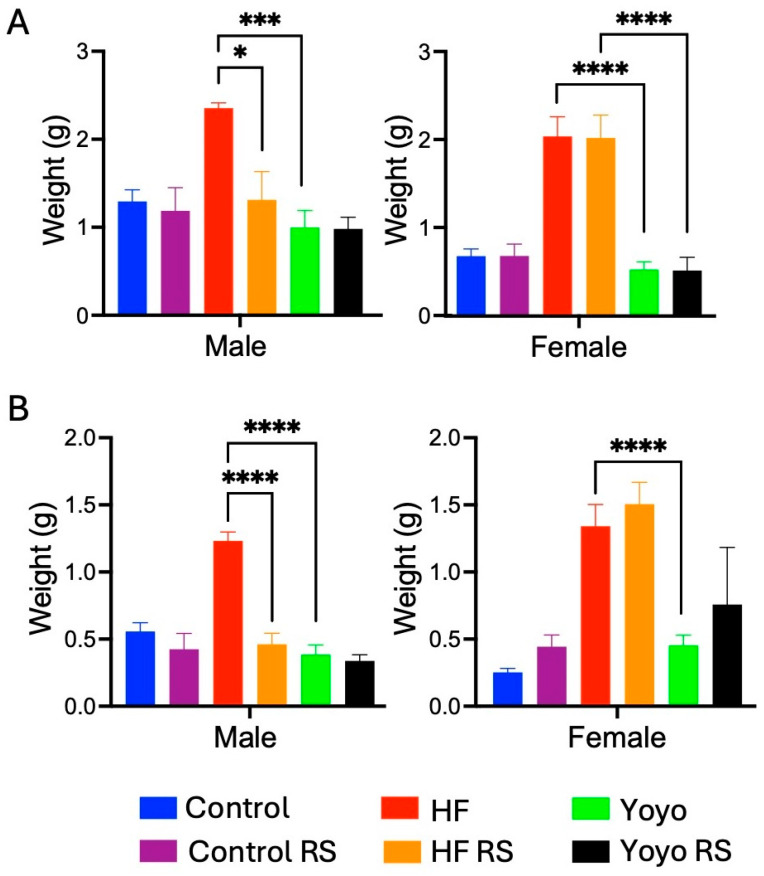
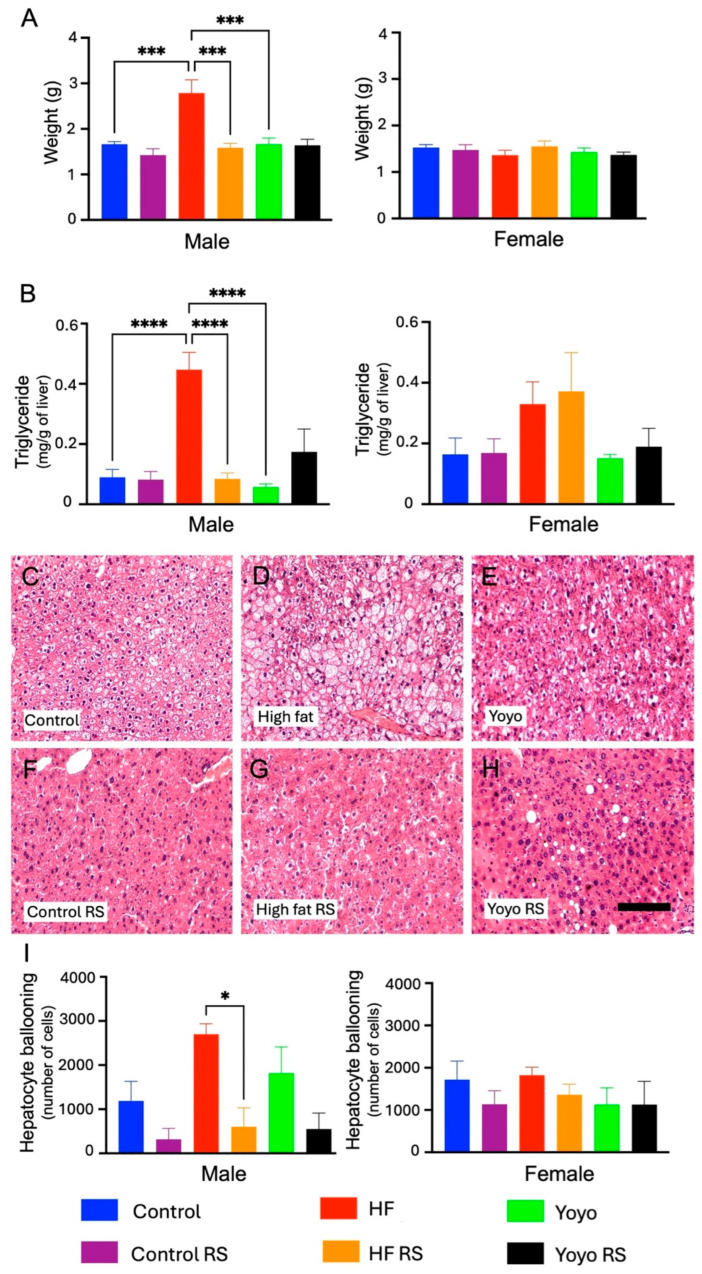
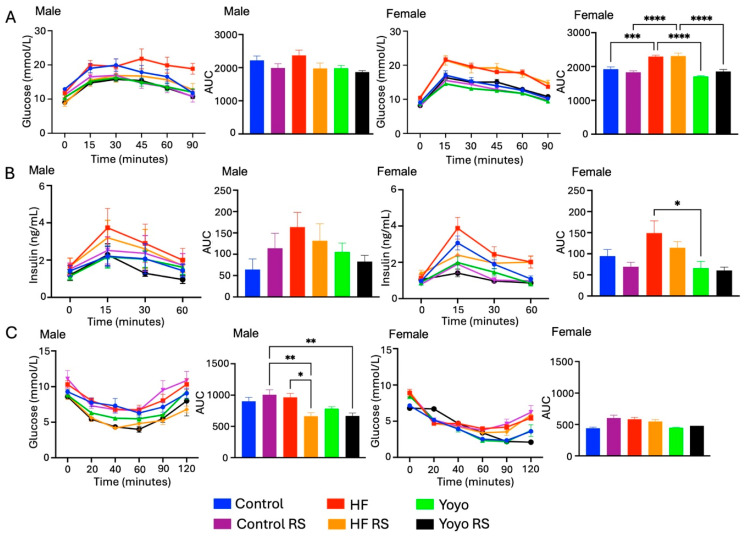
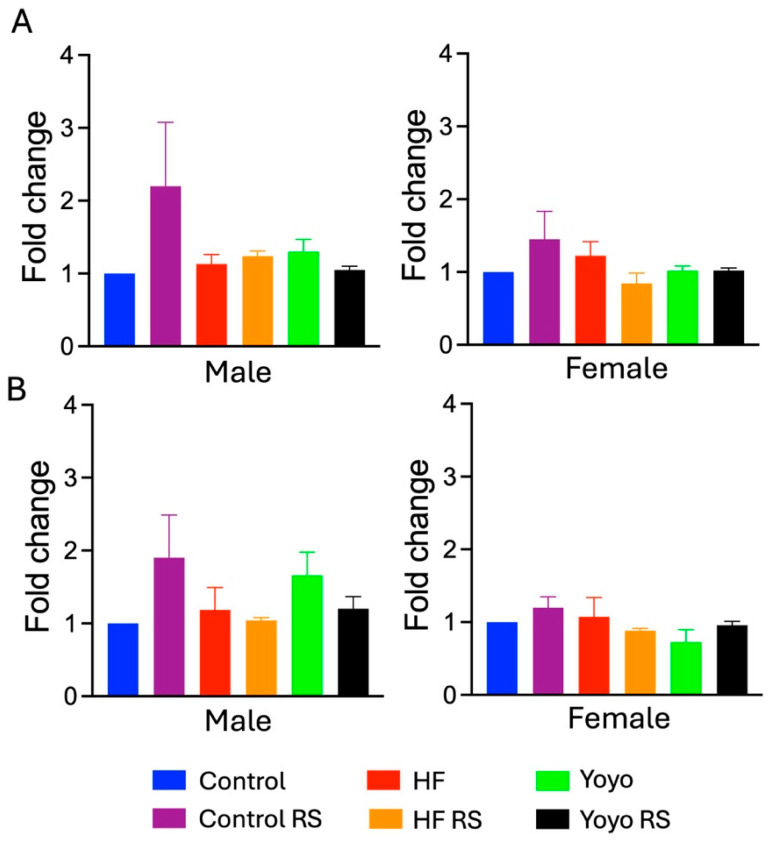
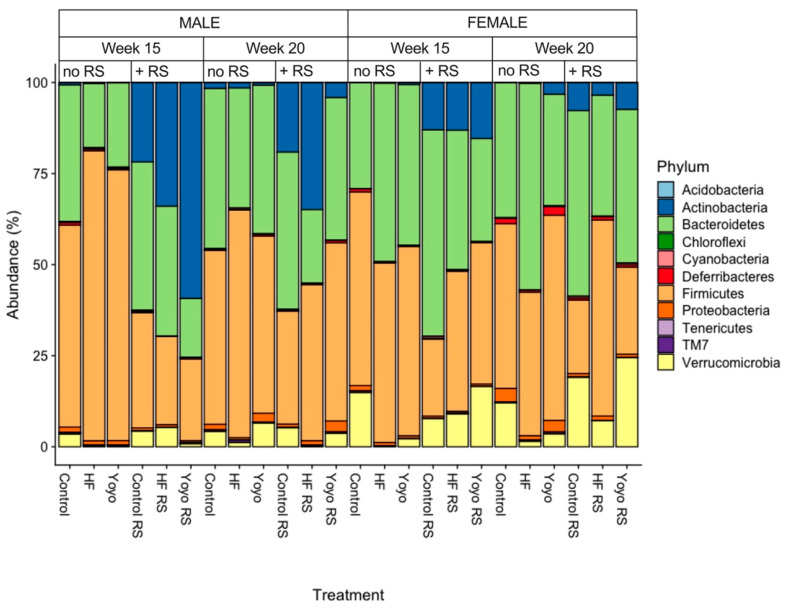
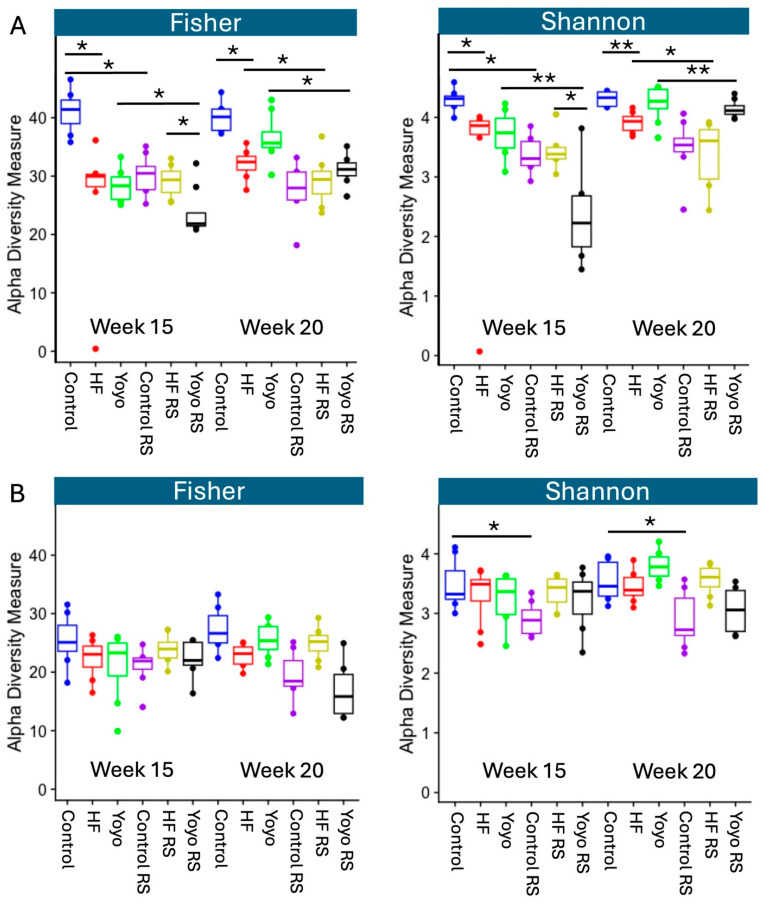
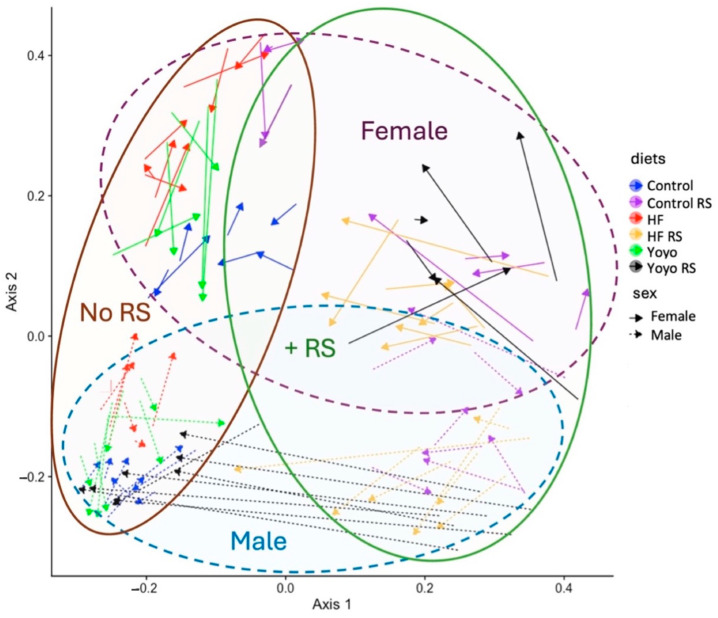
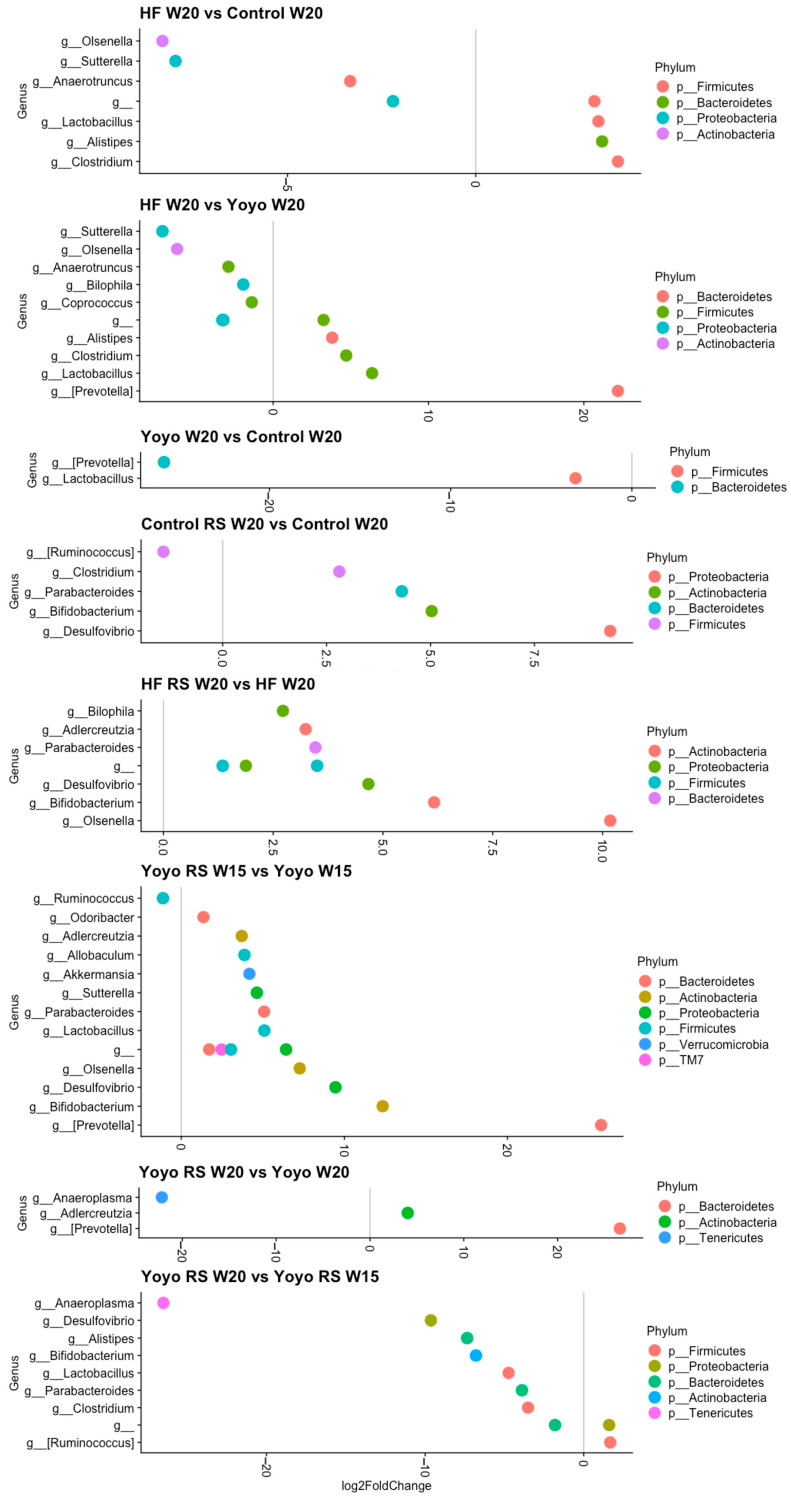
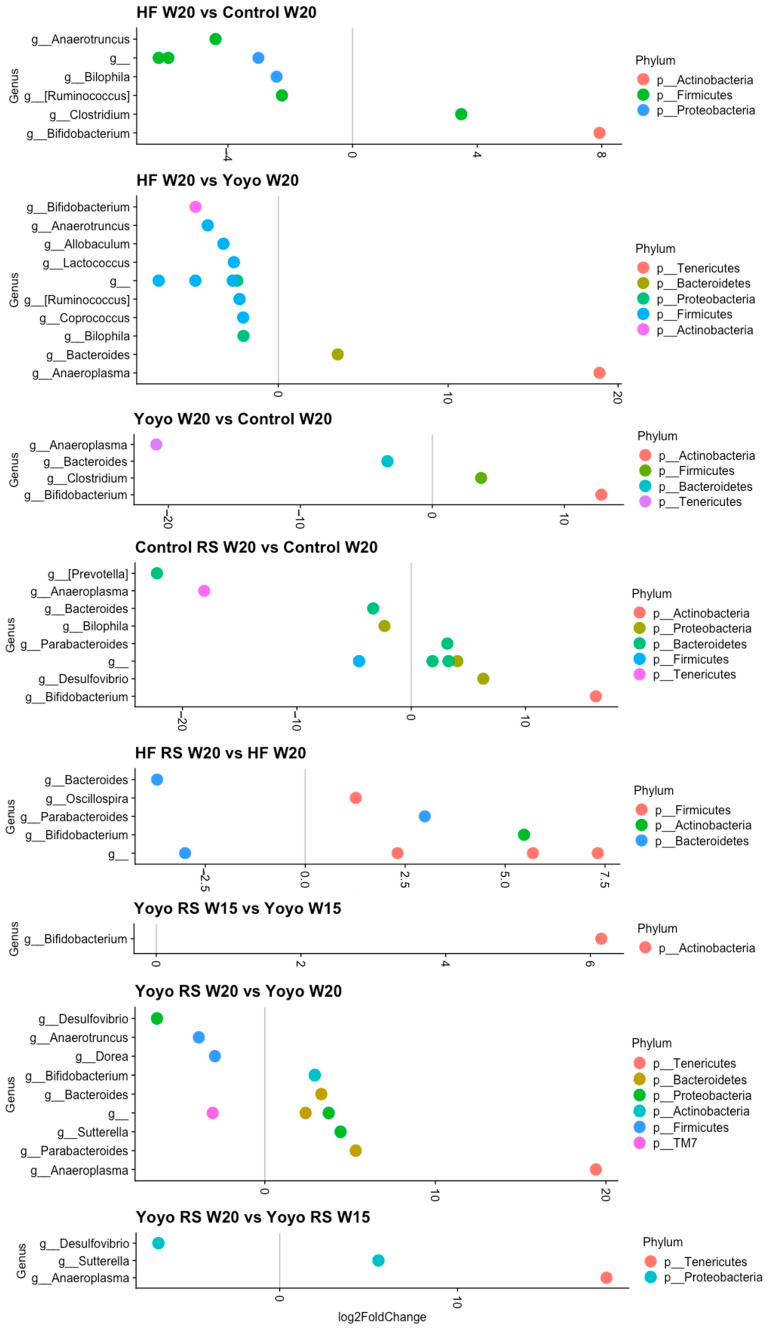
Cyclic weight loss and subsequent regain after dieting and non-dieting periods, a phenomenon termed yoyo dieting, places individuals at greater risk of metabolic complications and alters gut microbiome composition. Resistant starch (RS) improves gut health and systemic metabolism. This study aimed to investigate the effect of yoyo dieting and RS on the metabolism and gut microbiome. C57BL/6 mice were assigned to 6 diets for 20 weeks, including control, high fat (HF), yoyo (alternating HF and control diets every 5 weeks), control with RS, HF with RS, and yoyo with RS. Metabolic outcomes and microbiota profiling using 16S rRNA sequencing were examined. Yoyo dieting resulted in short-term weight loss, which led to improved liver health and insulin tolerance but also a greater rate of weight gain compared to continuous HF feeding, as well as a different microbiota profile that was in an intermediate configuration between the control and HF states. Mice fed HF and yoyo diets supplemented with RS gained less weight than those fed without RS. RS supplementation in yoyo mice appeared to shift the gut microbiota composition closer to the control state. In conclusion, yoyo dieting leads to obesity relapse, and increased RS intake reduces weight gain and might help prevent rapid weight regain via gut microbiome restoration.

Keywords: fatty liver; gut microbiome; metabolism; obesity; resistant starch; short-chain fatty acid; weight cycling; yoyo dieting.


Conflict of interest statement

M.O’H. has a financial interest in Prevatex Pty Ltd., a company developing probiotic-based biotherapeutics. Other authors declare no conflicts of interest.

Figures

Figure 1
Figure 1
Diet treatments. Male and female mice were exposed to 6 diets for 20 weeks, including combinations of control and high-fat (HF) diets with and without resistant starch (RS).
Figure 2
Figure 2
Body weight change in male (A) and female mice (B). Weight change of mice fed control (blue), HF (red), yoyo (green), control RS (purple), HF RS (yellow), and yoyo RS (black) diets. RS supplemented in an HF diet (HF RS) significantly lowered body weight change in male mice compared to an HF diet alone, but no significant difference was observed in female mice. n = 7–8/group/sex; statistic at week 20 p ≤ 0.05 versus a control, b control RS, c HF RS, d yoyo, and e yoyo RS mice. HF—high fat; RS—resistant starch.
Figure 3
Figure 3
Rate of weight regain of male and female mice in high-fat and yoyo groups, supplemented with and without resistant starch, during two non-restricted (high-fat) feeding periods: Phase 1 (weeks 0–5) and Phase 2 (10–15). The weight of each animal is represented by an individual coloured line. The difference in the rate of weight gain between the 2 phases was identified as the difference in the average slopes of the same-coloured lines in Phase 1 and Phase 2. Bold blue solid lines indicate the average rate of weight gain/loss in Phase 1 and Phase 2 per diet group, respectively. In male mice, across the two HF feeding phases, yoyo mice had a significantly greater rate of weight gain compared to HF mice. RS supplementation in HF and yoyo diets (HF RS and yoyo RS) resulted in significantly lower rates of weight gain compared to diets supplemented with no RS. In female mice, across the two HF feeding phases, HF and yoyo mice had similar rates of weight gain. RS supplementation did not affect the rate of weight gain in female mice. HF—high-fat diet; RS—resistant starch.
Figure 4
Figure 4
Fat mass. Gonadal fat (A). Perirenal fat (B). RS supplemented in an HF diet (HF RS) resulted in a significant reduction in fat mass in male mice compared to an HF diet alone, but no significant difference was observed in female mice. * p ≤ 0.05, *** p ≤ 0.001, **** p ≤ 0.0001, with n = 7–8/group/sex.
Figure 5
Figure 5
Indices of liver health. Liver mass (A). Liver triglycerides (B). Hepatocyte ballooning images of male mice using haematoxylin and eosin staining (CH). Hepatocyte ballooning (I). RS supplementation in an HF diet (HF RS) significantly improved the liver health of male mice compared to an HF diet only, but no significant difference was observed in female mice. * p ≤ 0.05, *** p ≤ 0.001, **** p ≤ 0.0001, n = 7–8/group/sex. Scale bar = 150 µm. RS: resistant starch.
Figure 6
Figure 6
Metabolic measurements. Blood glucose during an oral glucose tolerance test (A). Plasma insulin during an oral glucose tolerance test (B). Blood glucose during an insulin tolerance test (C). RS supplementation in an HF diet (HF RS) resulted in a significantly improved insulin tolerance in male mice compared to an HF diet alone, but no significant difference was observed in female mice. * p ≤ 0.05, ** p ≤ 0.01, *** p ≤ 0.001, and **** p ≤ 0.0001 used to determine significance, with n = 7–8/group/sex. AUC: area under the curve.
Figure 7
Figure 7
Short-chain fatty acid levels. n-Butyrate (A). Propionate (B). No change in SCFA levels across diet groups. n = 7–8/group/sex.
Figure 8
Figure 8
Relative abundance. Stacked column charts representing the relative abundance of amplicon sequence variants (ASVs) at the taxonomic level of the phylum. The visualisation of ASV data displays the gut microbiota of male and female mice consuming 6 different diets in weeks 15 and 20. Diets supplemented with RS were associated with a higher relative abundance of Actinobacteria. HF: high fat. RS: resistant starch.
Figure 9
Figure 9
Alpha diversity. Fisher’s and Shannon’s diversity indices of faecal samples of male (A) and female mice (B) in week 15 and week 20. The median is illustrated by the horizontal line inside the box. The lowest and highest values within 1.5 times the interquartile range from the 1st and 3rd quartiles, respectively, are illustrated by whiskers. * p ≤ 0.05, ** p ≤ 0.01, with n = 6–8/group/sex. Boxes represent the interquartile range between the first and third quartiles. The horizontal line inside the box illustrates the median. Solid dots (●) outside the whiskers indicate greater than 1.5 times and less than 3 times the interquartile range. Graphs were generated from raw and untrimmed data. HF—high-fat diet; RS—resistant starch.
Figure 10
Figure 10
Principal coordinate analysis (PCoA)—beta diversity. Bray–Curtis ordination plot showing the dissimilarity of the gut microbiota from mice fed six different diets at two time points (weeks 15 and 20). The microbiota profiles of different dietary treatments are represented by different colours: blue (control), purple (control RS), red (HF), yellow (HF RS), green (yoyo), and black (yoyo RS). Solid arrows represent female mice, and arrows with dashed lines represent male mice. The tail of an arrow indicates microbiota composition in week 15, while the tip of an arrow indicates microbiota composition in week 20. RS—resistant starch; HF—high fat.
Figure 11
Figure 11
Differentially abundant genera in male mice. Only genera that were significantly different in relative abundance (FDR ≤ 0.01) are shown in the plot, with log2FoldChange estimated by DESeq2. RS—resistant starch; HF—high fat; W—week.
Figure 12
Figure 12
Differentially abundant genera in female mice. Only genera that were significantly different in relative abundance (FDR ≤ 0.01) are shown in the plot, with log2FoldChange estimated by DESeq2. RS—resistant starch; HF—high fat; W—week.

Similar articles

Cited by

References

    1. Sarwer D.B., Polonsky H.M. The Psychosocial Burden of Obesity. Endocrinol. Metab. Clin. N. Am. 2016;45:677–688. doi: 10.1016/j.ecl.2016.04.016. - DOI - PMC - PubMed
    1. World Health Organization . Obesity: Preventing and Managing the Global Epidemic. World Health Organization; Geneva, Switzerland: 2000. - PubMed
    1. O’Brien P.D., Hinder L.M., Callaghan B.C., Feldman E.L. Neurological consequences of obesity. Lancet Neurol. 2017;16:465–477. - PMC - PubMed
    1. Blüher M. Obesity: Global epidemiology and pathogenesis. Nat. Rev. Endocrinol. 2019;15:288–298. - PubMed
    1. Godoy-Matos A.F., Silva Júnior W.S., Valerio C.M. NAFLD as a continuum: From obesity to metabolic syndrome and diabetes. Diabetol. Metab. Syndr. 2020;12:60. - PMC - PubMed