Clinical Trial
. 2024 Aug 27;16(9):1365.
doi: 10.3390/v16091365.

Non-HIV Vaccine-Induced Immune Responses as Potential Baseline Immunogenicity Predictors of ALVAC-HIV and AIDSVAX B/E-Induced Immune Responses

Affiliations
Clinical Trial

Non-HIV Vaccine-Induced Immune Responses as Potential Baseline Immunogenicity Predictors of ALVAC-HIV and AIDSVAX B/E-Induced Immune Responses

Ying Huang et al. Viruses. .

Abstract

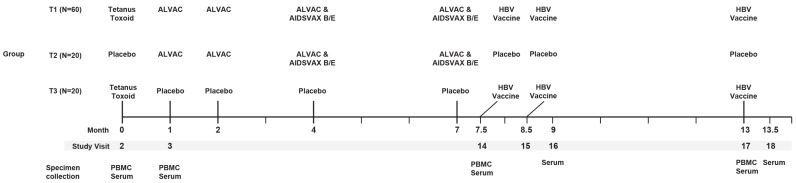
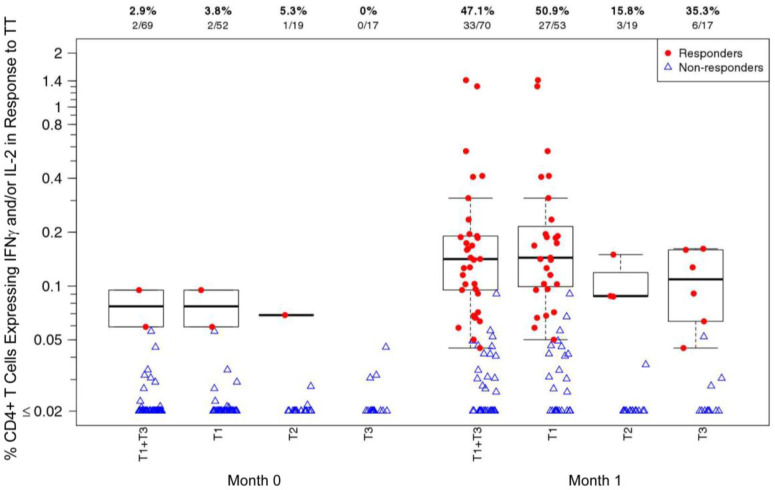
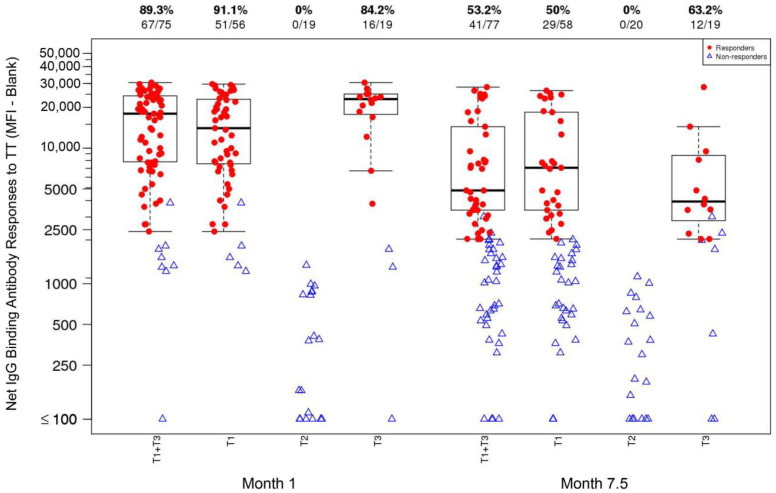
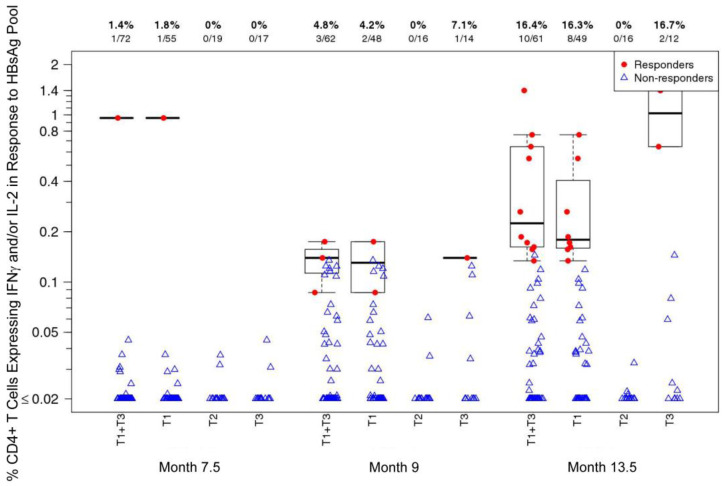
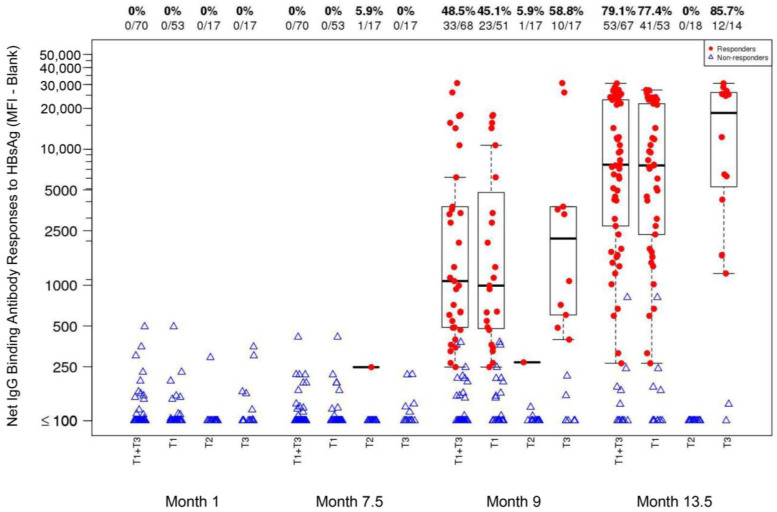
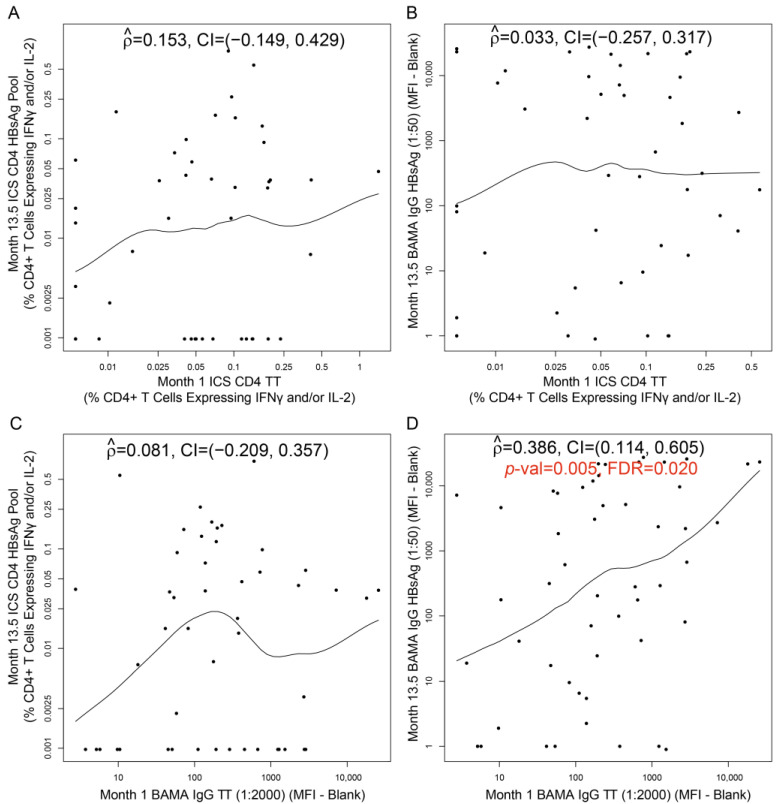
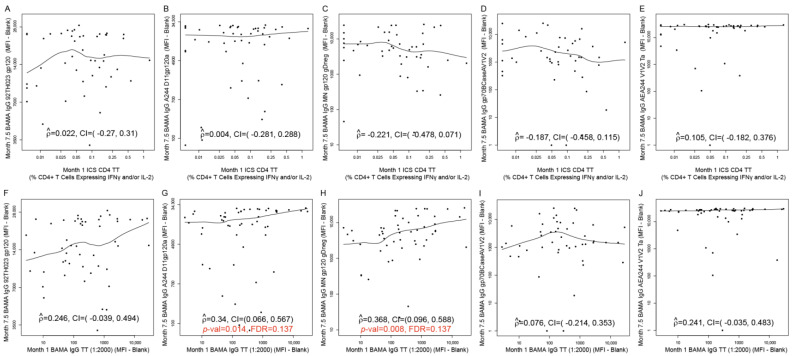
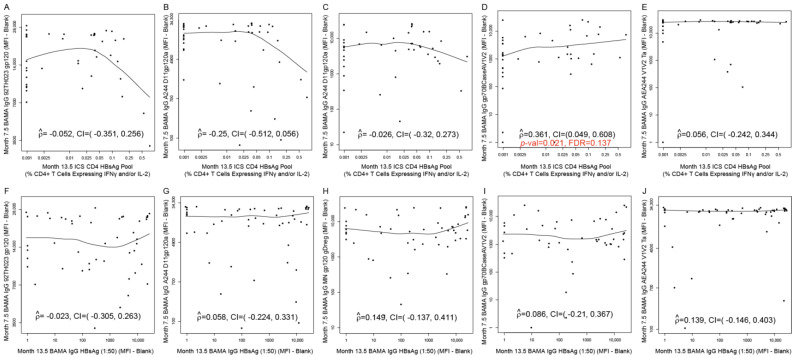
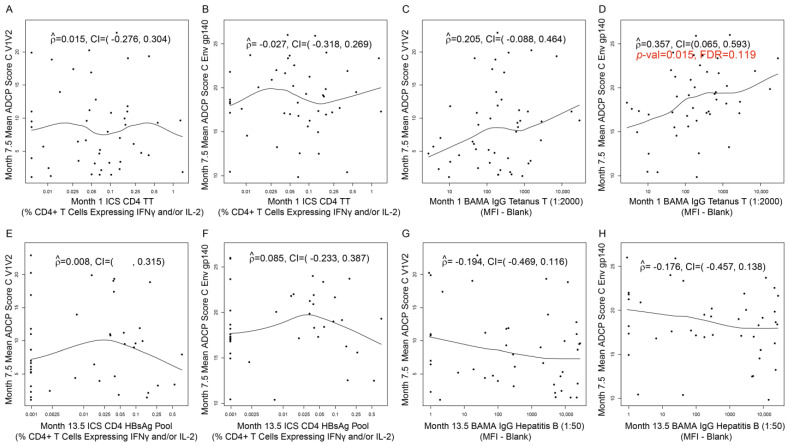
Identifying correlations between immune responses elicited via HIV and non-HIV vaccines could aid the search for correlates of HIV protection and increase statistical power in HIV vaccine-efficacy trial designs. An exploratory objective of the HVTN 097 phase 1b trial was to assess whether immune responses [focusing on those supported as correlates of risk (CoR) of HIV acquisition] induced via the RV144 pox-prime HIV vaccine regimen correlated with those induced via tetanus toxoid (TT) and/or hepatitis B virus (HBV) vaccines. We measured TT-specific and HBV-specific IgG-binding antibody responses and TT-specific and HBV-specific CD4+ T-cell responses at multiple time points in HVTN 097 participants, and we assessed their correlations at peak time points with HIV vaccine (ALVAC-HIV and AIDSVAX B/E)-induced responses. Four correlations were significant [false discovery rate-adjusted p-value (FDR) ≤ 0.2]. Three of these four were with IgG-binding antibody responses to TT measured one month after TT receipt, with the strongest and most significant correlation [rho = 0.368 (95% CI: 0.096, 0.588; p = 0.008; FDR = 0.137)] being with IgG-binding antibody responses to MN gp120 gDneg (B protein boost) measured two weeks after the second ALVAC-HIV and AIDSVAX B/E boost. The fourth significant correlation [(rho = 0.361; 95% CI: 0.049, 0.609; p = 0.021; FDR = 0.137)] was between CD4+ T-cell responses to a hepatitis B surface antigen peptide pool, measured 2 weeks after the third HBV vaccination, and IgG-binding antibody responses to gp70BCaseAV1V2 (B V1V2 immune correlate), measured two weeks after the second ALVAC-HIV and AIDSVAX B/E boost. These moderate correlations imply that either vaccine, TT or HBV, could potentially provide a moderately useful immunogenicity predictor for the ALVAC-HIV and AIDSVAX B/E HIV vaccine regimen.

Keywords: HIV vaccine; T-cell responses; binding antibodies; biomarkers; immune correlates.


Conflict of interest statement

The authors declare no conflicts of interest. The funders had no role in the design of the study, in the collection, analyses, or interpretation of data, in the writing of the manuscript, or in the decision to publish the results.

Figures

Figure 1
Figure 1
Schema of the HVTN 097 trial, along with sampling time points.
Figure 2
Figure 2
CD4+ T-cell responses (% CD4+ T cells expressing IFNγ and/or IL-2) to tetanus toxoid (TT) at Month 0 and at Month 1 [1 month after TT vaccination; T1TT-HIV-HBV and T3TT-HBV] in HVTN 097 participants, stratified by treatment assignment arm. At Month 0, T1TT-HIV-HBV and T3TT-HBV received TT; T2HIV received a placebo. Response rates and numbers of participants are shown at the top of the plot. Responders: red dot; non-responders: open blue triangle.
Figure 3
Figure 3
Net IgG-binding antibody responses (MFI-blank) to tetanus toxoid (TT) (1:2000 dilution) at Month 1 [1 month after TT vaccination; T1TT-HIV-HBV and T3TT-HBV] and at Month 7.5 [2 weeks after the last ALVAC and AIDSVAX B/E vaccination; T1TT-HIV-HBV and T2HIV] in the HVTN 097 participants, stratified by treatment assignment arm. At Month 0, T1TT-HIV-HBV and T3TT-HBV received TT; T2HIV received a placebo. At Month 7, T1TT-HIV-HBV and T2HIV received the last dose of ALVAC and AIDSVAX B/E; T3TT-HBV received a placebo. Response rates and numbers of participants are shown at the top of the plot. Responders: red dot; non-responders: open blue triangle.
Figure 4
Figure 4
CD4+ T-cell responses (% CD4+ T cells expressing IFNγ and/or IL-2) to an HBsAg peptide pool at Month 7.5 and Month 9 [2 weeks after the second hepatitis B virus (HBV) vaccination; T1TT-HIV-HBV and T3TT-HBV], and Month 13.5 [2 weeks after the third HBV vaccination; T1TT-HIV-HBV and T3TT-HBV] in the HVTN 097 participants, stratified by treatment assignment arm. At Months 7.5, 8.5, and 13, T1TT-HIV-HBV and T3TT-HBV received HBV; T2HIV received a placebo. Response rates and numbers of participants are shown at the top of the plot. Responders: red dot; non-responders: open blue triangle.
Figure 5
Figure 5
Net IgG-binding antibody responses [mean fourescence intensity (MFI)-blank] to HBsAg (1:50 dilution) at Month 1 [1 month after TT vaccination; T1TT-HIV-HBV and T3TT-HBV], Month 7.5 [two weeks after the last ALVAC and AIDSVAX B/E vaccination; T1TT-HIV-HBV and T2HIV], Month 9 [2 weeks after the second HBV vaccination; T1TT-HIV-HBV and T3TT-HBV], and Month 13.5 [2 weeks after the third HBV vaccination; T1TT-HIV-HBV and T3TT-HBV] in the HVTN 097 participants, stratified by treatment assignment arm. At Month 0, T1TT-HIV-HBV and T3TT-HBV received TT; T2HIV received a placebo. At Months 7.5, 8.5, and 13, T1TT-HIV-HBV and T3TT-HBV received HBV; T2HIV received a placebo. Response rates and numbers of participants are shown at the top of the plot. Responders: red dot; non-responders: open blue triangle.
Figure 6
Figure 6
Correlations in HVTN 097 participants [T1TT-HIV-HBV arm only] for (A) Month 1 TT-specific CD4+ T-cell responses versus Month 13.5 HBsAg-specific CD4+ T-cell responses; (B) Month 1 TT-specific CD4+ T-cell responses versus Month 13.5 HBV-specific BAMA IgG responses; (C) Month 1 TT-specific BAMA IgG responses versus Month 13.5 HBsAg-specific CD4+ T-cell responses; (D) Month 1 TT-specific BAMA IgG responses versus Month 13.5 HBV-specific BAMA IgG responses. ICS CD4: CD4+ T-cell responses (% CD4+ T cells expressing IFNγ and/or IL-2) to the designated peptide pool; BAMA IgG: Net IgG-binding antibody responses (MFI-blank) to the designated antigen. Each dot represents one participant. At Month 0, T1TT-HIV-HBV participants received TT. At Months 7.5, 8.5, and 13), T1TT-HIV-HBV participants received HBV. For the correlation with FDR ≤ 0.2, the p-value and false discovery rate (FDR) value are shown in red font (panel D). For all other panels, the correlation was not significant (FDR > 0.2).
Figure 7
Figure 7
Correlation plots for (AE) Month 1 TT-specific CD4+ T-cell responses versus Month 7.5 IgG-binding antibody responses against the HIV antigen designated on each y-axis; (FJ) Month 1 TT-specific IgG-binding antibody responses versus Month 7.5 IgG-binding antibody responses against the HIV antigen designated on each y-axis. Data are shown for HVTN 097 participants [T1TT-HIV-HBV arm only]. ICS CD4 TT: CD4+ T-cell responses (% CD4+ T cells expressing IFNγ and/or IL-2) to TT; BAMA IgG TT: Net IgG-binding antibody responses (MFI-blank) to TT. Each dot represents one participant. At Month 0, T1TT-HIV-HBV participants received TT. At Month 7, T1TT-HIV-HBV received the last dose of ALVAC and AIDSVAX B/E. For correlations with FDR ≤ 0.2, the p-values and FDR values are shown in red font (panels G, H). For all other panels, the correlation was not significant (FDR > 0.2).
Figure 8
Figure 8
Correlation plots for (AE) Month 13.5 HBsAg-specific CD4+ T-cell responses versus Month 7.5 IgG-binding antibody responses against the HIV antigen designated on each y-axis; (FJ) Month 13.5 HBsAg-specific IgG-binding antibody responses versus Month 7.5 IgG-binding antibody responses against the HIV antigen designated on each y-axis. Data are shown for HVTN 097 participants [T1TT-HIV-HBV arm only]. ICS CD4 HBsAg pool: CD4+ T-cell responses (% CD4+ T cells expressing IFNγ and/or IL-2) to HBsAg pool; BAMA IgG HBsAg: Net IgG-binding antibody responses (MFI-blank) to HBsAg. Each dot represents one participant. At Month 13, T1TT-HIV-HBV participants received HBV. At Month 7, T1TT-HIV-HBV received the last dose of ALVAC and AIDSVAX B/E. For the correlation with FDR ≤ 0.2, the p-value and FDR value are shown in red font (panel D). For all other panels, the correlation was not significant (FDR > 0.2).
Figure 9
Figure 9
Correlation plots for (A,B) Month 1 TT-specific CD4+ T-cell responses versus Month 7.5 mean ADCP scores against the HIV antigen designated on each y-axis; (C,D) Month 1 TT-specific IgG-binding antibody responses versus Month 7.5 mean ADCP scores against the HIV antigen designated on each y-axis; (E,F) Month 13.5 HBsAg-specific CD4+ T-cell responses versus Month 7.5 mean ADCP scores against the HIV antigen designated on each y-axis; (G,H) Month 13.5 HBsAg-specific IgG-binding antibody responses versus Month 7.5 mean ADCP scores against the HIV antigen designated on each y-axis. Data are shown for HVTN 097 participants [T1TT-HIV-HBV arm only]. ICS CD4 HBsAg pool: CD4+ T-cell responses (% CD4+ T cells expressing IFNγ and/or IL-2) to HBsAg pool; BAMA IgG HBsAg: Net IgG-binding antibody responses (MFI-blank) to HBsAg. Each dot represents one participant. At Month 13, T1TT-HIV-HBV participants received HBV. At Month 7, T1TT-HIV-HBV received the last dose of ALVAC and AIDSVAX B/E. For the correlation with FDR ≤ 0.2, the p-value and FDR value are shown in red font (panel D). For all other panels, the correlation was not significant (FDR > 0.2).

References

    1. Plotkin S.A. Correlates of Protection Induced by Vaccination. Clin. Vaccine Immunol. 2010;17:1055–1065. doi: 10.1128/CVI.00131-10. - DOI - PMC - PubMed
    1. Plotkin S.A., Gilbert P.B. Correlates of Protection. In: Orenstein W., Offit P., Edwards K., Plotkin S., editors. Vaccines. 8th ed. Elsevier Inc.; New York, NY, USA: 2022. pp. 35–40.
    1. King D.F., Groves H., Weller C., Jones I., Cramer J.P., Gilbert P.B., Goldblatt D., Gruber M.F., Kampmann B., Maïga D., et al. Realising the potential of correlates of protection for vaccine development, licensure and use: Short summary. npj Vaccines. 2024;9:82. doi: 10.1038/s41541-024-00872-6. - DOI - PMC - PubMed
    1. Cavaleri M. How Can Correlates of Protection Help the Regulatory Process for Licensure of New Vaccines. Presented for the Product Development for Vaccines Advisory Committee (PDVAC) of the European Medicines Agency, 12 December 2023. [(accessed on 17 July 2024)]. Available online: https://cdn.who.int/media/docs/default-source/immunization/pdvac/pdvac-2....
    1. Gilbert P.B., Fong Y., Hejazi N.S., Kenny A., Huang Y., Carone M., Benkeser D., Follmann D. Four statistical frameworks for assessing an immune correlate of protection (surrogate endpoint) from a randomized, controlled, vaccine efficacy trial. Vaccine. 2024;42:2181–2190. doi: 10.1016/j.vaccine.2024.02.071. - DOI - PMC - PubMed

Publication types

MeSH terms

LinkOut - more resources