

Evaluation of Commercial RNA Extraction Protocols for Avian Influenza Virus Using Nanopore Metagenomic Sequencing
- PMID: 39339905
- PMCID: PMC11437427
- DOI: 10.3390/v16091429
Evaluation of Commercial RNA Extraction Protocols for Avian Influenza Virus Using Nanopore Metagenomic Sequencing
Abstract
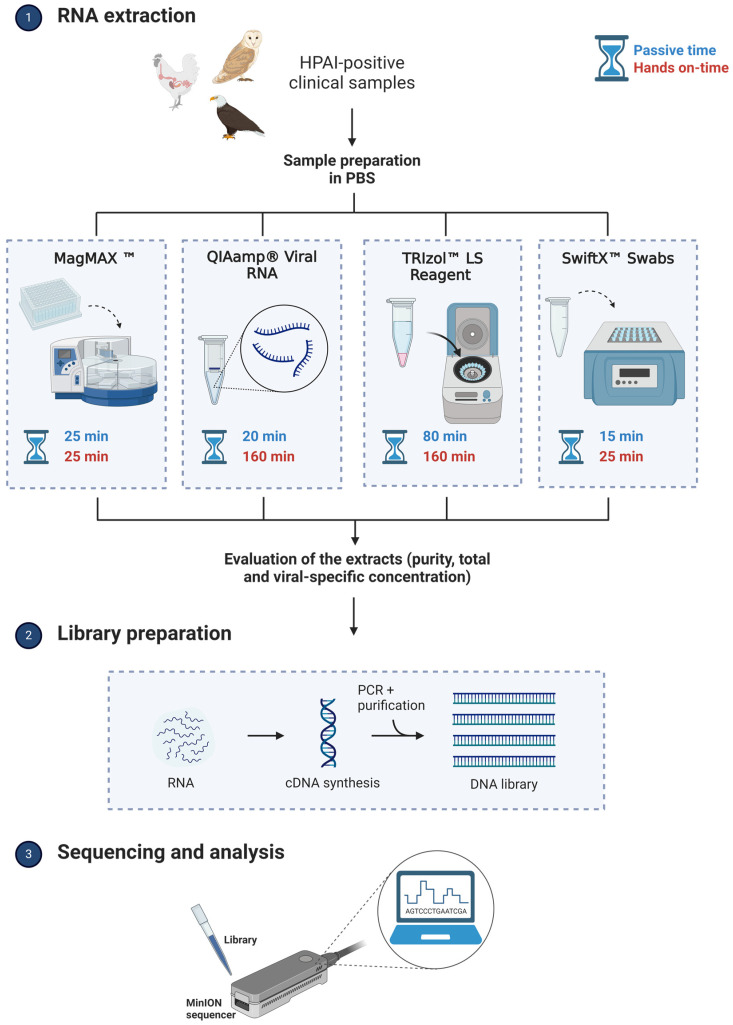
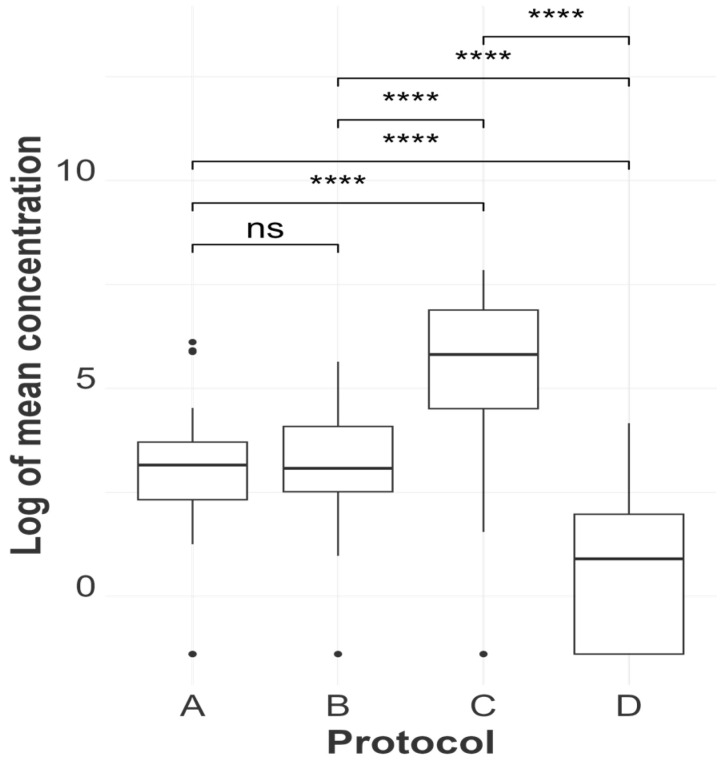
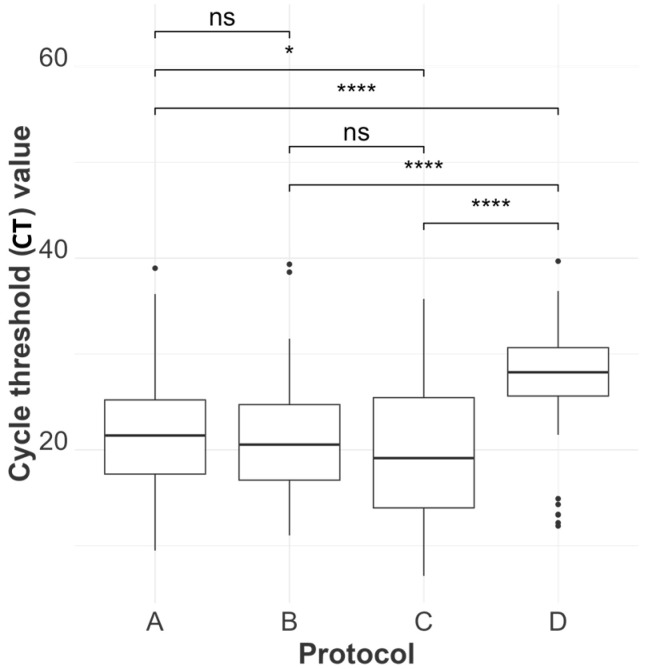
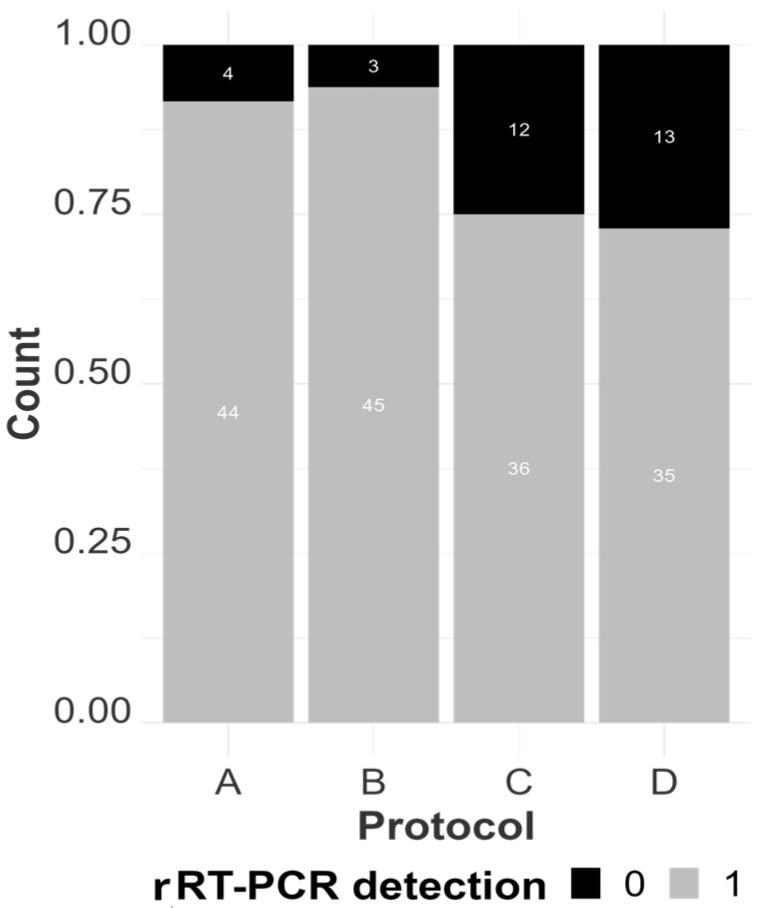
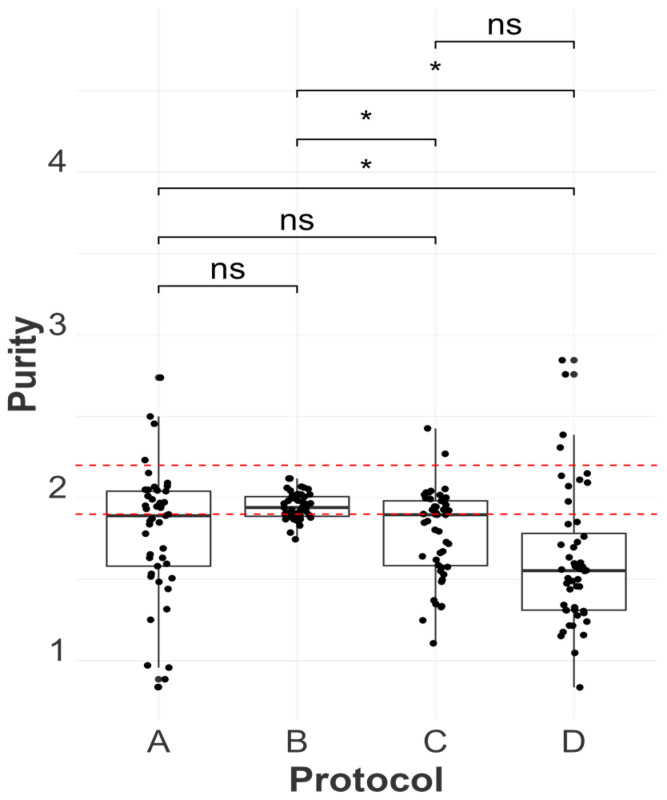
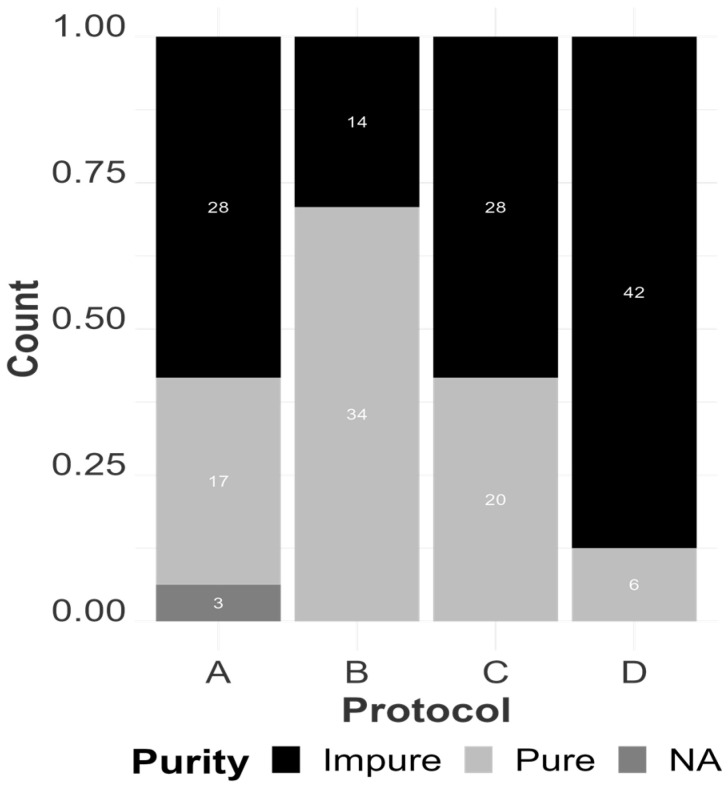
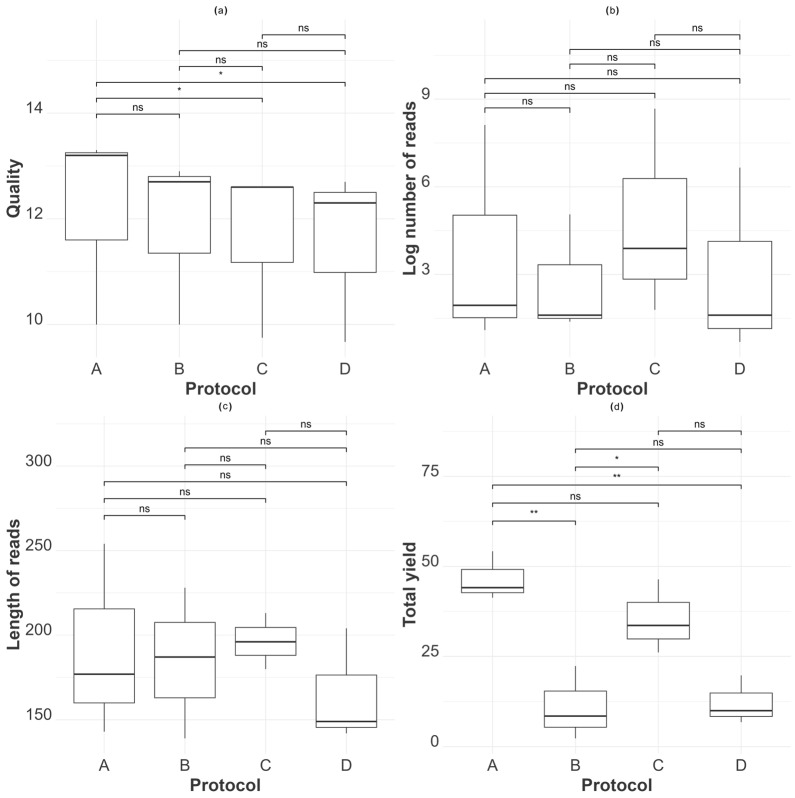
Avian influenza virus (AIV) is a significant threat to the poultry industry, necessitating rapid and accurate diagnosis. The current AIV diagnostic process relies on virus identification via real-time reverse transcription-polymerase chain reaction (rRT-PCR). Subsequently, the virus is further characterized using genome sequencing. This two-step diagnostic process takes days to weeks, but it can be expedited by using novel sequencing technologies. We aim to optimize and validate nucleic acid extraction as the first step to establishing Oxford Nanopore Technologies (ONT) as a rapid diagnostic tool for identifying and characterizing AIV from clinical samples. This study compared four commercially available RNA extraction protocols using AIV-known-positive clinical samples. The extracted RNA was evaluated using total RNA concentration, viral copies as measured by rRT-PCR, and purity as measured by a 260/280 absorbance ratio. After NGS testing, the number of total and influenza-specific reads and quality scores of the generated sequences were assessed. The results showed that no protocol outperformed the others on all parameters measured; however, the magnetic particle-based method was the most consistent regarding CT value, purity, total yield, and AIV reads, and it was less error-prone. This study highlights how different RNA extraction protocols influence ONT sequencing performance.
Keywords: avian influenza; metagenomic sequencing; nanopore sequencing; nucleic acid extraction.
Conflict of interest statement
The authors declare no conflicts of interest.
Figures
Similar articles
-
Development of an internal positive control for rapid diagnosis of avian influenza virus infections by real-time reverse transcription-PCR with lyophilized reagents.J Clin Microbiol. 2006 Sep;44(9):3065-73. doi: 10.1128/JCM.00639-06. J Clin Microbiol. 2006. PMID: 16954228 Free PMC article.
-
Predicting whole genome sequencing success for archived avian influenza virus (Orthomyxoviridae) samples using real-time and droplet PCRs.J Virol Methods. 2020 Feb;276:113777. doi: 10.1016/j.jviromet.2019.113777. Epub 2019 Nov 12. J Virol Methods. 2020. PMID: 31730870
-
Multiplex one-step Real-time PCR by Taqman-MGB method for rapid detection of pan and H5 subtype avian influenza viruses.PLoS One. 2017 Jun 2;12(6):e0178634. doi: 10.1371/journal.pone.0178634. eCollection 2017. PLoS One. 2017. PMID: 28575115 Free PMC article.
-
Detection of non-notifiable H4N6 avian influenza virus in poultry in Great Britain.Vet Microbiol. 2018 Oct;224:107-115. doi: 10.1016/j.vetmic.2018.08.026. Epub 2018 Sep 3. Vet Microbiol. 2018. PMID: 30269784
-
Advances in the molecular based techniques for the diagnosis and characterization of avian influenza virus infections.Transbound Emerg Dis. 2008 Oct;55(8):329-38. doi: 10.1111/j.1865-1682.2008.01047.x. Transbound Emerg Dis. 2008. PMID: 18786072 Review.
Cited by
-
Recent Advances of Avian Viruses Research.Viruses. 2025 Jan 14;17(1):99. doi: 10.3390/v17010099. Viruses. 2025. PMID: 39861888 Free PMC article.
References
-
- [(accessed on 23 April 2023)]. Available online: https://www.woah.org/en/disease/avian-influenza/
-
- McMullin P.F. In: Diseases of Poultry. 14th ed. Swayne D.E., Boulianne M., Logue C.M., McDougald L.R., Nair V., Suarez D.L., de Wit S., Grimes T., Johnson D., Kromm M., et al., editors. Volume I John Wiley & Sons; Hoboken, NJ, USA: 2020.
-
- USDA Animal and Plant Health Inspection Service Veterinary Services . Final Report for the 2014–2015 Outbreak of Highly Pathogenic Avian Influenza (HPAI) in the United States. USDA; Riverdale, MD, USA: 2016.
-
- USDA Animal and Plant Health Inspection Service 2022–2023 Confirmations of Highly Pathogenic Avian Influenza in Commercial and Backyard Flocks. [(accessed on 22 November 2023)]; Available online: https://www.aphis.usda.gov/aphis/ourfocus/animalhealth/animal-disease-in....
Publication types
MeSH terms
Substances
Associated data
Grants and funding
LinkOut - more resources
Full Text Sources
Medical
