. 2024 Sep 9;16(9):1436.
doi: 10.3390/v16091436.

SARS-CoV-2 Variants from Long-Term, Persistently Infected Immunocompromised Patients Have Altered Syncytia Formation, Temperature-Dependent Replication, and Serum Neutralizing Antibody Escape

Affiliations

SARS-CoV-2 Variants from Long-Term, Persistently Infected Immunocompromised Patients Have Altered Syncytia Formation, Temperature-Dependent Replication, and Serum Neutralizing Antibody Escape

Camille Wouters et al. Viruses. .

Abstract

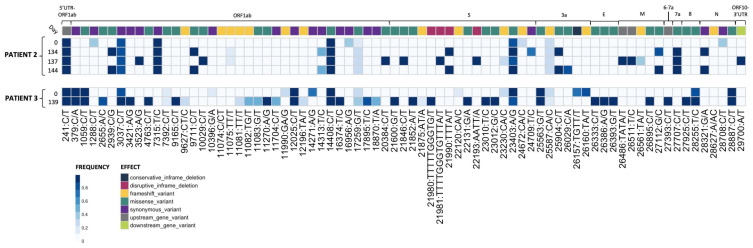
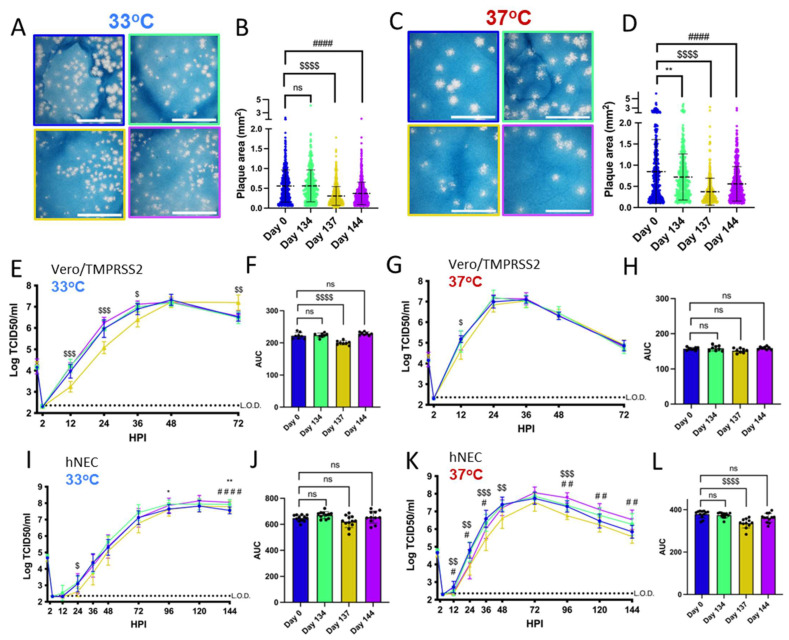
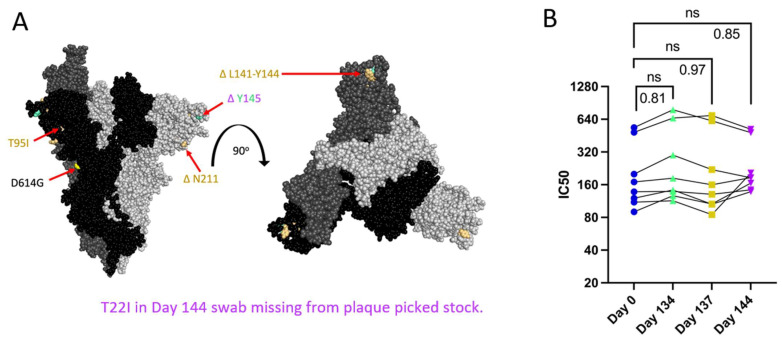
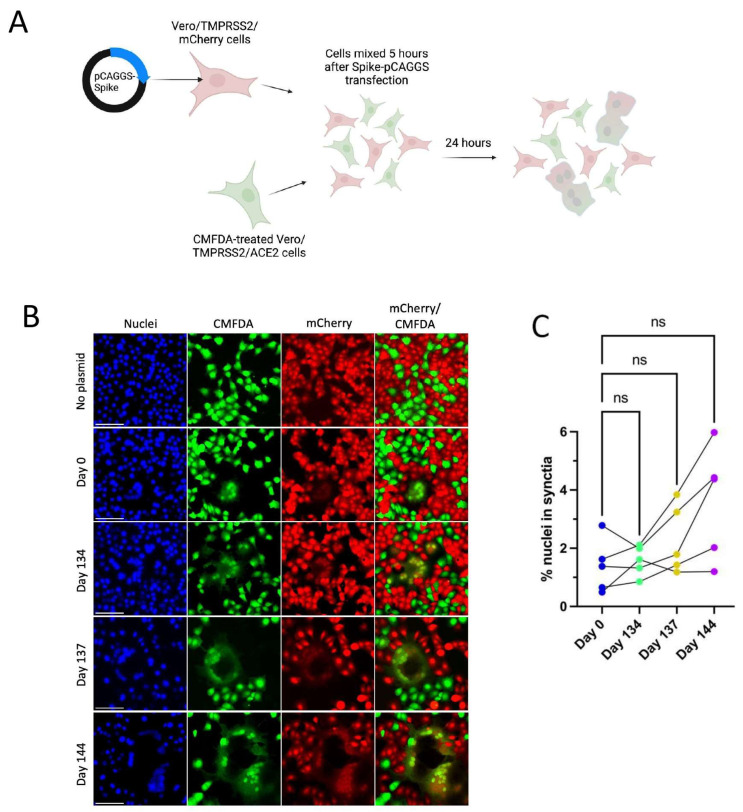
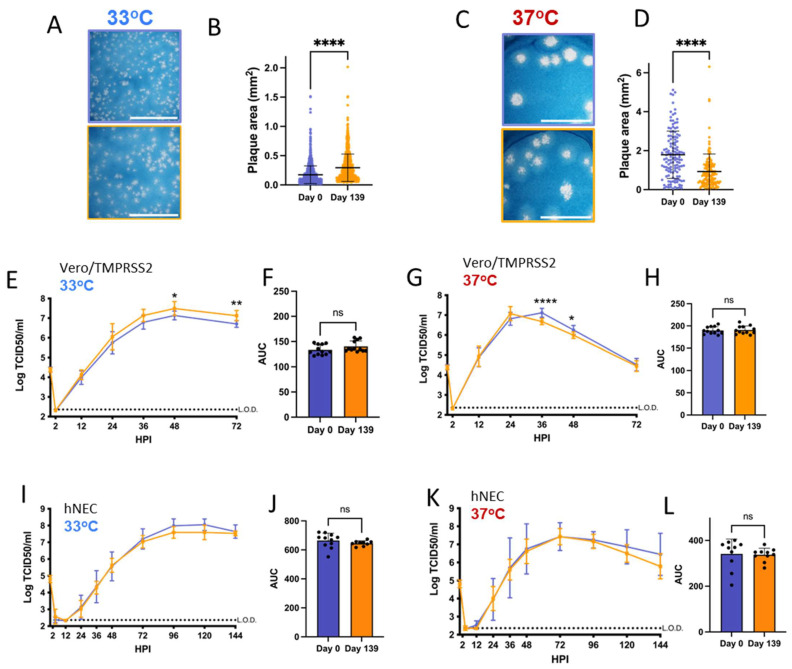
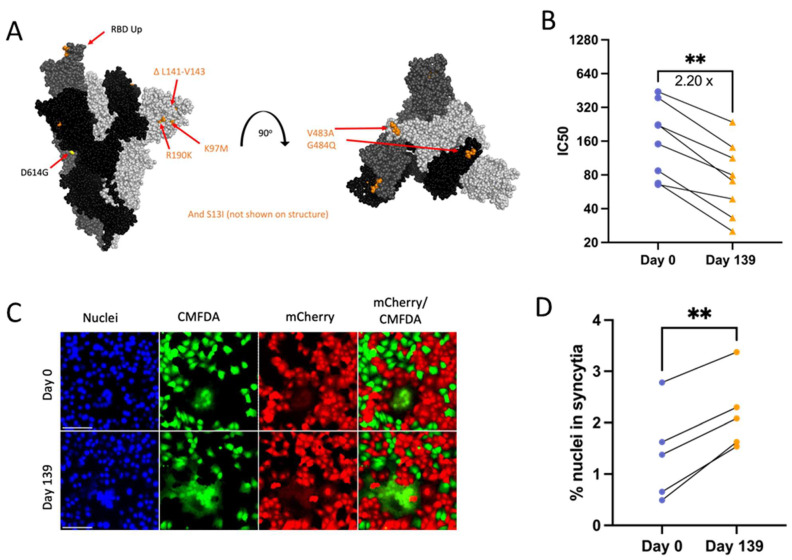
SARS-CoV-2 infection of immunocompromised individuals often leads to prolonged detection of viral RNA and infectious virus in nasal specimens, presumably due to the lack of induction of an appropriate adaptive immune response. Mutations identified in virus sequences obtained from persistently infected patients bear signatures of immune evasion and have some overlap with sequences present in variants of concern. We characterized virus isolates obtained greater than 100 days after the initial COVID-19 diagnosis from two COVID-19 patients undergoing immunosuppressive cancer therapy, wand compared them to an isolate from the start of the infection. Isolates from an individual who never mounted an antibody response specific to SARS-CoV-2 despite the administration of convalescent plasma showed slight reductions in plaque size and some showed temperature-dependent replication attenuation on human nasal epithelial cell culture compared to the virus that initiated infection. An isolate from another patient-who did mount a SARS-CoV-2 IgM response-showed temperature-dependent changes in plaque size as well as increased syncytia formation and escape from serum-neutralizing antibodies. Our results indicate that not all virus isolates from immunocompromised COVID-19 patients display clear signs of phenotypic change, but increased attention should be paid to monitoring virus evolution in this patient population.

Keywords: SARS-CoV-2; immunocompromised host; neutralizing antibody escape; syncytia; virus evolution.


Conflict of interest statement

The authors declare no conflict of interest.

Figures

Figure 1
Figure 1
Plaque-picked isolates from Patients 2 and 3 show the accumulation of mutations during prolonged SARS-CoV-2 replication in the patients. RNA-sequencing results from plaque-picked SARS-CoV-2 virus working stocks used for characterization work in this paper (UTR, untranslated region; S, Spike; E, envelope; M, matrix; N, nucleocapsid). All mutations are relative to the 2020 Wuhan-Hu-1 reference genome (NCBI Reference Sequence: NC_045512.2). For comparison to nasal swab sequences from [9], see Supplementary Tables S2 and S3.
Figure 2
Figure 2
Viruses isolated from Patient 2 later during the infection have distinct temperature-dependent phenotypes compared to Day 0 virus. Comparisons: * (Day 0 to Day 134), $ (Day 0 to Day 137), # (Day 0 to Day 144). p values displayed as “ns” p > 0.05, one symbol is p < 0.05, two symbols are p < 0.01, three symbols are p < 0.001, and four symbols are p < 0.0001. (A,C): Representative images of plaques from each virus isolate at 33 °C and 37 °C, respectively, in Vero/TMPRSS2 cells. Scale bar = 10 mm. (B,D): Quantified plaque sizes, >500 (33 °C) and >390 (37 °C) plaques per virus accumulated from 3 independent experiments, one-way ordinary ANOVA with Bonferroni's multiple comparisons test (all comparisons to Day 0 isolate). (E,G): Growth curves showing virus replication on Vero/TMPRSS2 cells at 33 °C and 37 °C, respectively, the data are derived from 2 independent experiments with four wells per virus per experiment, standard deviation shown on error bars, and two-way repeated measures ANOVA with Bonferroni’s multiple comparisons test (all comparisons to Day 0 isolate). HPI = Hours Post Infection. (F,H): Total virus production on Vero/TMPRSS2 cells measured until peak tire at 33 °C (48 HPI peak) and 37 °C (36 HPI peak), respectively, one-way ordinary ANOVA with Bonferroni’s multiple comparisons test (all comparisons to Day 0 isolate). (I,K): Growth curves showing virus replication in hNECs at 33 °C and 37 °C, respectively, 3 independent experiments, standard deviation shown on error bars, and two-way repeated measures ANOVA with Bonferroni’s multiple comparisons test (all comparisons to Day 0 isolate). (J,L): Total virus production on hNECs measured until peak titer at 33 °C (120 HPI peak) and 37 °C (72 HPI peak), respectively, one-way ordinary ANOVA with Bonferroni’s multiple comparisons test (all comparisons to Day 0 isolate).
Figure 3
Figure 3
Spike mutations found on Patient 2 viruses do not correspond to major changes in neutralization by convalescent plasma (B). “ns” (p > 0.05). (A): Side and top view of the Spike trimer (each monomer in a different shade of grey, one RBD in up conformation), with Patient 2 virus-specific mutations displayed in corresponding colors, all virus Spikes contain D614G mutation (PyMOL, PDB: 7WZ2). (B): PRNT IC50 values for Patient 2 viruses using 8 convalescent serum samples (each tested in duplicate) and graphed individually with lines connecting serum from the same individual, one-way repeated measures ANOVA with Bonferroni's multiple comparisons test (all comparisons to Day 0 isolate).
Figure 4
Figure 4
Patient 2 CHLA Spike mutations show a trend toward increased syncytia formation versus Day 0 virus using a two-colour syncytia assay. “ns” (p > 0.05). (A): Overview of the two-colour syncytia assay method (illustration created with BioRender). (B): Example image of syncytia formation induced by each of the Patient 2 CHLA virus pCAGGS-Spike plasmids versus a no plasmid control. Scale bar = 100 µm. (C): Percentage of nuclei within syncytia, 5 independent experiments graphed separately. One-way repeated measures ANOVA with Bonferroni’s multiple comparisons test (all comparisons to Day 0 isolate).
Figure 5
Figure 5
Virus isolated from Patient 3 later during the infection has distinct temperature-dependent plaque phenotypes but no significant replication differences. p values displayed as “ns” p > 0.05, * p < 0.05, ** p < 0.01 and **** p < 0.0001. (A,C): representative images of plaques in Vero/TMPRSS2 cells from each virus isolate at 33 °C and 37 °C, respectively, scale bar = 10 mm. (B,D): Quantified plaque sizes for >889 (33°) and 129 (37 °C) plaques per virus accumulated from 3 independent experiments on Vero/TMPRSS2 cells, unpaired t-test. (E,G): Growth curves showing virus replication on Vero/TMPRSS2 cells at 33 °C and 37 °C, respectively, 3 independent experiments with four wells per virus per experiment, standard deviation shown on error bars, and two-way repeated measures ANOVA with Bonferroni’s multiple comparisons test. (F,H): Total virus production on Vero/TMPRSS2 cells measured until peak tire at 33 °C (48 HPI peak) and 37 °C (36 HPI peak), respectively, unpaired t-test. (I,K): Growth curves on hNECs at 33 °C and 37 °C, respectively, 3 independent experiments, standard deviation shown on error bars, two-way repeated measures ANOVA with Bonferroni's multiple comparisons test. (J,L): Total virus production on hNECs measured until peak tire at 33 °C (120 HPI peak) and 37 °C (72 HPI peak), respectively, unpaired t test.
Figure 6
Figure 6
Patient 3 Day 139 virus shows significant escape from neutralizing antibodies (B) and increased Spike-induced syncytia formation (D). p values displayed as ** p < 0.01. (A): Side and top view of the Spike trimer (each monomer in a different shade of grey, one RBD in up conformation), with Day 139 mutations displayed (no additional mutations apart from D614G on Day 0 Spike) (PyMOL, PDB: 7WZ2). (B): PRNT IC50 values for Patient 3 viruses using 8 convalescent serum samples (each tested in duplicate) and graphed individually with lines connecting serum from the same individual. Fold change calculated from geometric means, paired 2-tailed t-test. (C): Example image of syncytia formation induced by the Patient 3 CHLA virus pCAGGS-Spike plasmids versus a no plasmid control. Notably, the Day 0 plasmid is the same as in Patient 2. Scale bar = 100 µm. (D): Percentage of nuclei within syncytia, 5 independent experiments graphed separately. Statistics were performed on data pooled from all 5 experiments, paired 2-tailed t-test, ** p < 0.01.

Similar articles

  • Long-Term Evolution of SARS-CoV-2 in an Immunocompromised Patient with Non-Hodgkin Lymphoma.
    Borges V, Isidro J, Cunha M, Cochicho D, Martins L, Banha L, Figueiredo M, Rebelo L, Trindade MC, Duarte S, Vieira L, Alves MJ, Costa I, Guiomar R, Santos M, Cortê-Real R, Dias A, Póvoas D, Cabo J, Figueiredo C, Manata MJ, Maltez F, Gomes da Silva M, Gomes JP. Borges V, et al. mSphere. 2021 Aug 25;6(4):e0024421. doi: 10.1128/mSphere.00244-21. Epub 2021 Jul 28. mSphere. 2021. PMID: 34319130 Free PMC article.
  • Escape from neutralizing antibodies by SARS-CoV-2 spike protein variants.
    Weisblum Y, Schmidt F, Zhang F, DaSilva J, Poston D, Lorenzi JC, Muecksch F, Rutkowska M, Hoffmann HH, Michailidis E, Gaebler C, Agudelo M, Cho A, Wang Z, Gazumyan A, Cipolla M, Luchsinger L, Hillyer CD, Caskey M, Robbiani DF, Rice CM, Nussenzweig MC, Hatziioannou T, Bieniasz PD. Weisblum Y, et al. Elife. 2020 Oct 28;9:e61312. doi: 10.7554/eLife.61312. Elife. 2020. PMID: 33112236 Free PMC article.
  • SARS-CoV-2 prolonged infection during advanced HIV disease evolves extensive immune escape.
    Cele S, Karim F, Lustig G, San JE, Hermanus T, Tegally H, Snyman J, Moyo-Gwete T, Wilkinson E, Bernstein M, Khan K, Hwa SH, Tilles SW, Singh L, Giandhari J, Mthabela N, Mazibuko M, Ganga Y, Gosnell BI, Karim SSA, Hanekom W, Van Voorhis WC, Ndung'u T; COMMIT-KZN Team; Lessells RJ, Moore PL, Moosa MS, de Oliveira T, Sigal A. Cele S, et al. Cell Host Microbe. 2022 Feb 9;30(2):154-162.e5. doi: 10.1016/j.chom.2022.01.005. Epub 2022 Jan 14. Cell Host Microbe. 2022. PMID: 35120605 Free PMC article.
  • The consequences of SARS-CoV-2 within-host persistence.
    Sigal A, Neher RA, Lessells RJ. Sigal A, et al. Nat Rev Microbiol. 2025 May;23(5):288-302. doi: 10.1038/s41579-024-01125-y. Epub 2024 Nov 25. Nat Rev Microbiol. 2025. PMID: 39587352 Review.
  • Understanding the Secret of SARS-CoV-2 Variants of Concern/Interest and Immune Escape.
    Lou F, Li M, Pang Z, Jiang L, Guan L, Tian L, Hu J, Fan J, Fan H. Lou F, et al. Front Immunol. 2021 Nov 5;12:744242. doi: 10.3389/fimmu.2021.744242. eCollection 2021. Front Immunol. 2021. PMID: 34804024 Free PMC article.

Cited by

References

    1. Clark S.A., Clark L.E., Pan J., Coscia A., McKay L.G.A., Shankar S., Johnson R.I., Brusic V., Choudhary M.C., Regan J., et al. SARS-CoV-2 Evolution in an Immunocompromised Host Reveals Shared Neutralization Escape Mechanisms. Cell. 2021;184:2605–2617.e18. doi: 10.1016/j.cell.2021.03.027. - DOI - PMC - PubMed
    1. Wang Q., Guo Y., Iketani S., Nair M.S., Li Z., Mohri H., Wang M., Yu J., Bowen A.D., Chang J.Y., et al. Antibody Evasion by SARS-CoV-2 Omicron Subvariants BA.2.12.1, BA.4 and BA.5. Nature. 2022;608:603–608. doi: 10.1038/s41586-022-05053-w. - DOI - PMC - PubMed
    1. Otto S.P., Day T., Arino J., Colijn C., Dushoff J., Li M., Mechai S., Van Domselaar G., Wu J., Earn D.J.D., et al. The Origins and Potential Future of SARS-CoV-2 Variants of Concern in the Evolving COVID-19 Pandemic. Curr. Biol. 2021;31:R918–R929. doi: 10.1016/j.cub.2021.06.049. - DOI - PMC - PubMed
    1. Braun K.M., Moreno G.K., Wagner C., Accola M.A., Rehrauer W.M., Baker D.A., Koelle K., O’Connor D.H., Bedford T., Friedrich T.C., et al. Acute SARS-CoV-2 Infections Harbor Limited within-Host Diversity and Transmit via Tight Transmission Bottlenecks. PLoS Pathog. 2021;17:e1009849. doi: 10.1371/journal.ppat.1009849. - DOI - PMC - PubMed
    1. Lythgoe K.A., Hall M., Ferretti L., de Cesare M., MacIntyre-Cockett G., Trebes A., Andersson M., Otecko N., Wise E.L., Moore N., et al. SARS-CoV-2 within-Host Diversity and Transmission. Science. 2021;372:eabg0821. doi: 10.1126/science.abg0821. - DOI - PMC - PubMed

Publication types

MeSH terms

Supplementary concepts

LinkOut - more resources