. 2024 Sep 10;16(9):1440.
doi: 10.3390/v16091440.

The Autophagy Receptor SQSTM1/p62 Is a Restriction Factor of HCMV Infection

Affiliations

The Autophagy Receptor SQSTM1/p62 Is a Restriction Factor of HCMV Infection

Nadine Krämer et al. Viruses. .

Abstract

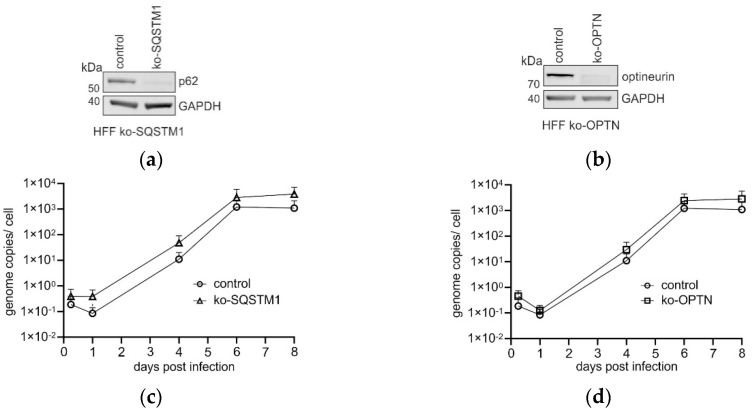
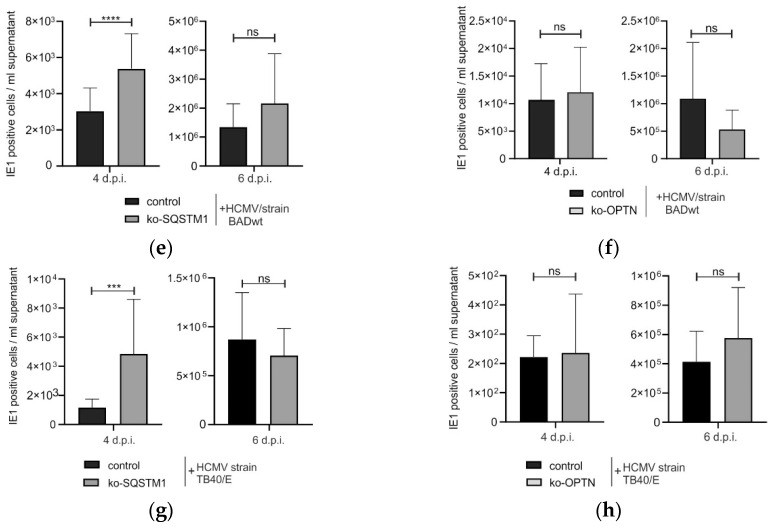
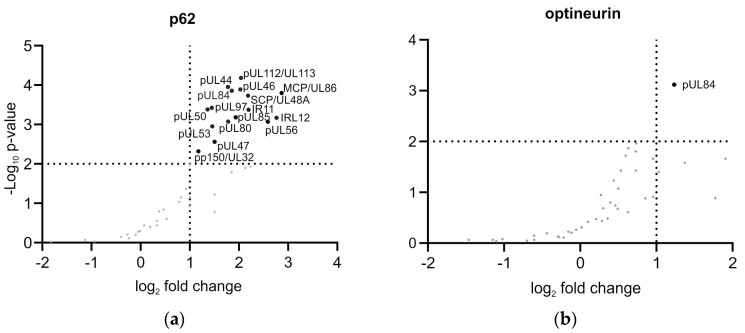
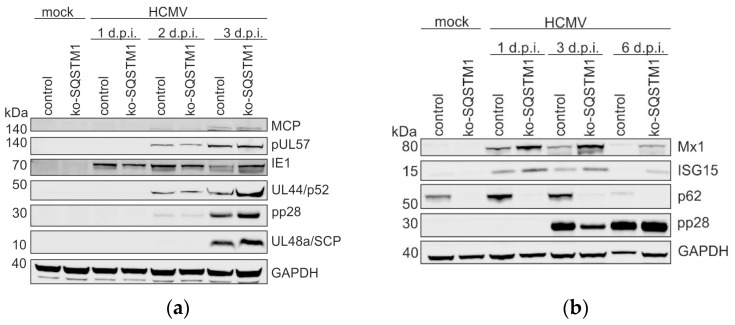
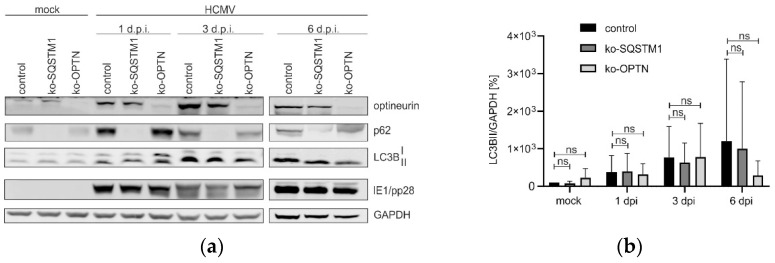
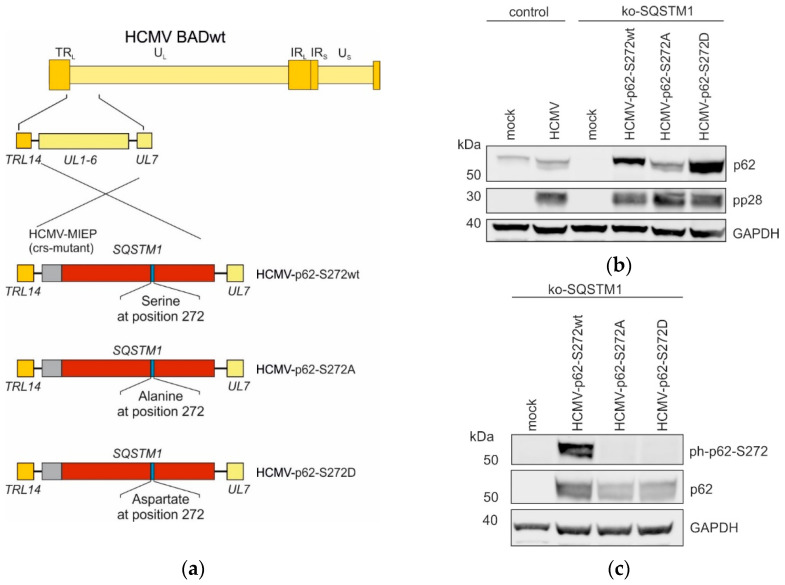
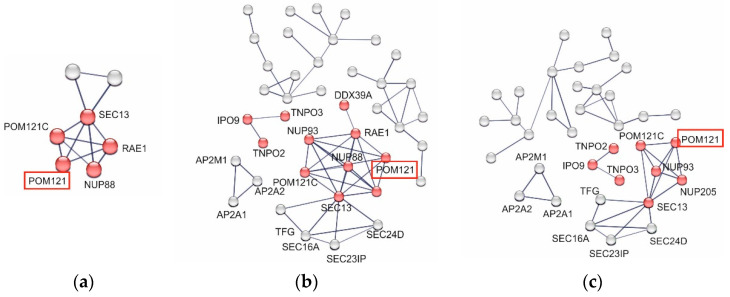
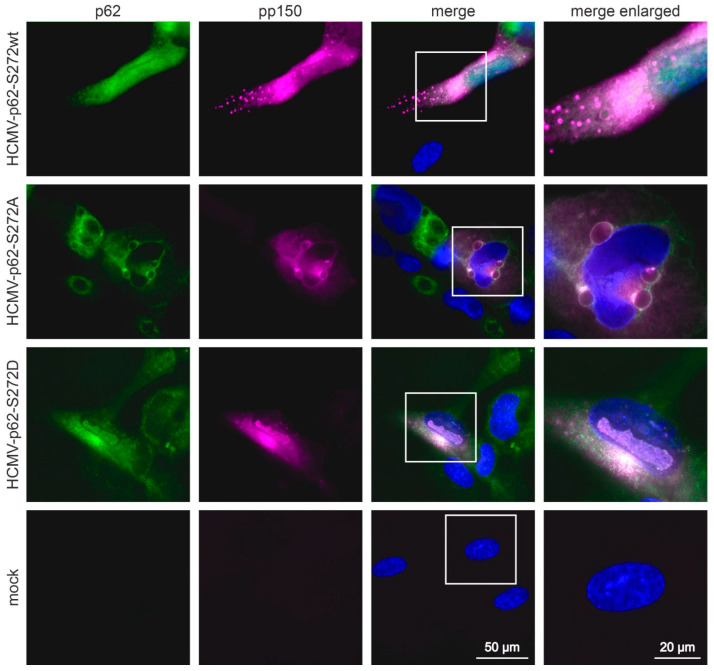
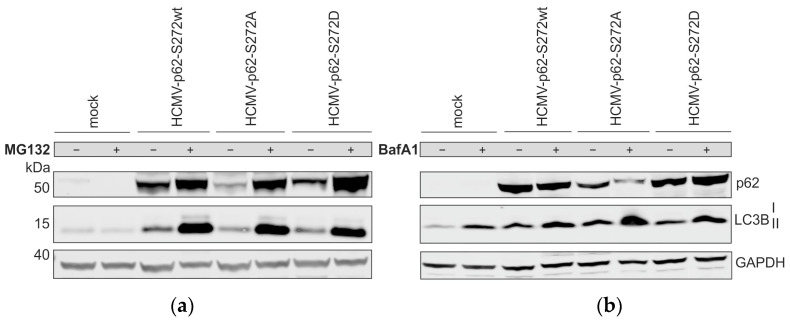
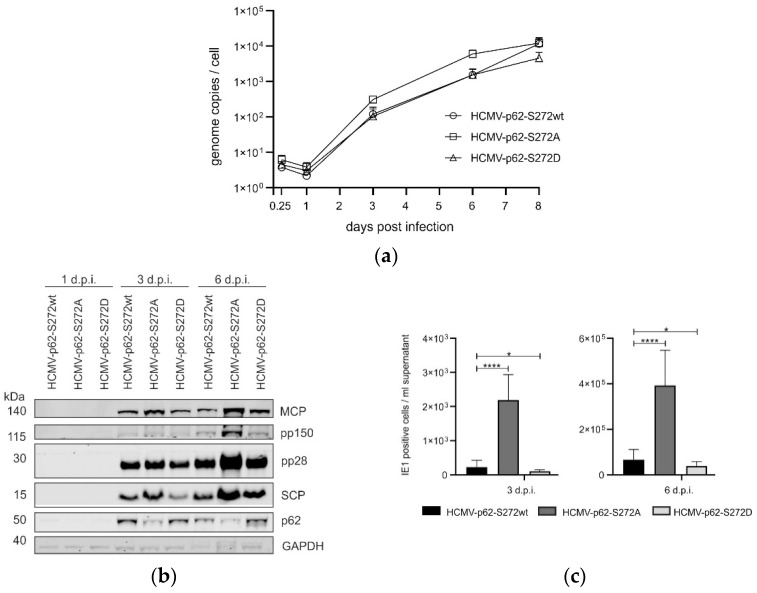
(1) Background: Intrinsic defense mechanisms are pivotal host strategies to restrict viruses already at early stages of their infection. Here, we addressed the question of how the autophagy receptor sequestome 1 (SQSTM1/p62, hereafter referred to as p62) interferes with human cytomegalovirus (HCMV) infection. (2) Methods: CRISPR/Cas9-mediated genome editing, mass spectrometry and the expression of p62 phosphovariants from recombinant HCMVs were used to address the role of p62 during infection. (3) Results: The knockout of p62 resulted in an increased release of HCMV progeny. Mass spectrometry revealed an interaction of p62 with cellular proteins required for nucleocytoplasmic transport. Phosphoproteomics further revealed that p62 is hyperphosphorylated at position S272 in HCMV-infected cells. Phosphorylated p62 showed enhanced nuclear retention, which is concordant with enhanced interaction with viral proteins relevant for genome replication and nuclear capsid egress. This modification led to reduced HCMV progeny release compared to a non-phosphorylated version of p62. (4) Conclusions: p62 is a restriction factor for HCMV replication. The activity of the receptor appears to be regulated by phosphorylation at position S272, leading to enhanced nuclear localization, viral protein degradation and impaired progeny production.

Keywords: SQSTM1/p62; autophagy receptor; host cell defense; human cytomegalovirus; optineurin.


Conflict of interest statement

The authors declare no conflicts of interest.

Figures

Figure 1
Figure 1
Impact of p62 and optineurin on HCMV infection. (a,b) Immunoblot analysis of HFF ko-SQSTM1 and HFF ko-OPTN, using antibodies against p62, optineurin and GAPDH. (c,d) Quantitative PCR-analysis of HCMV genome replication, following infection of HFF ko-SQSTM1 (c) or HFF ko-OPTN (d). Cells were infected with 4 genome copies/cell and collected at the indicated time points post-infection. Genome copies of the isolated viral DNA were determined by TaqMan qPCR. Each value represents the mean of triplicate determinations from three independent experiments. The corresponding standard deviation (SD) is represented by an error bar. (e,f) Quantitation of viral progeny release by the IE1 assay, following infection of HFF ko-SQSTM1 (e) or HFF ko-OPTN (f) with HCMV (strain BADwt). The data represent mean values + standard deviations (SD) of eight technical replicates from four (HFF ko-SQSTM1) or three (HFF ko-OPTN) individual experiments for each cell line and the corresponding time point. (g,h) Quantitation of viral progeny release by the IE1 assay, following infection of HFF ko-SQSTM1 (g) or HFF ko-OPTN (h) with HCMV (strain TB40). The data represent mean values + standard deviations (SD) of eight technical replicates from three individual experiments for each cell line and the corresponding time point. The statistical analysis was performed by utilizing Welch’s t-test. Not significant (ns): p > 0.05. ***: p ≤ 0.001. ****: p ≤ 0.0001.
Figure 1
Figure 1
Impact of p62 and optineurin on HCMV infection. (a,b) Immunoblot analysis of HFF ko-SQSTM1 and HFF ko-OPTN, using antibodies against p62, optineurin and GAPDH. (c,d) Quantitative PCR-analysis of HCMV genome replication, following infection of HFF ko-SQSTM1 (c) or HFF ko-OPTN (d). Cells were infected with 4 genome copies/cell and collected at the indicated time points post-infection. Genome copies of the isolated viral DNA were determined by TaqMan qPCR. Each value represents the mean of triplicate determinations from three independent experiments. The corresponding standard deviation (SD) is represented by an error bar. (e,f) Quantitation of viral progeny release by the IE1 assay, following infection of HFF ko-SQSTM1 (e) or HFF ko-OPTN (f) with HCMV (strain BADwt). The data represent mean values + standard deviations (SD) of eight technical replicates from four (HFF ko-SQSTM1) or three (HFF ko-OPTN) individual experiments for each cell line and the corresponding time point. (g,h) Quantitation of viral progeny release by the IE1 assay, following infection of HFF ko-SQSTM1 (g) or HFF ko-OPTN (h) with HCMV (strain TB40). The data represent mean values + standard deviations (SD) of eight technical replicates from three individual experiments for each cell line and the corresponding time point. The statistical analysis was performed by utilizing Welch’s t-test. Not significant (ns): p > 0.05. ***: p ≤ 0.001. ****: p ≤ 0.0001.
Figure 2
Figure 2
MS analysis of the interaction of p62 (a) and optineurin (b) with HCMV proteins. HFFs, infected with HCMV (m.o.i.= 1) were incubated with protein A/G magnetic beads and specific antibodies against either p62 or optineurin or IgG as control. Precipitates were analyzed and quantified by MS. They were considered significant under the following conditions: one-sided two-sample Student’s t-test with a minimal enrichment factor of 2 (log2(2) = 1), showing the log2 fold change and p < 0.01 (−log10(0.01) = 2). Hits in the upper right quarter are considered significant. All data are deposited at the PRIDE repository (PXD055196).
Figure 3
Figure 3
Western blot analysis of viral protein expression in HFF ko-SQSTM1. (a) Viral protein levels in dependence of p62 in HCMV-infected cells. HFF ko-SQSTM1 and control cells were infected with HCMV strain TB40, using 8 genome copies/cell. At 1, 2 and 3 d.p.i., cells were collected and subjected to Western blot. The membrane was probed with antibodies against the viral proteins major capsid protein (MCP), pUL57, pUL44, pp28, and pUL48a. GAPDH levels were used as a loading control. (b) ISG levels in dependence of p62 in HCMV-infected cells. HFF ko-SQSTM1 and control cells were infected with HCMV, using an m.o.i. of 0.5. At 1, 3 and 6 d.p.i., cells were collected and subjected to Western blot. The membrane was probed with antibodies against the ISGs proteins Mx1 and ISG15. Antibodies against p62 were used as controls. The detection of pp28 served as a control for HCMV infection. GAPDH levels were used as a loading control.
Figure 4
Figure 4
Western blot analysis of the influence of p62 and optineurin on autophagy induction. (a) HFF ko-SQSTM1, HFF ko-OPTN, and control cells were infected with HCMV, using an m.o.i. of 0.5. At 1, 3 and 6 d.p.i., cells were collected, and autophagy was analyzed by Western blot. LC3B was used as an indicator of autophagy functions. The turnover of the cytosolic form (LC3B-I) to the autophagosomal membrane associated from (LC3B-II) was detected with an LC3B-specific antibody. Antibodies against p62 and optineurin were applied for control. Detection of the viral IE1 protein at 1 and 3 d.p.i. and pp28 at 6 d.p.i. served as control for HCMV infection. The levels of GAPDH were used as loading control. Shown is a representative Western blot out of four experiments. (b) Ratio of LC3BII to GAPDH from four biological replicates. The statistical difference between each ko-SQSTM1 and ko-OPTN was analyzed with two-way ANOVA with Sidak’s multiple comparisons test, ns: not significant.
Figure 5
Figure 5
Determination of the phosphorylation status of p62 during HCMV infection. (a) MS analysis of the phosphorylation status of p62 in HCMV-infected versus non-infected HFF-GFP-SQSTM1. The detected phosphorylation sites of p62 of three biological replicates are displayed in a volcano plot, showing the fold change (X-axis) and significance as −log10 p-value (Y-axis). The phosphorylation sites are shown as individual data points. Changes in the phosphorylation status at S272 (colored dot) in infected versus non-infected cells reached significance above the threshold for the fold change of log2 ≥ 1 and p-value-log10 ≤ 0.05, which was represented by the vertical and horizontal dotted lines, respectively. Phosphorylation sites that were detected but did not show significant differences are shown as gray data points. (b) Validation of the phosphoproteomic data in B was performed by Western blot, using a phospho-specific antibody against p62-S272. Lysates of HCMV-infected normal HFF cells were submitted to SDS-PAGE, which was followed by Western blot analysis. The phosphorylation level of p62 at S272 was analyzed at 1, 3, and 6 d.p.i. GAPDH levels were used as loading control. One Western blot of two individual analyses is shown.
Figure 6
Figure 6
(a) Construction of different HCMV strains expressing p62-S272 mutants. The BAC technology was used to generate the mutant strains. All recombinant viruses were based on the HCMV parental strain BADwt. The gene region UL1-6 of the parental strain was replaced by the SQSTM1 gene, encoding the different mutations at the position 272 of SQSTM/p62 [serine (wt), alanine (A), or aspartate (D)]. The BACmids were reconstituted by transfection into HFFs, resulting in the viruses HCMV-p62-S272wt, HCMV-p62-S272A, and HCMV-p62-S272D. The expression of the gene was driven by the modified HCMV major immediate-early promotor (MIEP) with a non-functional cis-repressive sequence (crs) to allow a permanent expression of the respective SQSTM1 genes in infected cells. (b,c) Western blot analysis of the p62 levels in ko-SQSTM1 cells infected with different HCMV-SQSTM1-S272 strains. (b) Analysis of p62 levels in ko-SQSTM1 cells, infected with the different HCMV-SQSTM1-S272 strains (wt/A/D). HCMV-infected wild-type (wt) HFFs were used as a control for p62. Lysates of 5 d.p.i. infected cells were collected and analyzed by Western blot with an antibody directed against p62. Viral pp28 levels were used as infection control, GAPDH levels were used as loading control. One representative Western blot from two analyses is shown. (c) Analysis of the levels of phosphorylation of p62 at position 272, following infection of ko-SQSTM1 cells. Cells were infected as in (a) and harvested at 5 d.p.i. Samples were probed for the phosphorylation level of p62 at position 272, using a phospho-specific antibody. A representative Western blot from two analyses is shown.
Figure 7
Figure 7
(ac) Protein–protein interaction networks of the cellular interactors of p62 in dependence on the phosphorylation status at S272, analyzed in samples from co-immunoprecipitation analysis of HCMV-infected HFFs, using the STRING database (http://string-DBs.org, accessed on 10 August 2023). HFFs were infected with either HCMV-p62-S272wt, HCMV-p62-S272A, or HCMV-p62-S272D, respectively, using an m.o.i. of 0.5. Cells were collected at three d.p.i. p62 was immunoprecipitated using a receptor-specific antibody. The amount of p62 used for IP was adjusted to control for reduced steady-state levels of HCMV-p62-S272A-infected cells by using twice the number of lysed cells for IP against p62-S272A compared to p62-S272wt or p62-S272D. Each node represents a protein, and the red nodes represent a cluster of proteins, which are associated with the nuclear pore complex or with nucleocytoplasmic transport. The interaction network was generated with a high confidence interaction score (0.7). Networks of proteins that co-precipitated with p62-S272wt are shown in (a), those co-precipitated with p62-S272A are shown in (b), and those co-precipitated with p62-S272D are shown in (c).
Figure 8
Figure 8
Indirect immunofluorescence analysis of the localization of p62 in infected cells, depending on S272 phosphorylation. Cells were infected for six days and stained with antibodies against p62 (green) and pp150 (purple). DAPI was used to stain nuclei (blue).
Figure 9
Figure 9
Western blot analysis of the impact of S272 phosphorylation on the proteasomal and autolysosomal degradation of p62. (a) Western blot analysis of p62 levels, following 5-day infection of ko-SQSTM1 cells with respective HCMV-p62-S272 strains (wt/D/A) using an m.o.i. of 0.2. Cells were treated with 10 µM of the proteasomal inhibitor MG132 18 h before sample collection. The results of one of two individual experiments are shown. (b) Western blot analysis of p62 levels applying 200 µM of the lysosomal inhibitor bafilomycin A1 (BafA1) 4 h before cell harvest, n = 1. (a,b) Cell lysates were probed with antibodies against p62, GAPDH (loading control), and LC3B.
Figure 10
Figure 10
Analysis of HCMV protein expression, genome replication and progeny production in dependence on p62-272 phosphorylation. HFF-ko-SQSTM1 cells were infected with HCMV-p62-S272wt, HCMV-p62-S272A, and HCMV-p62-S272D strains, respectively, using an m.o.i. of 0.1. Cells and cell culture supernatants were collected at the indicated time points. (a) Quantitative PCR analysis of HCMV genome replication. The mean values of three technical replicates from three independent experiments are shown for each virus and time point. The corresponding SD is displayed as error bars. (b) Western blot analysis of the intracellular levels of selected viral proteins, following infection. Cells were harvested at 1, 3, and 6 d.p.i., lysed, and probed by Western blot, using antibodies against HCMV proteins MCP, pp150, pp28 and SCP. The levels of GAPDH were used as loading control. One out of two individual experiments is shown. (c) Viral progeny release, which is measured by the IE1 assay. The graph represents mean values of eight technical replicates from three independent experiments for each virus and time point. The mean values and corresponding SD are represented in a bar chart with error bars. Statistical analysis was performed utilizing Brown–Forsythe and Welch one-way ANOVA (not significant (ns): p > 0.05; *: p < 0.05. ****: p < 0.0001).

Similar articles

Cited by

References

    1. Paludan S.R., Pradeu T., Masters S.L., Mogensen T.H. Constitutive immune mechanisms: Mediators of host defence and immune regulation. Nat. Rev. Immunol. 2021;21:137–150. doi: 10.1038/s41577-020-0391-5. - DOI - PMC - PubMed
    1. Schilling E.M., Scherer M., Stamminger T. Intrinsic Immune Mechanisms Restricting Human Cytomegalovirus Replication. Viruses. 2021;13:179. doi: 10.3390/v13020179. - DOI - PMC - PubMed
    1. Chun Y., Kim J. Autophagy: An Essential Degradation Program for Cellular Homeostasis and Life. Cells. 2018;7:278. doi: 10.3390/cells7120278. - DOI - PMC - PubMed
    1. Parzych K.R., Klionsky D.J. An overview of autophagy: Morphology, mechanism, and regulation. Antioxid. Redox Signal. 2014;20:460–473. doi: 10.1089/ars.2013.5371. - DOI - PMC - PubMed
    1. Proulx J., Borgmann K., Park I.W. Role of Virally-Encoded Deubiquitinating Enzymes in Regulation of the Virus Life Cycle. Int. J. Mol. Sci. 2021;22:4438. doi: 10.3390/ijms22094438. - DOI - PMC - PubMed

Publication types