. 2024 Sep 10;16(9):1443.
doi: 10.3390/v16091443.

Dendritic Cells Pulsed with HAM/TSP Exosomes Sensitize CD4 T Cells to Enhance HTLV-1 Infection, Induce Helper T-Cell Polarization, and Decrease Cytotoxic T-Cell Response

Affiliations

Dendritic Cells Pulsed with HAM/TSP Exosomes Sensitize CD4 T Cells to Enhance HTLV-1 Infection, Induce Helper T-Cell Polarization, and Decrease Cytotoxic T-Cell Response

Julie Joseph et al. Viruses. .

Abstract

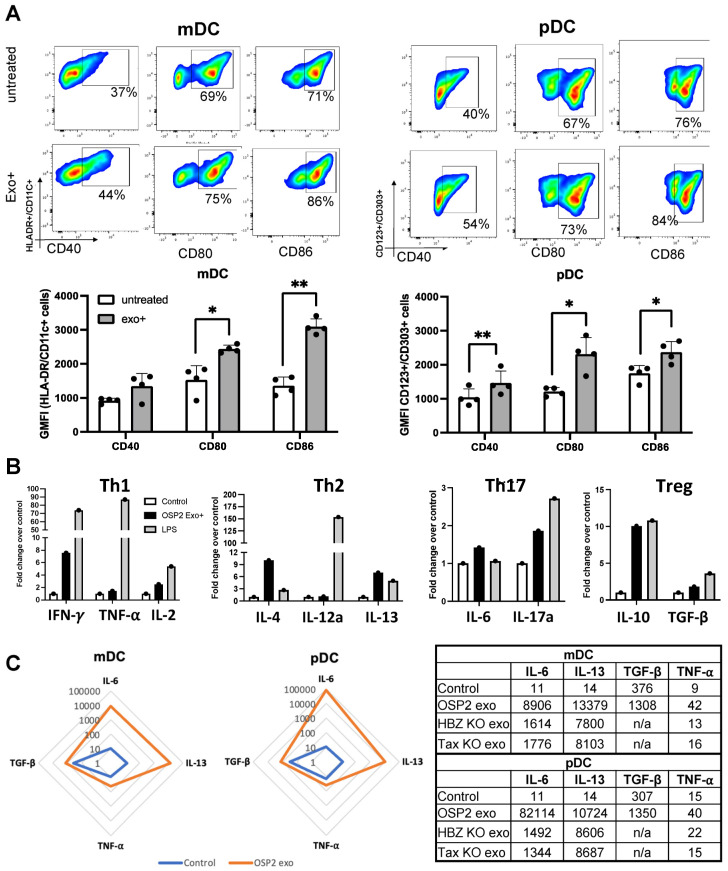
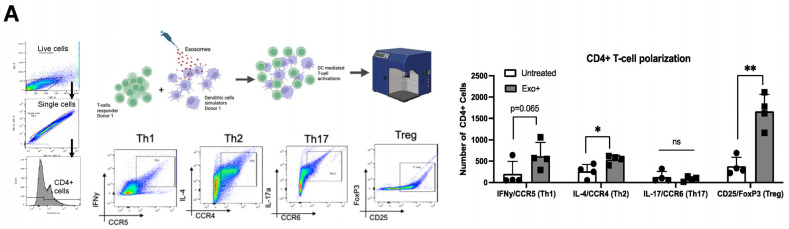
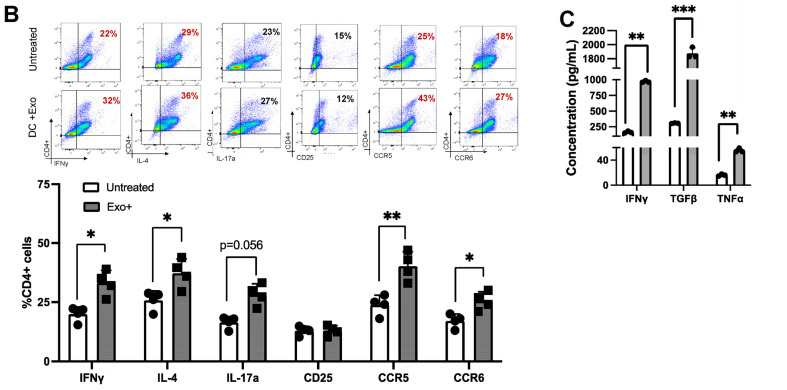
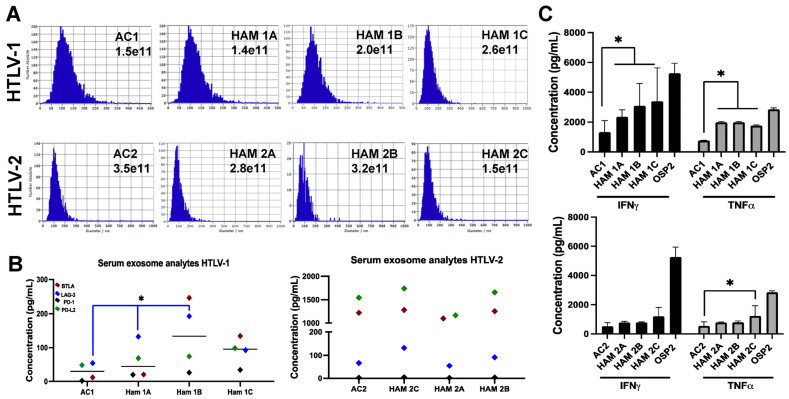
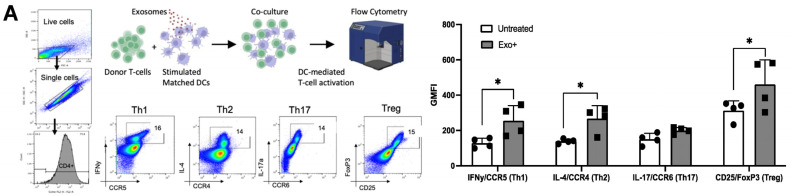
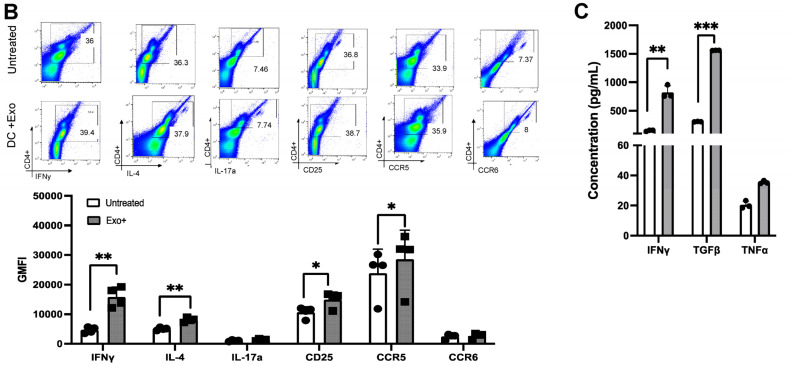
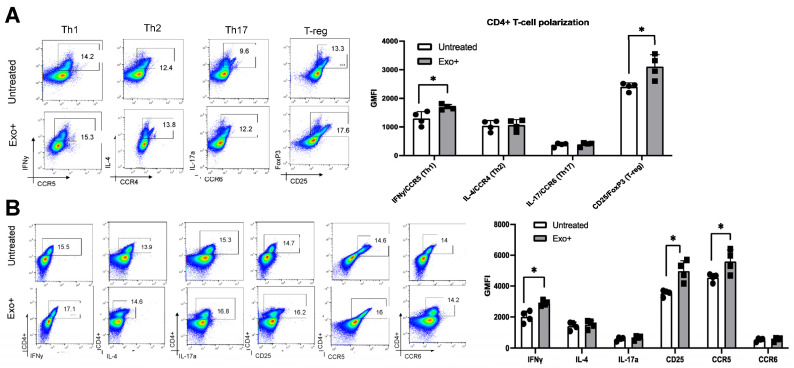
HTLV-1-associated myelopathy/tropical spastic paraparesis (HAM/TSP) is a progressive demyelinating disease of the spinal cord due to chronic inflammation. Hallmarks of disease pathology include dysfunctional anti-viral responses and the infiltration of HTLV-1-infected CD4+ T cells and HTLV-1-specific CD8+ T cells in the central nervous system. HAM/TSP individuals exhibit CD4+ and CD8+ T cells with elevated co-expression of multiple inhibitory immune checkpoint proteins (ICPs), but ICP blockade strategies can only partially restore CD8+ T-cell effector function. Exosomes, small extracellular vesicles, can enhance the spread of viral infections and blunt anti-viral responses. Here, we evaluated the impact of exosomes isolated from HTLV-1-infected cells and HAM/TSP patient sera on dendritic cell (DC) and T-cell phenotypes and function. We observed that exosomes derived from HTLV-infected cell lines (OSP2) elicit proinflammatory cytokine responses in DCs, promote helper CD4+ T-cell polarization, and suppress CD8+ T-cell effector function. Furthermore, exosomes from individuals with HAM/TSP stimulate CD4+ T-cell polarization, marked by increased Th1 and regulatory T-cell differentiation. We conclude that exosomes in the setting of HAM/TSP are detrimental to DC and T-cell function and may contribute to the progression of pathology with HTLV-1 infection.

Keywords: HAM/TSP; HTLV-1; T cells; dendritic cells; exosomes.


Conflict of interest statement

The authors declare no conflict of interest.

Figures

Figure 1
Figure 1
Exosomes activate and elicit proinflammatory responses in dendritic cells. (A) Representative phenotype of myeloid dendritic cell (mDC) and plasmacytoid dendritic cell (pDC) population differences with exosome stimulation (n = 4). GMFI levels of CD40, CD80, and CD86 in mDC and pDC populations untreated or stimulated with exosomes. Bars represent mean ± standard deviation (SD). (B) Expression of cytokines associated with Th1, Th2, Th17, and Treg polarization in total DCs stimulated with OSP2 cell-derived exosomes or LPS. Cytokines were grouped according to associated Th1 (IFN-γ, TNF-α, and IL-2), Th2 (IL-4, IL-12a, and IL-13), Th17 (IL-6 and IL-17a), and Treg (IL-10 and TGF-β) subsets. (C) Cytokine levels (pg/mL) in supernatants of mDCs (left) and pDCs (right) untreated or exosome-stimulated. Statistical differences were determined by one-way ANOVA, * p < 0.05, ** p < 0.005.
Figure 2
Figure 2
Dendritic cell-pulsed exosomes polarize T cells. (A) Exosome stimulation schematic and representative gating strategy. Donor CD3+ T cells and matched total DCs were isolated (n = 4). (B) DCs were exposed to OSP2-derived exosomes for 24 h and subsequently co-incubated with donor-matched T cells for another 24 h. Absolute count of CD4+ T-cells expressing subtype-associated markers: Th1 (IFN-γ, CCR5), Th2 (IL-4, CCR4), Th17 (IL-17, CCR6), and Treg (CD25, FoxP3). Quantification (pg/mL) of IFN-γ, TGF-β, and TNF-α cytokine levels in exosome-stimulated DC–T-cell co-culture (n = 3). (C) Representative flow plots and quantification (n = 4) of percent positive CD4+ T cells expressing functional markers of IFN-γ, IL-4, IL-17a, CD25, CCR5, and CCR6 after stimulation with OSP2 cell-derived exosomes. Bars represent mean ± standard deviation (SD). Statistical differences were determined by one-way ANOVA, * p < 0.05, ** p < 0.005, *** p < 0.001.
Figure 2
Figure 2
Dendritic cell-pulsed exosomes polarize T cells. (A) Exosome stimulation schematic and representative gating strategy. Donor CD3+ T cells and matched total DCs were isolated (n = 4). (B) DCs were exposed to OSP2-derived exosomes for 24 h and subsequently co-incubated with donor-matched T cells for another 24 h. Absolute count of CD4+ T-cells expressing subtype-associated markers: Th1 (IFN-γ, CCR5), Th2 (IL-4, CCR4), Th17 (IL-17, CCR6), and Treg (CD25, FoxP3). Quantification (pg/mL) of IFN-γ, TGF-β, and TNF-α cytokine levels in exosome-stimulated DC–T-cell co-culture (n = 3). (C) Representative flow plots and quantification (n = 4) of percent positive CD4+ T cells expressing functional markers of IFN-γ, IL-4, IL-17a, CD25, CCR5, and CCR6 after stimulation with OSP2 cell-derived exosomes. Bars represent mean ± standard deviation (SD). Statistical differences were determined by one-way ANOVA, * p < 0.05, ** p < 0.005, *** p < 0.001.
Figure 3
Figure 3
Immune checkpoint and anti-viral cytokine expression of exosomes from individuals with HAM/TSP. (A) Representative NTA of exosomes isolated from asymptomatic carrier (AC, n = 1) and HAM/TSP (HAM, n = 3) patient sera in individuals infected with HTLV-1 or HTLV-2. (B) Quantification of immune checkpoint proteins BTLA, LAG-3, PD-1, and PD-L2 in exosomes from AC and HAM/TSP patient sera from individuals infected with HTLV-1, left, or HTLV-2, right. (C) Quantification of IFN-γ and TNF-α levels in exosomes from AC and HAM/TSP patient sera from individuals infected with HTLV-1, left, or HTLV-2, right. Bars represent mean ± standard deviation (SD). Statistical differences were determined by unpaired two-tailed T-tests of technical replicates, * p < 0.05.
Figure 4
Figure 4
HAM/TSP exosomes skew Th1/Treg responses and sensitize cells toward infection. (A) Exosome stimulation schematic and representative gating strategy. CD3+ T cells and total DCs were isolated from matched donors (n = 4). DCs were stimulated with exosomes from HTLV-1 patient sera for 24 h and subsequently co-incubated with donor-matched T cells for another 24 h. Differences in GMFI of representative markers are plotted. Bottom, absolute count of CD4+ T cells expressing subtype-associated markers: Th1 (IFN-y and CCR5), Th2 (IL-4 and CCR4), Th17 (IL-17 and CCR6), and Treg (CD25 and FoxP3). (B) Quantification (pg/mL) of IFN-γ, TGF-β, and TNF-α cytokine levels in patient exosome-stimulated DC–T-cell co-culture. (C) Representative flow plots and quantification (n = 4) of percent positive CD4+ T cells expressing functional markers of IFN-γ, IL-4, IL-17a, CD25, CCR5, and CCR6 after stimulation with HTLV-1 patient-derived exosomes. Bars represent mean ± standard deviation (SD). Statistical differences were determined by one-way ANOVA, * p < 0.05, ** p < 0.005, *** p < 0.001.
Figure 4
Figure 4
HAM/TSP exosomes skew Th1/Treg responses and sensitize cells toward infection. (A) Exosome stimulation schematic and representative gating strategy. CD3+ T cells and total DCs were isolated from matched donors (n = 4). DCs were stimulated with exosomes from HTLV-1 patient sera for 24 h and subsequently co-incubated with donor-matched T cells for another 24 h. Differences in GMFI of representative markers are plotted. Bottom, absolute count of CD4+ T cells expressing subtype-associated markers: Th1 (IFN-y and CCR5), Th2 (IL-4 and CCR4), Th17 (IL-17 and CCR6), and Treg (CD25 and FoxP3). (B) Quantification (pg/mL) of IFN-γ, TGF-β, and TNF-α cytokine levels in patient exosome-stimulated DC–T-cell co-culture. (C) Representative flow plots and quantification (n = 4) of percent positive CD4+ T cells expressing functional markers of IFN-γ, IL-4, IL-17a, CD25, CCR5, and CCR6 after stimulation with HTLV-1 patient-derived exosomes. Bars represent mean ± standard deviation (SD). Statistical differences were determined by one-way ANOVA, * p < 0.05, ** p < 0.005, *** p < 0.001.
Figure 5
Figure 5
HAM/TSP exosomes skew T cells to Th1/Treg profiles in patient PBMCs. (A) Representative flow plots and quantification (n = 4) of the polarization of T cells from individuals with HTLV-1 with or without HTLV-1 sera-derived exosomes. (B) Representative flow plots and quantification (n = 4) of HTLV-1-infected patient CD4+ T cells with or without HTLV-1 sera-derived exosome stimulation. Bars represent mean ± standard deviation (SD). Statistical differences were determined by one-way ANOVA, * p < 0.05.
Figure 6
Figure 6
Exosomes diminish CD8+ T-cell activity. (A) Schematic of treatment and gating strategy of CD8+ T cells. CD3+ T cells and total DCs were isolated from matched donors (n = 4). DCs were stimulated with OSP2-derived exosomes for 24 h and subsequently co-incubated with donor-matched T cells for another 24 h. Absolute counts of CD8+ T cells expressing MIP-1a, Granzyme B, Perforin, IFN-γ, PD-1, and Ki67 after co-incubation with exosome-pulsed DCs. (B) Absolute counts of CD8+ T cells after CD3+/CD28+ activation and stimulation with OSP2 exosomes alone, or exosomes incubated with a cocktail of anti-PD-L2, anti-BTLA, anti-LAG-3, and anti-PD-1 blocking antibodies. (C) Absolute counts of CD8+ T cells expressing MIP-1a, Granzyme B, Perforin, IFN-γ, PD-1, and Ki67 in HTLV-1-infected patient T cells (n = 4) stimulated with patient sera exosomes alone or exosomes incubated with a cocktail of anti-PD-L2, anti-BTLA, anti-LAG-3, and anti-PD-1 blocking antibodies. Counts were determined by experiments with n = 3/4 healthy donors, and error bars represent SEM of donor variation. Bars represent mean ± standard deviation (SD). Statistical differences were determined by one-way ANOVA. (D) Western blot and densitometry of CD3/CD28-stimulated T cells treated with Jurkat and OSP2 exosomes alone, or exosomes incubated with a cocktail of anti-PD-L2, anti-BTLA, anti-LAG-3, and anti-PD-1 blocking antibodies. Blot was probed for phosphorylated AKT or ERK. Error bars represent SEM of blot variation; statistical differences were determined by paired two-tailed T-test, * p < 0.05.

Similar articles

Cited by

References

    1. Araujo A., Bangham C.R.M., Casseb J., Gotuzzo E., Jacobson S., Martin F., Penalva de Oliveira A., Puccioni-Sohler M., Taylor G.P., Yamano Y. Management of HAM/TSP: Systematic Review and Consensus-based Recommendations 2019. Neurol. Clin. Pract. 2021;11:49–56. doi: 10.1212/CPJ.0000000000000832. - DOI - PMC - PubMed
    1. Clements D.M., Crumley B., Chew G.M., Davis E., Bruhn R., Murphy E.L., Ndhlovu L.C., Jain P. Phenotypic and Functional Analyses Guiding Combination Immune Checkpoint Immunotherapeutic Strategies in HTLV-1 Infection. Front. Immunol. 2021;12:608890. doi: 10.3389/fimmu.2021.608890. - DOI - PMC - PubMed
    1. Barber D.L., Wherry E.J., Masopust D., Zhu B., Allison J.P., Sharpe A.H., Freeman G.J., Ahmed R. Restoring function in exhausted CD8 T cells during chronic viral infection. Nature. 2006;439:682–687. doi: 10.1038/nature04444. - DOI - PubMed
    1. Wherry E.J., Ha S.J., Kaech S.M., Haining W.N., Sarkar S., Kalia V., Subramaniam S., Blattman J.N., Barber D.L., Ahmed R. Molecular signature of CD8+ T cell exhaustion during chronic viral infection. Immunity. 2007;27:670–684. doi: 10.1016/j.immuni.2007.09.006. - DOI - PubMed
    1. Kamphorst A.O., Wieland A., Nasti T., Yang S., Zhang R., Barber D.L., Konieczny B.T., Daugherty C.Z., Koenig L., Yu K., et al. Rescue of exhausted CD8 T cells by PD-1-targeted therapies is CD28-dependent. Science. 2017;355:1423–1427. doi: 10.1126/science.aaf0683. - DOI - PMC - PubMed

Publication types

MeSH terms

LinkOut - more resources