. 2024 Sep 11;16(9):1449.
doi: 10.3390/v16091449.

Mapping Transmission Dynamics and Drug Resistance Surveillance in the Cyprus HIV-1 Epidemic (2017-2021)

Affiliations

Mapping Transmission Dynamics and Drug Resistance Surveillance in the Cyprus HIV-1 Epidemic (2017-2021)

Cicek Topcu et al. Viruses. .

Abstract

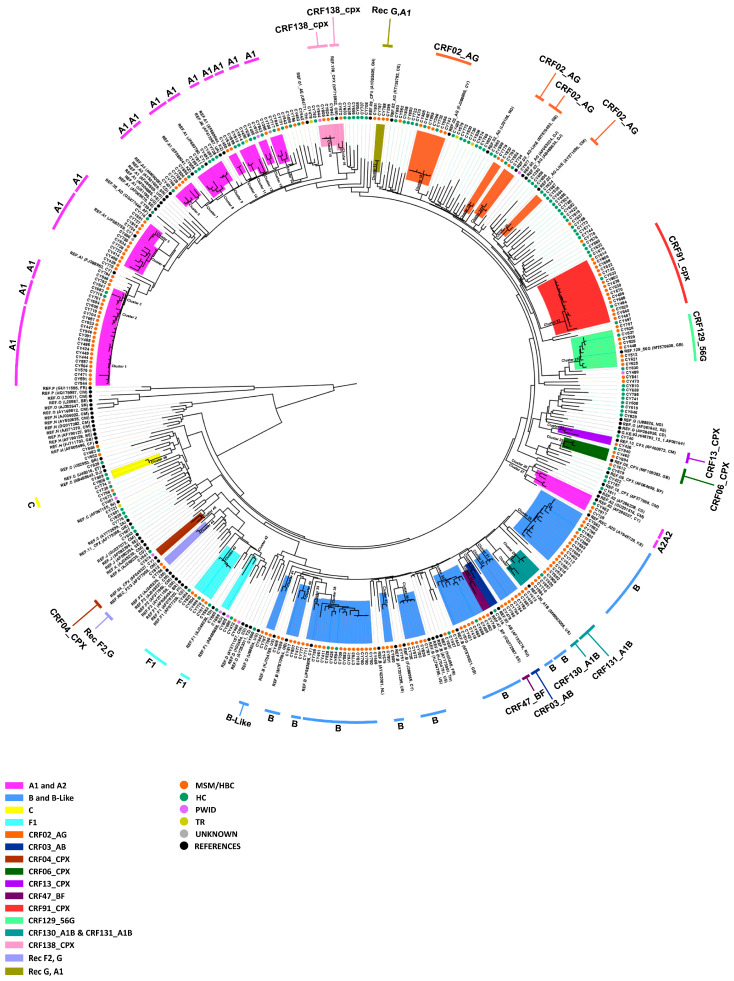
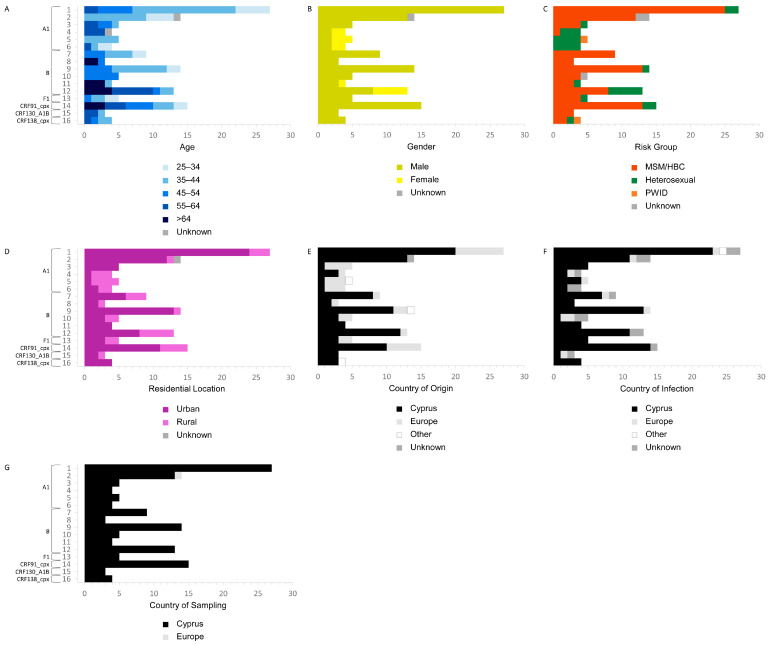
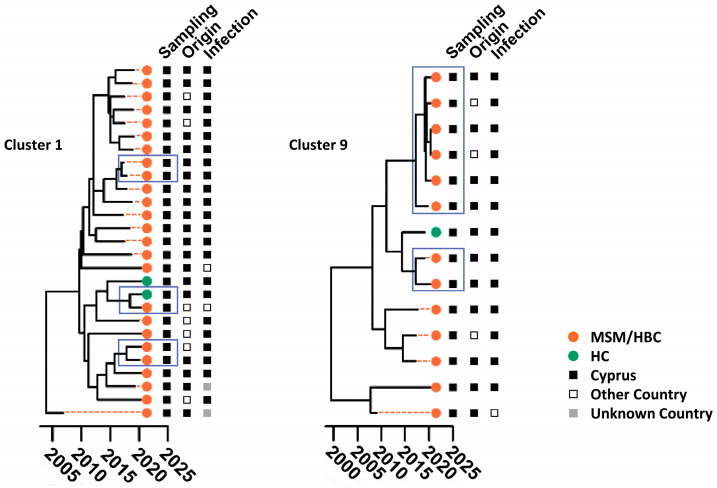
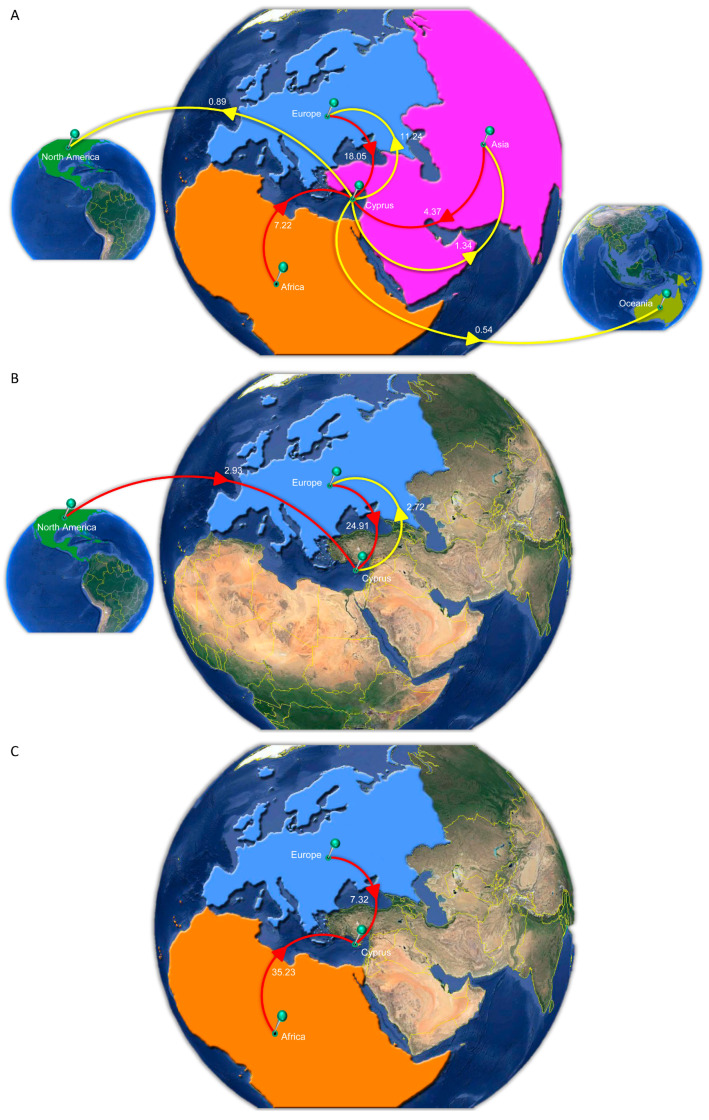
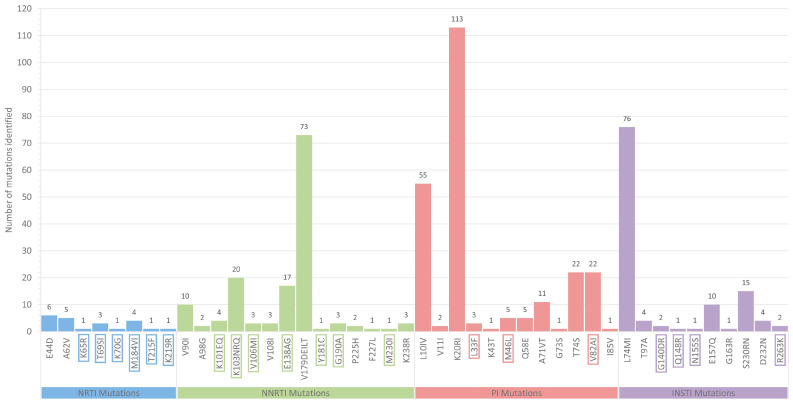
The human immunodeficiency virus type 1 (HIV-1) epidemic has been a major public health threat on a global scale since the early 1980s. Despite the introduction of combination antiretroviral therapy (cART), the incidence of new HIV-1 infections continues to rise in some regions around the world. Thus, with the continuous transmission of HIV-1 and the lack of a cure, it is imperative for molecular epidemiological studies to be performed, to monitor the infection and ultimately be able to control the spread of this virus. This work provides a comprehensive molecular epidemiological analysis of the HIV-1 infection in Cyprus, through examining 305 HIV-1 sequences collected between 9 March 2017 and 14 October 2021. Employing advanced statistical and bioinformatic techniques, the research delved deeply into understanding the transmission dynamics of the HIV-1 epidemic in Cyprus, as well as the monitoring of HIV-1's genetic diversity and the surveillance of transmitted drug resistance. The characterization of Cyprus's HIV-1 epidemic revealed a diverse landscape, comprising 21 HIV-1 group M pure subtypes and circulating recombinant forms (CRFs), alongside numerous uncharacterized recombinant strains. Subtypes A1 and B emerged as the most prevalent strains, followed by CRF02_AG. The findings of this study also revealed high levels of transmitted drug resistance (TDR) patterns, raising concerns for the efficacy of cART. The demographic profiles of individuals involved in HIV-1 transmission underscored the disproportionate burden borne by young to middle-aged Cypriot males, particularly those in the MSM community, who reported contracting the virus in Cyprus. An assessment of the spatiotemporal evolutionary dynamics illustrated the global interconnectedness of HIV-1 transmission networks, implicating five continents in the dissemination of strains within Cyprus: Europe, Africa, Asia, North America, and Oceania. Overall, this study advances the comprehension of the HIV-1 epidemic in Cyprus and highlights the importance of understanding HIV-1's transmission dynamics through continuous surveillance efforts. Furthermore, this work emphasizes the critical role of state-of-the-art bioinformatics analyses in addressing the challenges posed by HIV-1 transmission globally, laying the groundwork for public health interventions aimed at curbing its spread and improving patient outcomes.

Keywords: Cyprus; HIV-1 molecular epidemiology; HIV-1 phylodynamics; HIV-1 phylogenetics; HIV-1 phylogeographics; HIV-1 transmitted drug resistance; human immunodeficiency virus type 1 (HIV-1).


Conflict of interest statement

The authors declare no conflicts of interest. The funders had no role in the design of the study; in the collection, analyses, or interpretation of the data; in the writing of the manuscript; or in the decision to publish the results.

Figures

Figure 1
Figure 1
Maximum likelihood (ML) phylogenetic tree analyses of 305 HIV-1 pol region nucleotide sequences sampled between 9 March 2017 and 14 October 2021 in Cyprus. The nucleotide sequences were isolated from 305 people with HIV-1 (PWH) and residing in Cyprus at the time of sampling. The phylogenetic analyses were conducted against a comprehensive reference data set encompassing all known HIV-1 group M subtypes (A, B, C, D, F, G, H, J, K, and L) and circulating recombinant forms (CRFs) (RIP Alignment 2020) sourced from the Los Alamos HIV Sequence Database (http://www.hiv.lanl.gov (accessed on 12 February 2024)). Additionally, the reference data set was augmented through Basic Local Alignment Search Tool (BLAST) analyses using the HIV BLAST tool available through the Los Alamos HIV Sequence Database (www.hiv.lanl.gov/content/sequence/BASIC_BLAST/basic_blast.html (accessed on 12 February 2024)). The molecular clusters were defined based on previously established parameters of a genetic distance threshold of 0.045 and a bootstrap support threshold of 70%. The colored circles at the tips of the branches denote the respective risk factor and reference sequence associated with each HIV-1 subtype and CRF. Moreover, the identified HIV-1 molecular clusters are distinctly highlighted and color-coded at the periphery of the phylogenetic tree, in accordance with the HIV-1 genotypic subtypes determined by the REGA HIV-1 subtyping tool, version 3.0 (REGA 3.0) [31]. Each designated subtype is labeled adjacent to its corresponding HIV-1 molecular cluster. The acronyms used in the figure are as follows: MSM, men who have sex with men; HBC, homo-/bisexual contact; HC, heterosexual contact; PWID, people who inject drugs; TR, blood transfusion.
Figure 2
Figure 2
Time-scaled migration history derived from data sets utilized to reconstruct the spread history of (A) subtype A1, (B) subtype B, and (C) CRF02_AG. The gray tips correspond to reference sequences obtained from NCBI GenBank (accessed on 22 February 2024) [42]. Sequences that are part of a transmission cluster are indicated by dark pink squares (subtype A1) and dark green squares (subtype B) and cohort sequences that are not part of a transmission cluster by light pink circles (subtype A1), light green circles (subtype B) and blue circles (CRF02_AG).
Figure 2
Figure 2
Time-scaled migration history derived from data sets utilized to reconstruct the spread history of (A) subtype A1, (B) subtype B, and (C) CRF02_AG. The gray tips correspond to reference sequences obtained from NCBI GenBank (accessed on 22 February 2024) [42]. Sequences that are part of a transmission cluster are indicated by dark pink squares (subtype A1) and dark green squares (subtype B) and cohort sequences that are not part of a transmission cluster by light pink circles (subtype A1), light green circles (subtype B) and blue circles (CRF02_AG).
Figure 3
Figure 3
Identification of transmission clusters (TCs). The figure illustrates the identification of TCs based on stringent criteria, with a posterior support threshold of 90% and a minimum proportionate time spent in trait of 90%. Based on these criteria, sixteen distinct TCs have been discerned in this analysis: six attributed to subtype A1 (clusters 1–6), six to subtype B (clusters 7–12), and one each for subtypes F1 (cluster 13), CRF91_cpx (clusters 14–15), CRF130_A1B (cluster 16), and CRF138_cpx (cluster 17). Notably, the examination of recombinant strains entailed the separate analysis of non-recombinant regions. This approach led to the detection of two transmission clusters within the CRF02_AG (cluster 14) and subtype G (cluster 15) regions of the CRF91_cpx strain. Each TC is systematically numbered based on the associated HIV-1 subtype, with further categorization reflecting the decreasing prevalence of men who have sex with men (MSM) within the clusters of each subtype. Active TCs are distinctly highlighted in light blue, while clusters exhibiting ongoing activity within the past five years are delineated by dark blue rectangles, providing a temporal context for the depth of each cluster. The visual representation is enriched by the incorporation of colored circles at the tree tips, denoting the risk group, while squares symbolize the country of sampling (refer to the color code at the bottom of the figure). The acronyms used in the figure are as follows: MSM, men who have sex with men; HBC, homo-/bisexual contact; HC, heterosexual contact; PWID, people who inject drugs.
Figure 4
Figure 4
A comprehensive depiction of the epidemiological and demographic attributes associated with the identified transmission clusters (TCs). Within each TC, detailed insights are offered into the epidemiological information, including the (A) age distribution, (B) gender composition, (C) risk group affiliations, and demographic features, including the (D) residential location, (E) country of origin, (F) country of infection, and (G) country of sampling. The color coding is described below each graphical scheme. The acronyms used in the figure are as follows: MSM, men who have sex with men; HBC, homo-/bisexual contact; PWID, people who inject drugs.
Figure 5
Figure 5
Transmission clusters (TCs) of subtypes A1 and B. The largest TCs associated with the two most prevalent HIV-1 subtypes in Cyprus, subtype A1 (Cluster 1) and subtype B (Cluster 9), are illustrated. Clusters exhibiting ongoing activity within the past five years are delineated by dark blue rectangles, providing a temporal context for the depth of each cluster. The visual representation is enriched by the incorporation of colored circles at the tree tips, denoting the risk group, while squares symbolize the country of sampling, country of origin, and country of infection, respectively (refer to the color code at the bottom of the figure). The acronyms used in the figure are as follows: MSM, men who have sex with men; HBC, homo-/bisexual contact; HC, heterosexual contact.
Figure 6
Figure 6
Cartographic representation of the transmission dynamics of HIV-1 (A) subtype A1, (B) subtype B, and (C) CRF02_AG between Cyprus and other continents. The geographic origins of these HIV-1 strains imported into Cyprus are depicted with red lines, while exports from Cyprus to other continents are illustrated with yellow lines. Continents serving as either “sources” or “sinks” for the transmission of these HIV-1 strains are highlighted and labeled accordingly. Additionally, the figure provides estimates of the average number of migration events between continents, offering insights into the intercontinental dissemination patterns. Map images courtesy of Google Earth Pro 7.3.2.5776 and 7.3.4.8642 (14 December 2015). Global view centered on North and South America (left), 5°49′53.21″ N 81°12′52.44″ W, Eye alt 9503.85 km. Europe (middle), 36°16′38.78″ N 36°07′29.71″ E, Eye alt 7949.12 km. South-Eastern Asia and Oceania (right), 1°14′19.88″ N 112°15′56.16″ E, Eye alt 11201.60 km. US Dept. of State Geographer, DATA SIO, NOAA, U.S. Navy, NGA, and GEBCO. Image Landsat/Copernicus. 2018 and 2023 © Google. https://www.google.com/earth/versions/#earth-pro (accessed on 10 April 2019 and 16 July 2023).
Figure 7
Figure 7
The overall prevalence of drug resistance-associated mutations identified among 305 HIV-1 pol region nucleotide sequences sampled between 9 March 2017 and 14 October 2021 in Cyprus. The graphical demonstration denotes the drug resistance-associated mutations identified within the protease, reverse transcriptase, and integrase (PR, RT, and IN) domains of HIV-1 group M subtypes, circulating recombinant forms (CRF), and recombinant strains, using the HIVdb Program of the Stanford University HIV Drug Resistance Database [32]. The x-axis delineates the drug resistance-associated mutations pertaining to the nucleoside reverse transcriptase inhibitors (NRTIs), non-nucleoside reverse transcriptase inhibitors (NNRTIs), protease inhibitors (PIs), and integrase strand transfer inhibitors (INSTIs). Each mutation identified against these classes of antiretroviral drugs is visually represented with distinct color coding: NRTI mutations are depicted in blue, NNRTI mutations in green, PI mutations in pink, and INSTI mutations in purple. The y-axis quantifies the frequency of occurrence for each mutation within the cohort, as denoted by the numerical values positioned atop each bar. Notably, mutations encased within rectangular boxes signify major drug resistance mutations, as defined by the Stanford University HIV Drug Resistance Database, while those not contained within these boxes are designated as accessory drug resistance mutations [64]. This classification scheme aids in discerning mutations of greater clinical significance from those with potentially lesser impacts on the drug resistance profiles.
Figure 8
Figure 8
The overall prevalence of drug resistance levels against commercially available antiretroviral drugs identified among 305 HIV-1 pol region nucleotide sequences sampled between 9 March 2017 and 14 October 2021, in Cyprus. The graphical illustration delineates the extent of drug resistance against antiretroviral drugs categorized into (A) nucleoside reverse transcriptase inhibitors (NRTIs), (B) non-nucleoside reverse transcriptase inhibitors (NNRTIs), (C) protease inhibitors (PIs), and (D) integrase strand transfer inhibitors (INSTIs). The drug resistance levels are predicated on the drug resistance-associated mutations within the protease, reverse transcriptase, and integrase (PR, RT, and IN) domains of HIV-1 group M subtypes, circulating recombinant forms (CRF), and recombinant strains and were identified using the HIVdb Program of the Stanford University HIV Drug Resistance Database [32]. The four distinct levels of drug resistance, namely potential low-level resistance, low-level resistance, intermediate resistance, and high-level resistance, are visually represented with increasing intensity in color. Each level is color-coded to provide a clear representation of the escalating severity of the resistance. Across each graphical demonstration, the x-axis delineates the level of drug resistance against the commercially available antiretroviral drugs, while the y-axis quantifies the frequency of occurrence for each resistance level pertaining to each antiretroviral drug.

Similar articles

References

    1. World Health Organization (WHO) HIV: Global Situation and Trends. [(accessed on 24 January 2023)]. Available online: https://www.who.int/data/gho/data/themes/hiv-aids#:~:text=Sincethebeginn....
    1. HIV and AIDS Resources (HIV.gov) A Timeline of HIV and AIDS. [(accessed on 26 January 2023)]; Available online: https://www.hiv.gov/hiv-basics/overview/history/hiv-and-aids-timeline#ye....
    1. Joint United Nations Programme on HIV/AIDS (UNAIDS) UNAIDS Global HIV & AIDS Statistics—Fact Sheet. [(accessed on 20 January 2023)]. Available online: https://www.unaids.org/sites/default/files/media_asset/UNAIDS_FactSheet_....
    1. The HIV-CAUSAL Collaboration The effect of combined antiretroviral therapy on the overall mortality of HIV-infected individuals. AIDS. 2010;24:123–137. doi: 10.1097/QAD.0b013e3283324283. - DOI - PMC - PubMed
    1. May M.T., Gompels M., Delpech V., Porter K., Orkin C., Kegg S., Hay P., Johnson M., Palfreeman A., Gilson R., et al. Impact on life expectancy of HIV-1 positive individuals of CD4+ cell count and viral load response to antiretroviral therapy. AIDS. 2014;28:1193–1202. doi: 10.1097/QAD.0000000000000243. - DOI - PMC - PubMed

Publication types

MeSH terms

Substances

Associated data