. 2024 Sep 17;16(9):1473.
doi: 10.3390/v16091473.

Multiplex Microscopy Assay for Assessment of Therapeutic and Serum Antibodies against Emerging Pathogens

Affiliations

Multiplex Microscopy Assay for Assessment of Therapeutic and Serum Antibodies against Emerging Pathogens

Nuno Sartingen et al. Viruses. .

Abstract

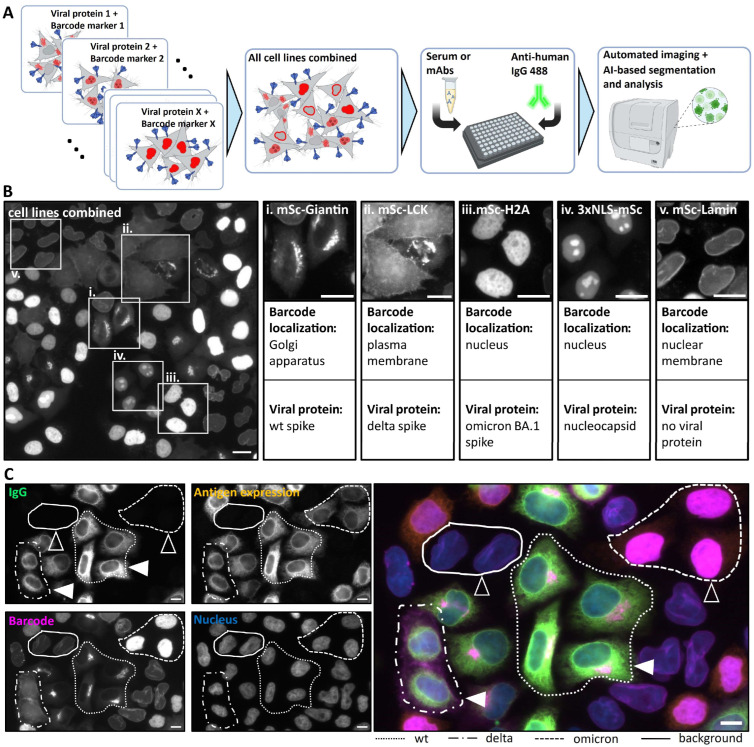
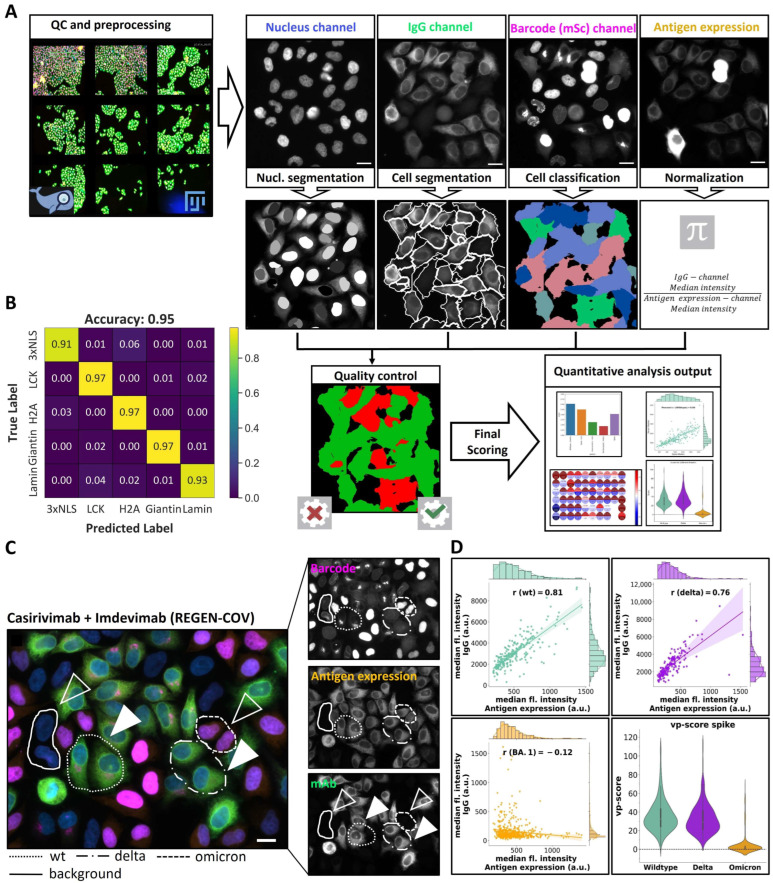
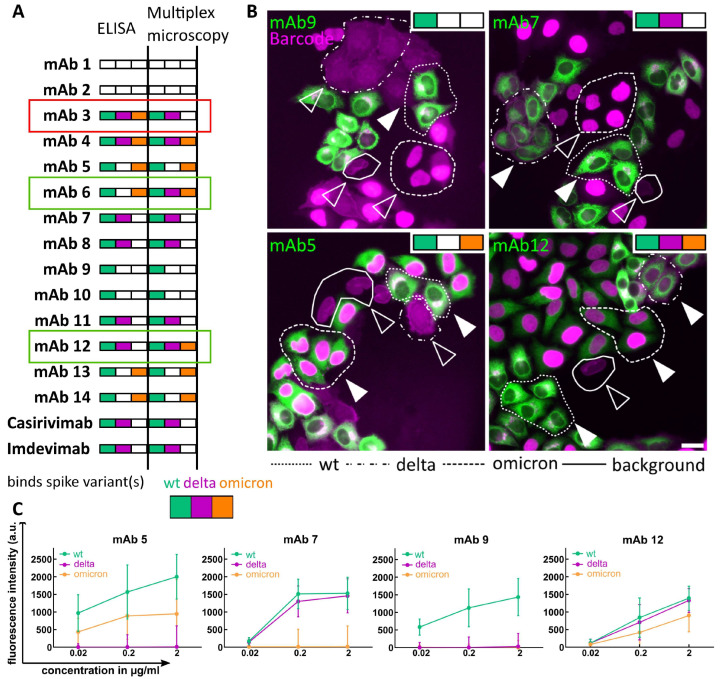
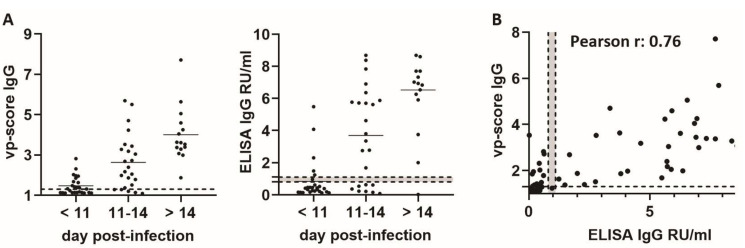
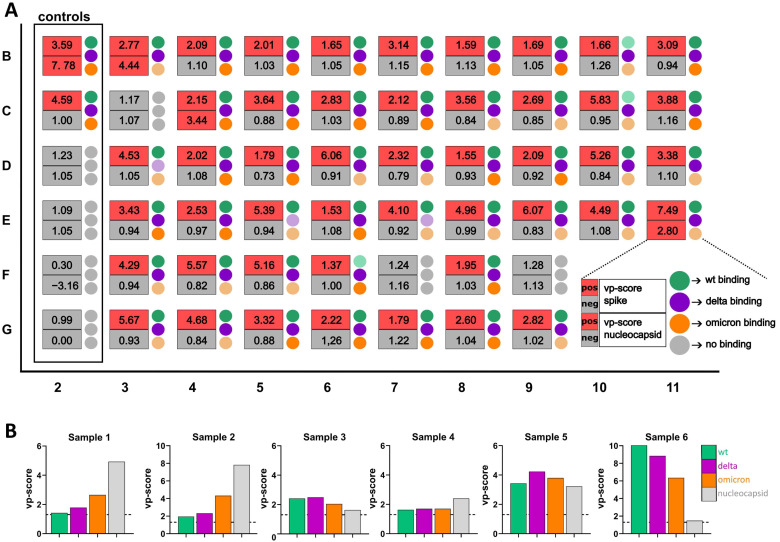
The emergence of novel pathogens, exemplified recently by the severe acute respiratory syndrome coronavirus 2 (SARS-CoV-2), highlights the need for rapidly deployable and adaptable diagnostic assays to assess their impact on human health and guide public health responses in future pandemics. In this study, we developed an automated multiplex microscopy assay coupled with machine learning-based analysis for antibody detection. To achieve multiplexing and simultaneous detection of multiple viral antigens, we devised a barcoding strategy utilizing a panel of HeLa-based cell lines. Each cell line expressed a distinct viral antigen, along with a fluorescent protein exhibiting a unique subcellular localization pattern for cell classification. Our robust, cell segmentation and classification algorithm, combined with automated image acquisition, ensured compatibility with a high-throughput approach. As a proof of concept, we successfully applied this approach for quantitation of immunoreactivity against different variants of SARS-CoV-2 spike and nucleocapsid proteins in sera of patients or vaccinees, as well as for the study of selective reactivity of monoclonal antibodies. Importantly, our system can be rapidly adapted to accommodate other SARS-CoV-2 variants as well as any antigen of a newly emerging pathogen, thereby representing an important resource in the context of pandemic preparedness.

Keywords: SARS-CoV-2; emerging pathogens; machine learning; monoclonal antibodies; multiplex microscopy; serology.


Conflict of interest statement

The authors declare no conflicts of interest. The funders had no role in the design of the study; in the collection, analyses, or interpretation of data; in the writing of the manuscript; or in the decision to publish the results.

Figures

Figure 1
Figure 1
Principle of the multiplex microscopy serology assay. (A) Scheme of the multiplex assay workflow. Red structures represent fluorescent barcode proteins at different intracellular localizations, blue arrowhead-shaped structures represent viral proteins. (B) Cell lines transduced with different barcoding constructs and corresponding viral proteins were pooled and an overview image in the mScarlet channel was acquired. White boxes labeled with roman numbers mark the magnified areas showing cells with different subcellular localization patterns. Barcode localization and the corresponding viral protein are indicated below each image. (C) Images show results obtained using REGEN-COV therapeutic Ab on combined cell lines. Individual channels —“IgG channel” (represents REGEN-COV Ab binding, green), “Barcode channel” (represents viral antigen identity, magenta), “Antigen expression channel” (obtained by pan-specific anti-spike antibody staining and represents the expression levels of different spike variants, orange), “Nucleus channel” (obtained by Hoechst staining, blue) and an overlay image are shown. Cells expressing different variants are marked with different dashed line patterns (shown at the bottom of the image panel). Filled arrowheads indicate cells where REGEN-COV mAb binding can be detected, the empty arrowheads indicate those lacking detectable mAb binding. Scale bar = 10 µm.
Figure 2
Figure 2
Image analysis and quantification pipeline. (A) Schematic overview of the image segmentation and classification workflow. A visual inspection of raw data (optional) and analysis results was conducted using FIJI [44] and MoBIE [33] software. Four channels were used for indicated purposes, and a final automated quality control was applied as described in the Materials and Methods section before computing the final scores. (B) Performance of the cell classification machine-learning model measured by confusion matrix showing the true cellular identity (True Label (manually classified), vertical) compared to predicted cellular identity (Predicted Label, horizontal). Color code (shown on the right) represents the fraction of classified cells in an indicated category. (C) Images show results obtained using REGEN-COV therapeutic Ab on pooled cell lines. Individual channels (“IgG” (green), “Barcode (mScarlet)” (magenta) and “Antigen expression” (orange)) and overlay are shown. Cells expressing different variants are marked with different dashed line patterns (shown at the bottom of the image panel). Filled arrowheads indicate cells where REGEN-COV mAb binding can be detected, and empty arrowheads indicate cells lacking detectable mAb binding. Scale bar = 10 µm. (D) Quantification of REGEN-COV mAb binding using the pipeline shown in A. Graphs show a correlation analysis for wild-type (green), delta (magenta) and omicron BA.1 (orange) spike variants between mAb binding quantified by median fluorescence intensity in “IgG channel” per cell and antigen expression quantified by median fluorescence intensity in “Antigen expression channel” per cell. Histograms on the vertical and horizontal axis represent the frequency of cells with indicated intensity values. Pearson correlation coefficient (r) is indicated within the plot area. Violin plots on the bottom right illustrate vp-score distributions for wt, delta, and omicron (BA.1) variants, where the shape of each violin represents the distribution of vp-scores, and the white dot within each plot indicates median vp-score.
Figure 3
Figure 3
Assessment of mAb binding to different spike variants. (A) Qualitative comparison of differential mAb binding to different spike variants between ELISA (data from Wang et al. [29]) and the multiplex microscopy approach. Colored boxes (green (wt), magenta (delta) and orange (omicron)) indicate detected binding; white box: no binding. mAbs exhibiting some discrepancy between methods are marked with red (microscopy assay not detecting variant binding) and green (those where additional variant binding was detected by microscopy) boxes. Binding was evaluated as positive if median fluorescence intensity in the “IgG channel” was above 150 and more than three times higher than Casirivimab and Imdevimab binding to the omicron variant (negative control). (B) Representative images showing overlay of the indicated mAb and Barcode channels, illustrating differential spike binding specificity. Color bar in the top left corner indicates binding to the respective variant, and the gray box indicates no binding. Filled arrowheads: mAb binding detected; empty arrowheads: cells lacking detectable mAb binding. Scale bar = 10 µm. (C) Examples of quantitative data derived from results shown in B. Background-subtracted median fluorescence intensities are plotted against mAb concentration. Error bars show the standard deviation of median intensity values.
Figure 4
Figure 4
Comparison of multiplex microscopy assay and ELISA in the detection of SARS-CoV-2 spike antibodies in patient sera. (A) Samples from the positive control cohort have been stratified into three groups based on the day post-infection and analyzed by multiplex microscopy assay (left) and ELISA (right). Each dot represents one serum sample. Line = mean value; (B) correlation between vp-score obtained by multiplex microscopy assay and ELISA measurements; dotted line at 1.3 for vp-score = empirically determined cut-off value used to classify sera as negative or positive; dotted lines with gray area between 0.8 and 1.1 RU/mL in ELISA plots represent borderline situations where sera cannot be classified as positive or negative according to the manufacturer’s protocol.
Figure 5
Figure 5
Analysis of the serological status of vaccinated and omicron-infected individuals. (A) Exemplary data showing the multiplex microscopy results of sera obtained from 50 vaccinees in the multi-well plate. The cells in the first column (2) are used as controls and are incubated with sera obtained from SARS-CoV-2-infected and -vaccinated individuals (wells B2 and C2, positive controls), pre-pandemic sera (wells D2 and E2, negative controls) and no sera (wells F2 and G2, background and bleed through control wells). The numbers in each box show the vp-score for spike binding (upper number, red = positive (vp > 1.3), gray = negative) and nucleocapsid binding (lower number, red = positive (vp > 1.5), gray = negative. The colored circles on the side of each box represent binding to different spike variants (green (wt), magenta (delta), orange (omicron) and gray (no binding). Dim color represents at least 15% weaker binding to the indicated variant compared to the variant where the strongest binding was measured. (B) Bar graphs show the vp-scores for different spike variants (green (wt), magenta (delta), orange (omicron)) and the nucleocapsid (gray) of omicron-infected individuals. Dotted line at 1.3 for vp-score = empirically determined cut-off value used to classify sera as negative or positive.

Similar articles

References

    1. Zhou P., Yang X.L., Wang X.G., Hu B., Zhang L., Zhang W., Si H.R., Zhu Y., Li B., Huang C.L., et al. A pneumonia outbreak associated with a new coronavirus of probable bat origin. Nature. 2020;579:270–273. doi: 10.1038/s41586-020-2012-7. - DOI - PMC - PubMed
    1. Zhu N., Zhang D., Wang W., Li X., Yang B., Song J., Zhao X., Huang B., Shi W., Lu R., et al. A Novel Coronavirus from Patients with Pneumonia in China, 2019. N. Engl. J. Med. 2020;382:727–733. doi: 10.1056/NEJMoa2001017. - DOI - PMC - PubMed
    1. Clemente-Suarez V.J., Dalamitros A.A., Beltran-Velasco A.I., Mielgo-Ayuso J., Tornero-Aguilera J.F. Social and Psychophysiological Consequences of the COVID-19 Pandemic: An Extensive Literature Review. Front. Psychol. 2020;11:580225. doi: 10.3389/fpsyg.2020.580225. - DOI - PMC - PubMed
    1. Ahmed F., Shafer L., Malla P., Hopkins R., Moreland S., Zviedrite N., Uzicanin A. Systematic review of empiric studies on lockdowns, workplace closures, and other non-pharmaceutical interventions in non-healthcare workplaces during the initial year of the COVID-19 pandemic: Benefits and selected unintended consequences. BMC Public Health. 2024;24:884. doi: 10.1186/s12889-024-18377-1. - DOI - PMC - PubMed
    1. Alizadeh H., Sharifi A., Damanbagh S., Nazarnia H., Nazarnia M. Impacts of the COVID-19 pandemic on the social sphere and lessons for crisis management: A literature review. Nat. Hazards. 2023;117:2139–2164. doi: 10.1007/s11069-023-05959-2. - DOI - PMC - PubMed

Publication types

Substances

Supplementary concepts