. 2024 Sep 20;16(9):1492.
doi: 10.3390/v16091492.

Optimization of Cellular Transduction by the HIV-Based Pseudovirus Platform with Pan-Coronavirus Spike Proteins

Affiliations

Optimization of Cellular Transduction by the HIV-Based Pseudovirus Platform with Pan-Coronavirus Spike Proteins

Syamala Rani Thimmiraju et al. Viruses. .

Abstract

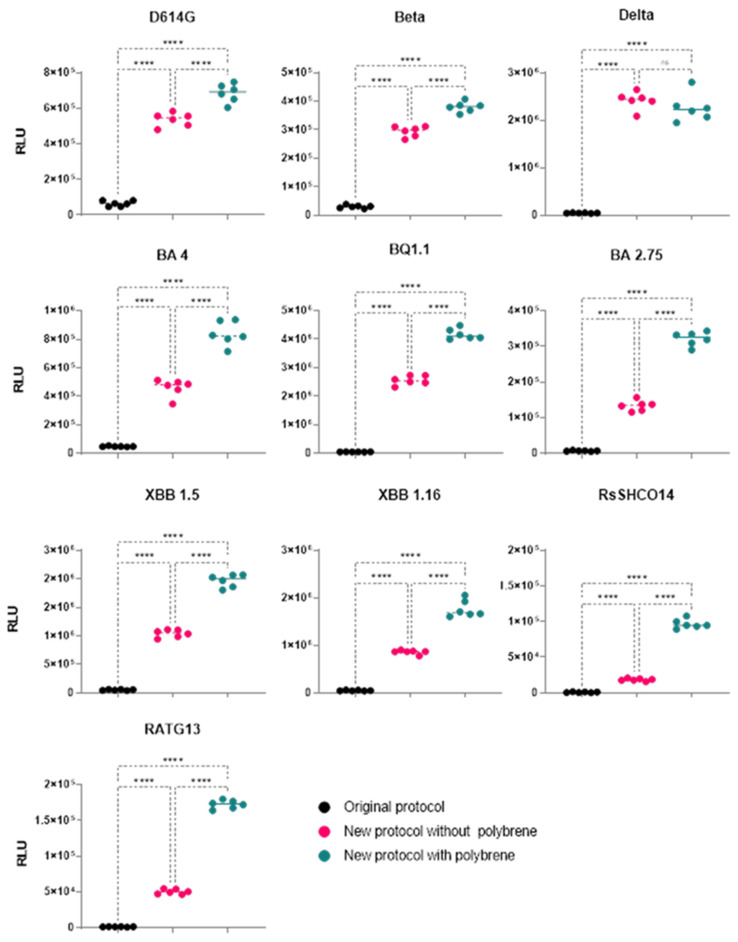
Over the past three years, new SARS-CoV-2 variants have continuously emerged, evolving to a point where an immune response against the original vaccine no longer provided optimal protection against these new strains. During this time, high-throughput neutralization assays based on pseudoviruses have become a valuable tool for assessing the efficacy of new vaccines, screening updated vaccine candidates against emerging variants, and testing the efficacy of new therapeutics such as monoclonal antibodies. Lentiviral vectors derived from HIV-1 are popular for developing pseudo and chimeric viruses due to their ease of use, stability, and long-term transgene expression. However, the HIV-based platform has lower transduction rates for pseudotyping coronavirus spike proteins than other pseudovirus platforms, necessitating more optimized methods. As the SARS-CoV-2 virus evolved, we produced over 18 variants of the spike protein for pseudotyping with an HIV-based vector, optimizing experimental parameters for their production and transduction. In this article, we present key parameters that were assessed to improve such technology, including (a) the timing and method of collection of pseudovirus supernatant; (b) the timing of host cell transduction; (c) cell culture media replenishment after pseudovirus adsorption; and (d) the centrifugation (spinoculation) parameters of the host cell+ pseudovirus mix, towards improved transduction. Additionally, we found that, for some pseudoviruses, the addition of a cationic polymer (polybrene) to the culture medium improved the transduction process. These findings were applicable across variant spike pseudoviruses that include not only SARS-CoV-2 variants, but also SARS, MERS, Alpha Coronavirus (NL-63), and bat-like coronaviruses. In summary, we present improvements in transduction efficiency, which can broaden the dynamic range of the pseudovirus titration and neutralization assays.

Keywords: coronaviruses; lentiviral pseudoviruses; neutralizing antibodies; polybrene; spinoculation; transduction efficiency.


Conflict of interest statement

Several of the authors are co-inventors of a COVID-19 recombinant protein vaccine technology held by Baylor College of Medicine (BCM). BCM has licensed this technology non-exclusively to multiple companies dedicated to improving vaccine access in low- and middle-income countries, with no patent restrictions. The authors themselves are not directly involved in the licensing negotiations led by BCM. None of the authors have additional competing financial or non-financial interests.

Figures

Figure 1
Figure 1
Important steps (AH) in pseudovirus production (left) and neutralization (right). (A) producer cell incubation (left)/sera heat inactivation (right) (B) co-transfection (left)/incubation (right) (C) pseudovirus supernatant collection (left)/neutralization (right) (D) Host cell incubation (E) Host cell Transduction (F) Spinoculation and incubation (G) Media replenishment (H) Luminescence reading. Within each panel, the left side depicts the original protocol, and the new protocol is shown on the right. In step B of the production panel, P = packaging plasmid, R = reporter plasmid, and S = spike envelop plasmid. The steps where experimental factors were optimized are indicated by green stars.
Figure 2
Figure 2
(A) Timing of pseudovirus supernatant collection. The bar graph compares the timing of pseudovirus collection on transduction efficiency, reflected by luminescence (RLU). Data were analyzed for significance (p < 0.05) using a two-tailed Mann–Whitney test. For all four variants studied, collecting pseudovirus supernatant at 48 h significantly (** represents p < 0.01) enhanced transduction numbers over collection at 72 h. (B) Method of supernatant collection. For all four variants studied, unfiltered supernatant showed equal or better RLU numbers than filtered supernatant. Data were analyzed for significance (p < 0.05) using a two-tailed Mann–Whitney test. RLU improvements were minimal for Delta (“ns” represents p > 0.05), while they were moderate in the case of D614G and BA4 (** represent p < 0.01), and maximum improvements (**** represent p < 0.0001) were observed for the Beta variant.
Figure 3
Figure 3
Host cell transduction timing after cell seeding (early vs. late transduction). Data were analyzed for significance (p < 0.05) using a two-tailed Mann–Whitney test. Compared to late transduction (16–18 h), early transduction (4–6 h) significantly (** represent p < 0.01) enhanced RLU numbers for all four variants studied. Data represents two different experiments with at least two replicates each.
Figure 4
Figure 4
Replenishment of media. Changing the cell culture media (16–18 h) after pseudovirus transduction resulted in higher transduction of cells. Data were analyzed for significance (p < 0.05) using a two-tailed Mann–Whitney test. Media change significantly (*** represent p < 0.001) enhanced infectivity (transduction) numbers for both variants studied. The data represent two experiments with at least two replicates each.
Figure 5
Figure 5
(A) Optimization of spinoculation speed and duration. The X-axis indicates a combination of centrifugation speeds (200 or 400× g) and duration (5, 30, or 60 min), while the Y-axis shows a % increase in RLU compared to no-spin controls. Data were analyzed for significance (p < 0.05) using a two-tailed Mann–Whitney test. For both variants studied, spinning for 60 min enhanced infectivity numbers significantly (* represent p < 0.05, ** represent p < 0.01, *** represent p < 0.001)); however, the spinoculation speed did not have a significant (“ns” represents p > 0.05) impact. (B) Spinoculation enhanced RLU numbers significantly (* represent p < 0.05, ** represent p < 0.01). The X-axis indicates either the presence or the absence of the spinoculation treatment (200× g for 60 min), while the Y-axis shows RLU. Data were analyzed for significance (p < 0.05) using a two-tailed Mann–Whitney test.
Figure 6
Figure 6
Comparison of the original protocol with the new protocol for linearity in the titration of pseudovirus particles. The X-axis shows the dilution factor of the pseudovirus used for transducing host cells, while the Y-axis shows luminescence (RLU). For all four variants studied, the new protocol enhanced RLU numbers by at least one log value. Both protocols indicated good linearity (regression R-value range in the parenthesis −0.98 to −1.0) for all four variants. However, the linearity improved with the new protocol (5 points spanning a dilution of 8–128), compared to the original protocol (3 points spanning a dilution of 4–16) due to increased dynamic range.
Figure 7
Figure 7
The effect of polybrene. RLU values (three different experiments with two replicates each) from the three protocols were analyzed for significance (p < 0.05) using one-way ANOVA and the Tukey test for multiple comparisons (“ns” represent p > 0.05, **** represent p < 0.0001). The new protocol improved transduction numbers by at least a log-fold for all ten variants studied Polybrene in combination with the new protocol resulted in similar (Delta) or better (rest of the variants) transduction numbers.
Figure 8
Figure 8
Coefficient of variation (CV%) analysis to assess variability within replicates in the original protocol, new protocol with polybrene, and new protocol without polybrene. CV% value is plotted on the Y-axis with each bar on the X-axis representing the value from 6 replicates of different spike variants. Variance observed using the original protocol ranged from 6 to 66%. With the new protocol (no polybrene), it ranged from 5 to 16%, and when polybrene was used in combination with the new protocol, the variance observed between the replicates was minimal at 4–13%.

References

    1. Kaufer A.M., Theis T., Lau K.A., Gray J.L., Rawlinson W.D. Laboratory Biosafety Measures Involving SARS-CoV-2 and the Classification as a Risk Group 3 Biological Agent. Pathology. 2020;52:790–795. doi: 10.1016/j.pathol.2020.09.006. - DOI - PMC - PubMed
    1. Tolah A.M.K., Sohrab S.S., Tolah K.M.K., Hassan A.M., El-Kafrawy S.A., Azhar E.I. Evaluation of a Pseudovirus Neutralization Assay for SARS-CoV-2 and Correlation with Live Virus-Based Micro Neutralization Assay. Diagnostics. 2021;11:994. doi: 10.3390/diagnostics11060994. - DOI - PMC - PubMed
    1. D’apice L., Trovato M., Gramigna G., Colavita F., Francalancia M., Matusali G., Meschi S., Lapa D., Bettini A., Mizzoni K., et al. Comparative Analysis of the Neutralizing Activity against SARS-CoV-2 Wuhan-Hu-1 Strain and Variants of Concern: Performance Evaluation of a Pseudovirus-Based Neutralization Assay. Front. Immunol. 2022;13:981693. doi: 10.3389/fimmu.2022.981693. - DOI - PMC - PubMed
    1. Feng S., Phillips D.J., White T., Sayal H., Aley P.K., Bibi S., Dold C., Fuskova M., Gilbert S.C., Hirsch I., et al. Correlates of Protection against Symptomatic and Asymptomatic SARS-CoV-2 Infection. Nat. Med. 2021;27:2032–2040. doi: 10.1038/s41591-021-01540-1. - DOI - PMC - PubMed
    1. Goldblatt D., Alter G., Crotty S., Plotkin S.A. Correlates of Protection against SARS-CoV-2 Infection and COVID-19 Disease. Immunol. Rev. 2022;310:6–26. doi: 10.1111/imr.13091. - DOI - PMC - PubMed

Publication types

Substances

Supplementary concepts

LinkOut - more resources