Meta-Analysis
. 2024 Sep 22;16(9):1498.
doi: 10.3390/v16091498.

(Re-)Emergence of Oropouche Virus (OROV) Infections: Systematic Review and Meta-Analysis of Observational Studies

Affiliations
Meta-Analysis

(Re-)Emergence of Oropouche Virus (OROV) Infections: Systematic Review and Meta-Analysis of Observational Studies

Matteo Riccò et al. Viruses. .

Abstract

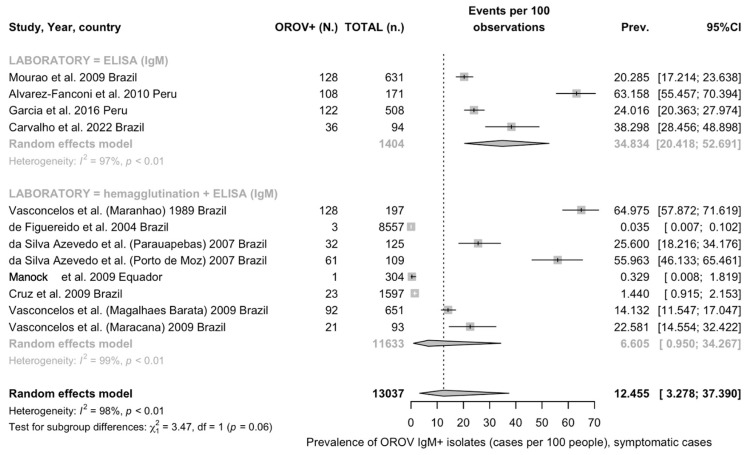
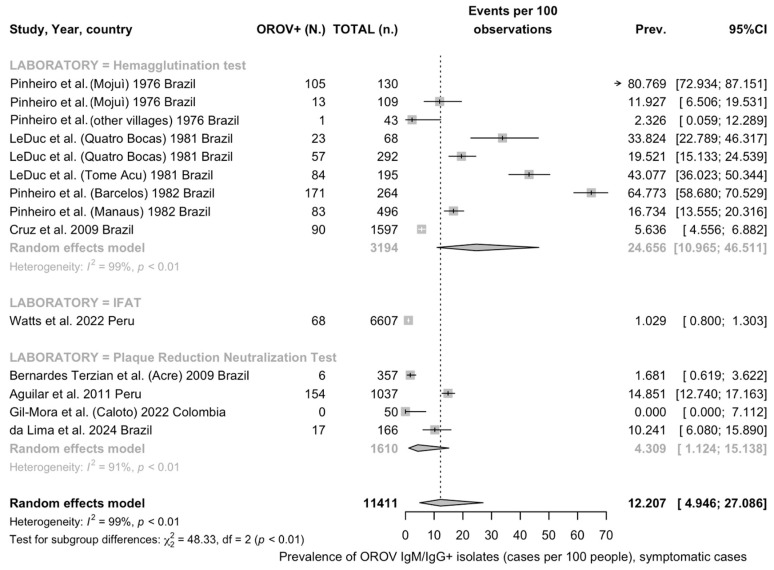
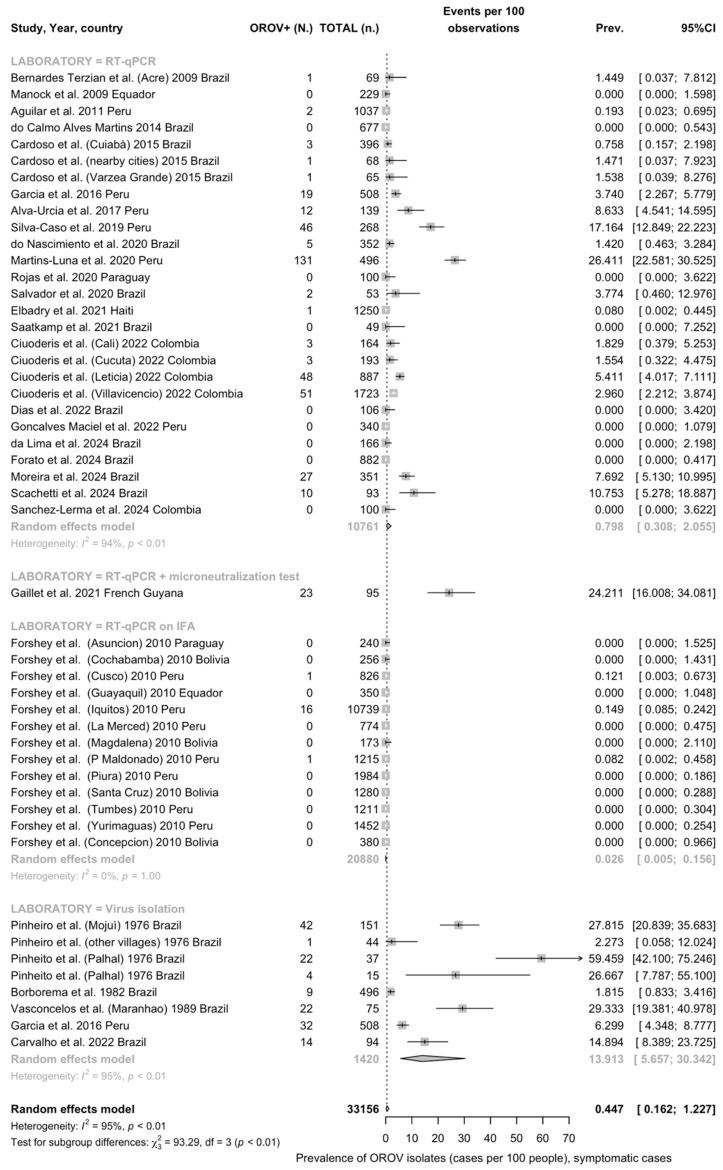
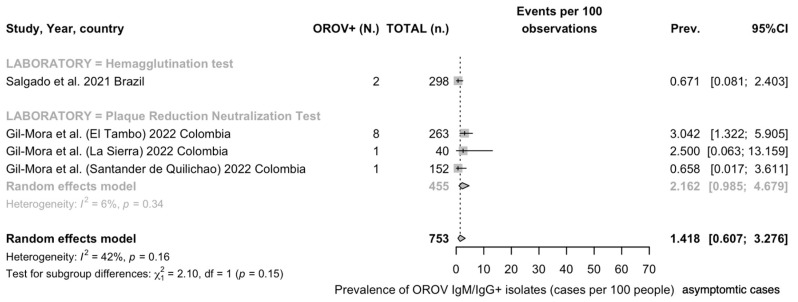
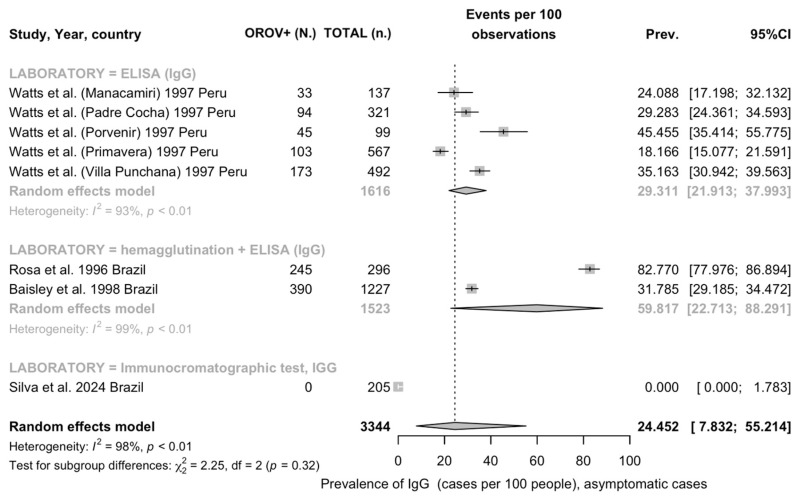
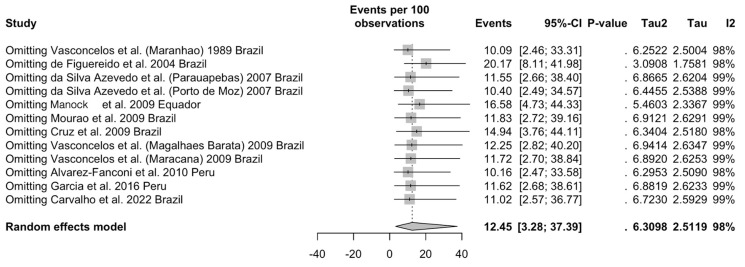
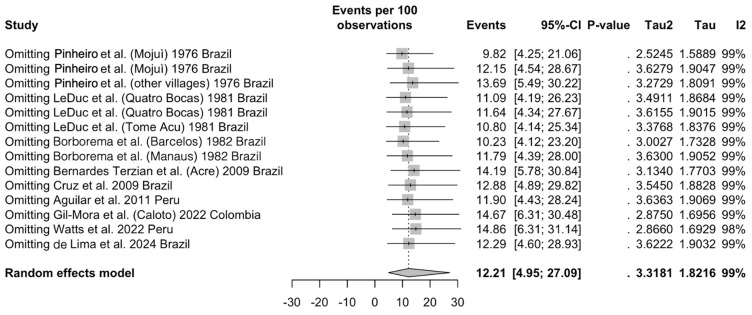
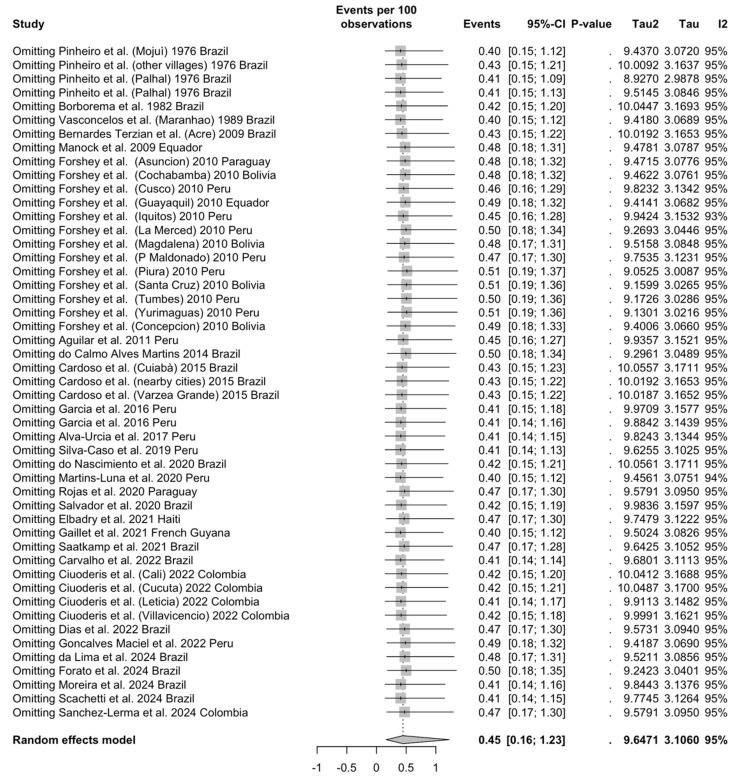
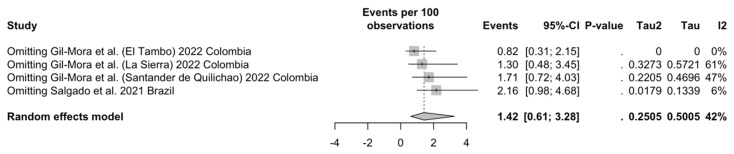
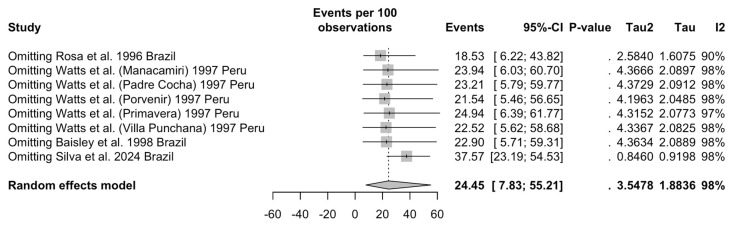
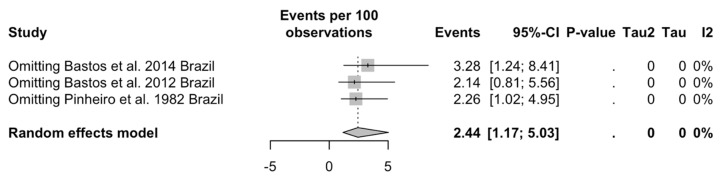
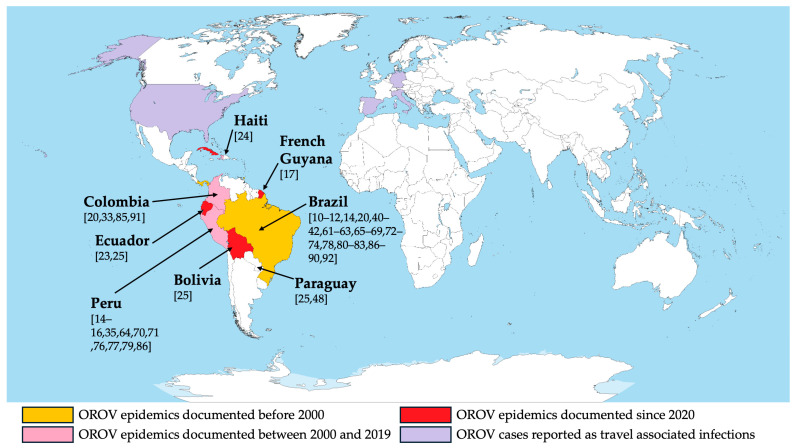
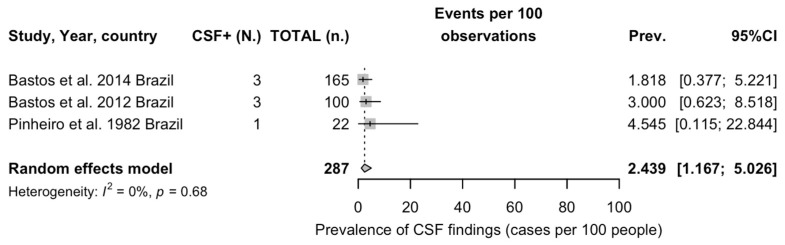
Oropouche Virus (OROV; genus of Orthobunyavirus) is the causal agent of Oropouche Fever (OF). Due to the lack of specific signs and symptoms and the limited availability of diagnostic tests, the actual epidemiology of OROV infections and OF has been extensively disputed. In this systematic review with meta-analysis, a literature search was carried out in PubMed, Scopus, EMBASE, and MedRxiv in order to retrieve relevant articles on the documented occurrence of OROV infections. Pooled detection rates were then calculated for anti-OROV antibodies and virus detection (i.e., viral RNA detected by viral cultures and/or real-time polymerase chain reaction [RT-qPCR]). Where available, detection rates for other arboviruses (i.e., Dengue [DENV], Chikungunya [CHKV], and Zika Virus [ZIKV]) were calculated and compared to those for OROV. A total of 47 studies from South America and the Caribbean were retrieved. In individuals affected by febrile illness during OROV outbreaks, a documented prevalence of 0.45% (95% confidence interval [95%CI] 0.16 to 1.12) for virus isolation, 12.21% (95%CI 4.96 to 27.09) for seroprevalence (including both IgM and IgG class antibodies), and 12.45% (95%CI 3.28 to 37.39) for the detection of OROV-targeting IgM class antibodies were eventually documented. In the general population, seroprevalence was estimated to be 24.45% (95%CI 7.83 to 55.21) for IgG class antibodies. The OROV detection rate from the cerebrospinal fluids of suspected cases of viral encephalitis was estimated to be 2.40% (95%CI 1.17 to 5.03). The occurrence of OROV infections was consistently lower than that of DENV, CHKV, and ZIKV during outbreaks (Risk Ratio [RR] 24.82, 95%CI 21.12 to 29.16; RR 2.207, 95%CI 1.427 to 3.412; and RR 7.900, 95%CI 5.386 to 11.578, respectively) and in the general population (RR 23.614, 95%CI 20.584 to 27.129; RR 3.103, 95%CI 2.056 to 4.685; and RR 49.500, 95%CI 12.256 to 199.921, respectively). In conclusion, our study stresses the possibly high underestimation of OROV prevalence in the general population of South America, the potential global threat represented by this arbovirus infection, and the potential preventive role of a comprehensive "One Health approach".

Keywords: Oropouche Virus; Orthobunyavirus; arbovirus; vector-borne disease.


Conflict of interest statement

The authors declare no conflicts of interest.

Figures

Figure A1
Figure A1
Forest plot on studies reporting on IgM seroprevalence for Oropouche Virus (OROV) among individuals reporting any febrile illness symptom (note: 95%CI = 95% confidence interval) [23,40,41,62,65,68,69,70,76,83].
Figure A2
Figure A2
Forest plot on studies reporting on IgM/IgG seroprevalence for Oropouche among individuals reporting any febrile illness symptom (note: 95%CI = 95% confidence interval; IFAT = indirect immunofluorescent antibody test) [10,11,12,16,61,68,71,85,87].
Figure A3
Figure A3
Forest plot on studies reporting on Oropouche Virus (OROV) isolates either through viral identification or real-time (quantitative) polymerase chain reaction (RT-qPCR) among symptomatic individuals (note: 95%CI = 95% confidence interval; IFA = indirect immunofluorescence assay) [10,11,12,14,16,17,20,23,24,25,33,35,40,41,42,48,61,62,63,64,65,66,67,68,69,70,71,72,73,74,75,76,77,78,79,80,81,82,83,84,85,86,87,88,89,90,91].
Figure A4
Figure A4
Forest plot on studies reporting on IgM/IgG for Oropouche Virus (OROV) seroprevalence among asymptomatic individuals (note: 95%CI = 95% confidence interval) [82,85].
Figure A5
Figure A5
Forest plot on studies reporting on IgG seroprevalence for Oropouche Virus (OROV) among asymptomatic individuals (note: 95%CI = 95% confidence interval; ELISA = enzyme-linked immune assay) [14,15,63,90].
Figure A6
Figure A6
Sensitivity analysis for meta-analysis of seroprevalence of Oropouche Virus IgM among subjects with any sign or symptom for arbovirus infection [23,40,41,62,65,68,69,70,76,83].
Figure A7
Figure A7
Sensitivity analysis for meta-analysis of seroprevalence of Oropouche Virus IgM/IgG among subjects with any sign or symptom for arbovirus infection [10,11,12,16,61,68,71,85,87].
Figure A8
Figure A8
Sensitivity analysis for meta-analysis of viral isolates for Oropouche Virus (viral particles and/or viral RNA) among subjects with any sign or symptom for arbovirus infection [10,11,12,14,16,17,20,23,24,25,33,35,40,41,42,48,61,62,63,64,65,66,67,68,69,70,71,72,73,74,75,76,77,78,79,80,81,82,83,84,85,86,87,88,89,90,91].
Figure A9
Figure A9
Sensitivity analysis for meta-analysis of seroprevalence of Oropouche Virus IgM/IgG among subjects without any sign or symptom for arbovirus infection [82,85].
Figure A10
Figure A10
Sensitivity analysis for meta-analysis of seroprevalence of Oropouche Virus IgG among subjects with any sign or symptom for arbovirus infection [14,15,63,90].
Figure A11
Figure A11
Sensitivity analysis for meta-analysis of viral isolates for Oropouche Virus (viral particles and/or viral RNA) from cerebrospinal fluid of subjects with any sign or symptom for arbovirus infection [61,72,73].
Figure A12
Figure A12
Funnel plots for findings included in meta-analysis: (a) seroprevalence of IgM for Oropouche Virus (OROV) among individuals with any sign/symptom of arbovirus infection; (b) seroprevalence of OROV IgG/IgM among individuals with any sign/symptom of arbovirus infection; (c) prevalence of OROV isolates (viral particles and/or viral RNA) among individuals with any sign/symptom of arbovirus infection; (d) seroprevalence of OROV IgG/IgM among individuals with any sign/symptom of arbovirus infection; (e) seroprevalence of OROV IgG among individuals with any sign/symptom of arbovirus infection; (f) prevalence of OROV isolates (viral particles and/or viral RNA) within cerebrospinal fluid of individuals with any sign/symptom of arbovirus infection [10,11,12,14,16,17,20,23,24,25,33,35,40,41,42,48,61,62,63,64,65,66,67,68,69,70,71,72,73,74,75,76,77,78,79,80,81,82,83,84,85,86,87,88,89,90,91].
Figure A12
Figure A12
Funnel plots for findings included in meta-analysis: (a) seroprevalence of IgM for Oropouche Virus (OROV) among individuals with any sign/symptom of arbovirus infection; (b) seroprevalence of OROV IgG/IgM among individuals with any sign/symptom of arbovirus infection; (c) prevalence of OROV isolates (viral particles and/or viral RNA) among individuals with any sign/symptom of arbovirus infection; (d) seroprevalence of OROV IgG/IgM among individuals with any sign/symptom of arbovirus infection; (e) seroprevalence of OROV IgG among individuals with any sign/symptom of arbovirus infection; (f) prevalence of OROV isolates (viral particles and/or viral RNA) within cerebrospinal fluid of individuals with any sign/symptom of arbovirus infection [10,11,12,14,16,17,20,23,24,25,33,35,40,41,42,48,61,62,63,64,65,66,67,68,69,70,71,72,73,74,75,76,77,78,79,80,81,82,83,84,85,86,87,88,89,90,91].
Figure A13
Figure A13
Radial plots for findings included in meta-analysis: (a) seroprevalence of IgM for Oropouche Virus (OROV) among individuals with any sign/symptom of arbovirus infection; (b) seroprevalence of OROV IgG/IgM among individuals with any sign/symptom of arbovirus infection; (c) prevalence of OROV isolates (viral particles and/or viral RNA) among individuals with any sign/symptom of arbovirus infection; (d) seroprevalence of OROV IgG/IgM among individuals with any sign/symptom of arbovirus infection; (e) seroprevalence of OROV IgG among individuals with any sign/symptom of arbovirus infection; (f) prevalence of OROV isolates (viral particles and/or viral RNA) within cerebrospinal fluid of individuals with any sign/symptom of arbovirus infection [10,11,12,14,16,17,20,23,24,25,33,35,40,41,42,48,61,62,63,64,65,66,67,68,69,70,71,72,73,74,75,76,77,78,79,80,81,82,83,84,85,86,87,88,89,90,91].
Figure A13
Figure A13
Radial plots for findings included in meta-analysis: (a) seroprevalence of IgM for Oropouche Virus (OROV) among individuals with any sign/symptom of arbovirus infection; (b) seroprevalence of OROV IgG/IgM among individuals with any sign/symptom of arbovirus infection; (c) prevalence of OROV isolates (viral particles and/or viral RNA) among individuals with any sign/symptom of arbovirus infection; (d) seroprevalence of OROV IgG/IgM among individuals with any sign/symptom of arbovirus infection; (e) seroprevalence of OROV IgG among individuals with any sign/symptom of arbovirus infection; (f) prevalence of OROV isolates (viral particles and/or viral RNA) within cerebrospinal fluid of individuals with any sign/symptom of arbovirus infection [10,11,12,14,16,17,20,23,24,25,33,35,40,41,42,48,61,62,63,64,65,66,67,68,69,70,71,72,73,74,75,76,77,78,79,80,81,82,83,84,85,86,87,88,89,90,91].
Figure 1
Figure 1
Flow chart of search strategy according to PRISMA 2020 strategy [49,50].
Figure 2
Figure 2
Summary of articles included in a systematic review on the epidemiology of Oropouche Virus infections by geographic location. References to original articles are reported in square brackets [10,11,12,13,15,16,19,22,23,24,32,34,39,40,41,47,60,61,62,63,64,65,66,67,68,69,70,71,72,73,74,75,76,77,78,79,80,81,82,83,84,85,86,87,88,89,90]. (Original file licensed under the GNU Free Documentation License, version 1.2; https://commons.wikimedia.org/wiki/File:A_large_blank_world_map_with_oceans_marked_in_blue.PNG, accessed on 12 September 2024.)
Figure 3
Figure 3
Summary of risk of bias (ROB) analysis of (a) observational studies (performed according to the risk of bias (ROB) tool from the National Toxicology Program (NTP)’s Office of Health Assessment and Translation (OHAT) handbook [54,92]).
Figure 4
Figure 4
Forest plot on studies reporting on positive status for Oropouche Virus of cerebrospinal fluid (CSF) specimens (note: 95%CI = 95% confidence interval) [60,71,72].

Similar articles

Cited by

References

    1. Wesselmann K.M., Postigo-Hidalgo I., Pezzi L., de Oliveira-Filho E.F., Fischer C., de Lamballerie X., Drexler J.F. Emergence of Oropouche Fever in Latin America: A Narrative Review. Lancet Infect. Dis. 2024;24:e439–e452. doi: 10.1016/S1473-3099(23)00740-5. - DOI - PubMed
    1. Sakkas H., Bozidis P., Franks A., Papadopoulou C. Oropouche Fever: A Review. Viruses. 2018;10:175. doi: 10.3390/v10040175. - DOI - PMC - PubMed
    1. Pereira R.S., Colangelo J.F., Souza P.G.A., de Carvalho L.G.F., da Cruz Nizer W.S., Lima W.G. Epidemiological Aspects of the Oropouche Virus (Orthobunyavirus) in South America: A Systematic Review. Rev. Colomb. Cienc. Quim. Farm. 2022;51:166–184. doi: 10.15446/rcciquifa.v51n1.102689. - DOI
    1. Tilston-Lunel N.L., Hughes J., Acrani G.O., da Silva D.E.A., Azevedo R.S.S., Rodrigues S.G., Vasconcelos P.F.C., Nunes M.R.T., Elliott R.M. Genetic Analysis of Members of the Species Oropouche Virus and Identification of a Novel M Segment Sequence. J. Gen. Virol. 2015;96:1636–1650. doi: 10.1099/vir.0.000108. - DOI - PMC - PubMed
    1. Sah R., Srivastava S., Kumar S., Golmei P., Rahaman S.A., Mehta R., Ferraz C., Apostolopoulos V., Rodriguez-Morales A.J. Oropouche Fever Outbreak in Brazil: An Emerging Concern in Latin America. Lancet Microbe. 2024;404:100904. doi: 10.1016/S2666-5247(24)00136-8. - DOI - PubMed

MeSH terms

Supplementary concepts

LinkOut - more resources